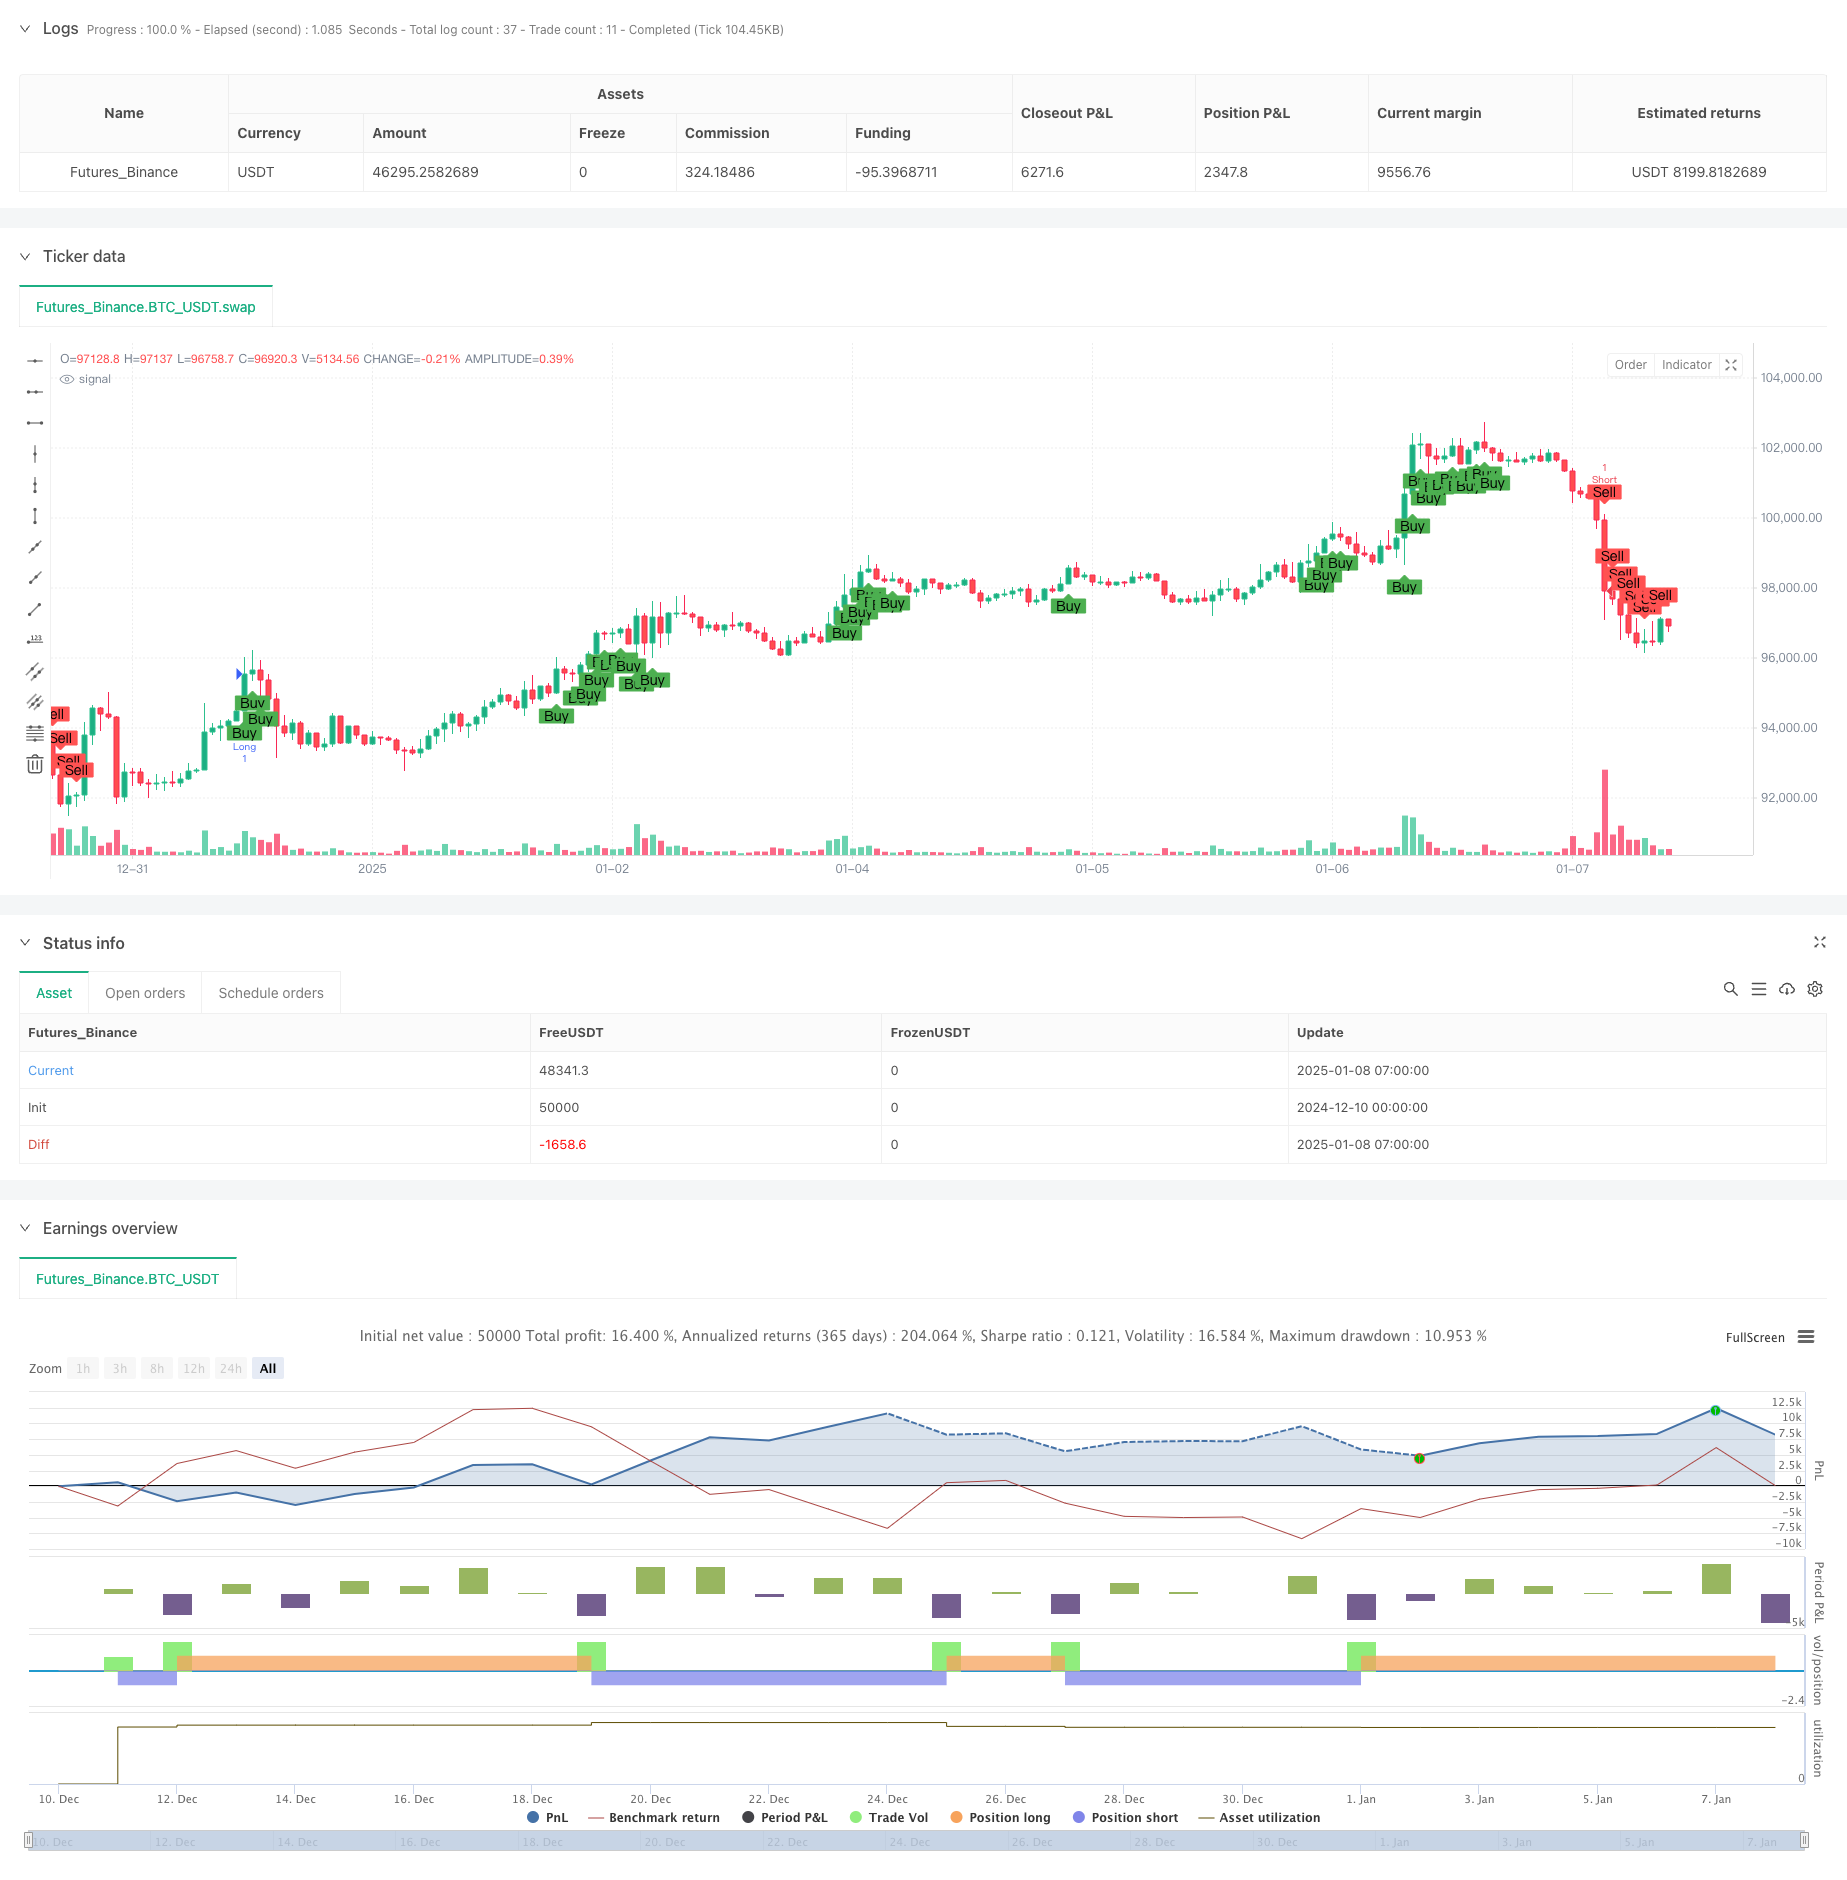
Doppelte EMA-RSI-Divergenzstrategie: Ein Trend-Erfassungssystem auf der Grundlage eines exponentiellen gleitenden Durchschnitts und relativer Stärke
Schriftsteller:ChaoZhang, Datum: 2025-01-10 15:03:06Tags:EMARSI

Übersicht
Dies ist eine Trendfolgestrategie, die den Exponential Moving Average (EMA) und den Relative Strength Index (RSI) kombiniert. Die Strategie identifiziert Handelssignale, indem sie die Überschneidung von schnellen und langsamen EMAs überwacht und gleichzeitig RSI-Überkauf-/Überverkaufsniveaus und RSI-Divergenz einbezieht, um Markttrends effektiv zu erfassen.
Strategieprinzipien
Die Kernlogik umfasst folgende Schlüsselelemente: 1. Verwendet 9-Perioden- und 26-Perioden-EMA, um die Trendrichtung zu bestimmen, wobei der Aufwärtstrend angezeigt wird, wenn die schnelle Linie über der langsamen Linie liegt 2. Benutzt einen 14-Perioden-RSI mit 65 und 35 als Schwellenwerte für lange und kurze Signale 3. Erkennt RSI-Divergenzen in einem Zeitrahmen von 1 Stunde, indem Preishochs/Tiefs mit RSI-Hochs/Tiefs verglichen werden 4. Für einen langen Einstieg sind folgende Voraussetzungen erforderlich: schnelle EMA über langsame EMA, RSI über 65 und keine rückläufige RSI-Divergenz 5. Kurzer Einstieg erfordert: schnelle EMA unter der langsamen EMA, RSI unter 35, und keine bullische RSI Divergenz
Strategische Vorteile
- Die Kreuzvalidierung mehrerer technischer Indikatoren verbessert die Signalsicherheit
- Die Erkennung von RSI-Divergenzen verringert das Risiko eines falschen Ausbruchs
- Kombination von Vorteilen von Trend-nachfolgenden und überkauften/überverkauften Bedingungen
- Die Parameter können für verschiedene Marktmerkmale optimiert werden
- Eine klare strategische Logik, die leicht zu verstehen und umzusetzen ist
Strategische Risiken
- EMA als nachlassender Indikator kann zu suboptimalen Einstiegspunkten führen
- Der RSI kann in verschiedenen Märkten übermäßige Signale erzeugen.
- Bei der Ermittlung von Abweichungen können vor allem auf volatilen Märkten falsche Messwerte ermittelt werden
- Bei schnellen Marktumkehrungen möglicher erheblicher Rückzug Schadensminderungsmaßnahmen
- Hinzufügen von Stop-Loss- und Take-Profit-Einstellungen
- Überlegen Sie, ob Sie die Verifizierung des Volumenindikators hinzufügen
- Anpassung von RSI-Schwellenwerten in verschiedenen Märkten
Optimierungsrichtlinien
- Einführung anpassungsfähiger RSI-Schwellenwerte auf der Grundlage der Marktvolatilität
- Einbeziehung von Lautstärkenindikatoren zur Signalbestätigung
- Entwicklung präziserer Divergenzdetektionsalgorithmen
- Hinzufügen von Stop-Loss- und Gewinnmanagementmechanismen
- Erwägen Sie, Marktvolatilitätsfilter hinzuzufügen
Zusammenfassung
Diese Strategie baut ein relativ vollständiges Handelssystem auf, indem sie gleitende Durchschnitte, Impulsindikatoren und Divergenzanalyse kombiniert. Sie betont die mehrfache Signalverifizierung, um die Risiken falscher Beurteilungen effektiv zu reduzieren.
/*backtest
start: 2024-12-10 00:00:00
end: 2025-01-08 08:00:00
period: 1h
basePeriod: 1h
exchanges: [{"eid":"Futures_Binance","currency":"BTC_USDT"}]
*/

//@version=5
strategy("EMA9_RSI_Strategy_LongShort", overlay=true)

// Parameters
fastLength = input.int(9, minval=1, title="Fast EMA Length")
slowLength = input.int(26, minval=1, title="Slow EMA Length")
rsiPeriod = input.int(14, minval=1, title="RSI Period")
rsiLevelLong = input.int(65, minval=1, title="RSI Level (Long)")
rsiLevelShort = input.int(35, minval=1, title="RSI Level (Short)")

// Define 1-hour timeframe
timeframe_1h = "60"

// Fetch 1-hour data
high_1h = request.security(syminfo.tickerid, timeframe_1h, high)
low_1h = request.security(syminfo.tickerid, timeframe_1h, low)
rsi_1h = request.security(syminfo.tickerid, timeframe_1h, ta.rsi(close, rsiPeriod))

// Current RSI
rsi = ta.rsi(close, rsiPeriod)

// Find highest/lowest price and corresponding RSI in the 1-hour timeframe
highestPrice_1h = ta.highest(high_1h, 1) // ราคาสูงสุดใน 1 ช่วงของ timeframe 1 ชั่วโมง
lowestPrice_1h = ta.lowest(low_1h, 1)   // ราคาต่ำสุดใน 1 ช่วงของ timeframe 1 ชั่วโมง
highestRsi_1h = ta.valuewhen(high_1h == highestPrice_1h, rsi_1h, 0)
lowestRsi_1h = ta.valuewhen(low_1h == lowestPrice_1h, rsi_1h, 0)

// Detect RSI Divergence for Long
bearishDivLong = high > highestPrice_1h and rsi < highestRsi_1h
bullishDivLong = low < lowestPrice_1h and rsi > lowestRsi_1h
divergenceLong = bearishDivLong or bullishDivLong

// Detect RSI Divergence for Short (switch to low price for divergence check)
bearishDivShort = low > lowestPrice_1h and rsi < lowestRsi_1h
bullishDivShort = high < highestPrice_1h and rsi > highestRsi_1h
divergenceShort = bearishDivShort or bullishDivShort

// Calculate EMA
emaFast = ta.ema(close, fastLength)
emaSlow = ta.ema(close, slowLength)

// Long Conditions
longCondition = emaFast > emaSlow and rsi > rsiLevelLong and not divergenceLong

// Short Conditions
shortCondition = emaFast < emaSlow and rsi < rsiLevelShort and not divergenceShort

// Plot conditions
plotshape(longCondition, title="Buy", location=location.belowbar, color=color.green, style=shape.labelup, text="Buy")
plotshape(shortCondition, title="Sell", location=location.abovebar, color=color.red, style=shape.labeldown, text="Sell")

// Execute the strategy
if (longCondition)
    strategy.entry("Long", strategy.long, comment="entry long")

if (shortCondition)
    strategy.entry("Short", strategy.short, comment="entry short")

// Alert
alertcondition(longCondition, title="Buy Signal", message="Buy signal triggered!")
alertcondition(shortCondition, title="Sell Signal", message="Sell signal triggered!")
- Multiperiodische RSI-Impulsentwicklung und dreifacher EMA-Trend nach einer zusammengesetzten Strategie
- Dual Exponential Moving Average und Relative Strength Index Crossover-Strategie
- Dynamischer gleitender Durchschnittstrend mit RSI-Bestätigungshandelsstrategie
- Niedriger Finder
- EMA Crossover Fibonacci-Umkehrstrategie
- EMA, RSI, Volumen-Preis-Trend, Verwöhnungsmuster
- EMA-Bühen-Kreuzungsstrategie
- Multi-Timeframe RSI-EMA-Momentum-Handelsstrategie mit Skalierung der Positionen
- Das EMA-RSI-Momentum-Trend-Reversal-Trading-System ist eine Dynamik-Durchbruchstrategie, die auf einem EMA- und RSI-Crossover basiert.
- Dynamische mehrjährige quantitative Handelsstrategie, die RSI und EMA kombiniert
- Erweiterte Strategie für die Dynamik der Preis-Volumen-Trendentwicklung
- Intelligente Kreuzungsstrategie für gleitende Durchschnitte mit dynamischem Gewinn-/Verlustmanagementsystem
- Adaptive Multi-MA-Momentum-Breakthrough-Handelsstrategie
- Adaptive Dynamik-Mittelumkehr-Kreuzung-Strategie
- Adaptives EMA-Trendhandelssystem mit umgekehrter Handelsoptimierungsstrategie
- Das EMA-Pullback-Handelssystem mit ATR-basierter dynamischer Stop-Loss-Optimierung
- Mehrzeitrahmen-Phasenübergang mit der EMA-Trendstrategie
- Nach der RSI-Oszillationsstrategie mehrere gleitende Durchschnittsquerschnittstrends
- Mehrjährige Bollinger-Bänder Trend-Breakout-Strategie mit Volatilitätsrisikokontrollmodell
- Dynamische Unterstützung und Widerstand Adaptive Pivot-Handelsstrategie
- Der Wert des Wertpapiers wird auf der Basis der in Artikel 4 Absatz 1 Buchstabe b genannten Methode berechnet.
- Längfristige Trend-SMA-Quantitative Strategie
- Multi-Technical Indicator Fusion Trend nach einer quantitativen Handelsstrategie
- Multi-Technischer Indikator Momentum-MA-Trend nach Strategie
- Triple EMA Crossover Trading System mit einem intelligenten auf R2R basierenden Stop Loss Management
- Dynamische volatilitätsgetriebene hochfrequente EMA-Quantitative Strategie
- Handelsstrategie zur Umkehrung der Dynamik des Dualen Technischen Indikators mit einem Risikomanagementsystem
- Mehrzeitrahmen-quantitative Handelsstrategie auf der Grundlage von EMA-glätteten RSI und ATR Dynamic Stop-Loss/Take-Profit
- Adaptive Fibonacci-Bollinger-Bänder Strategieanalyse
- Handelsstrategie mit mehreren Zeitrahmen