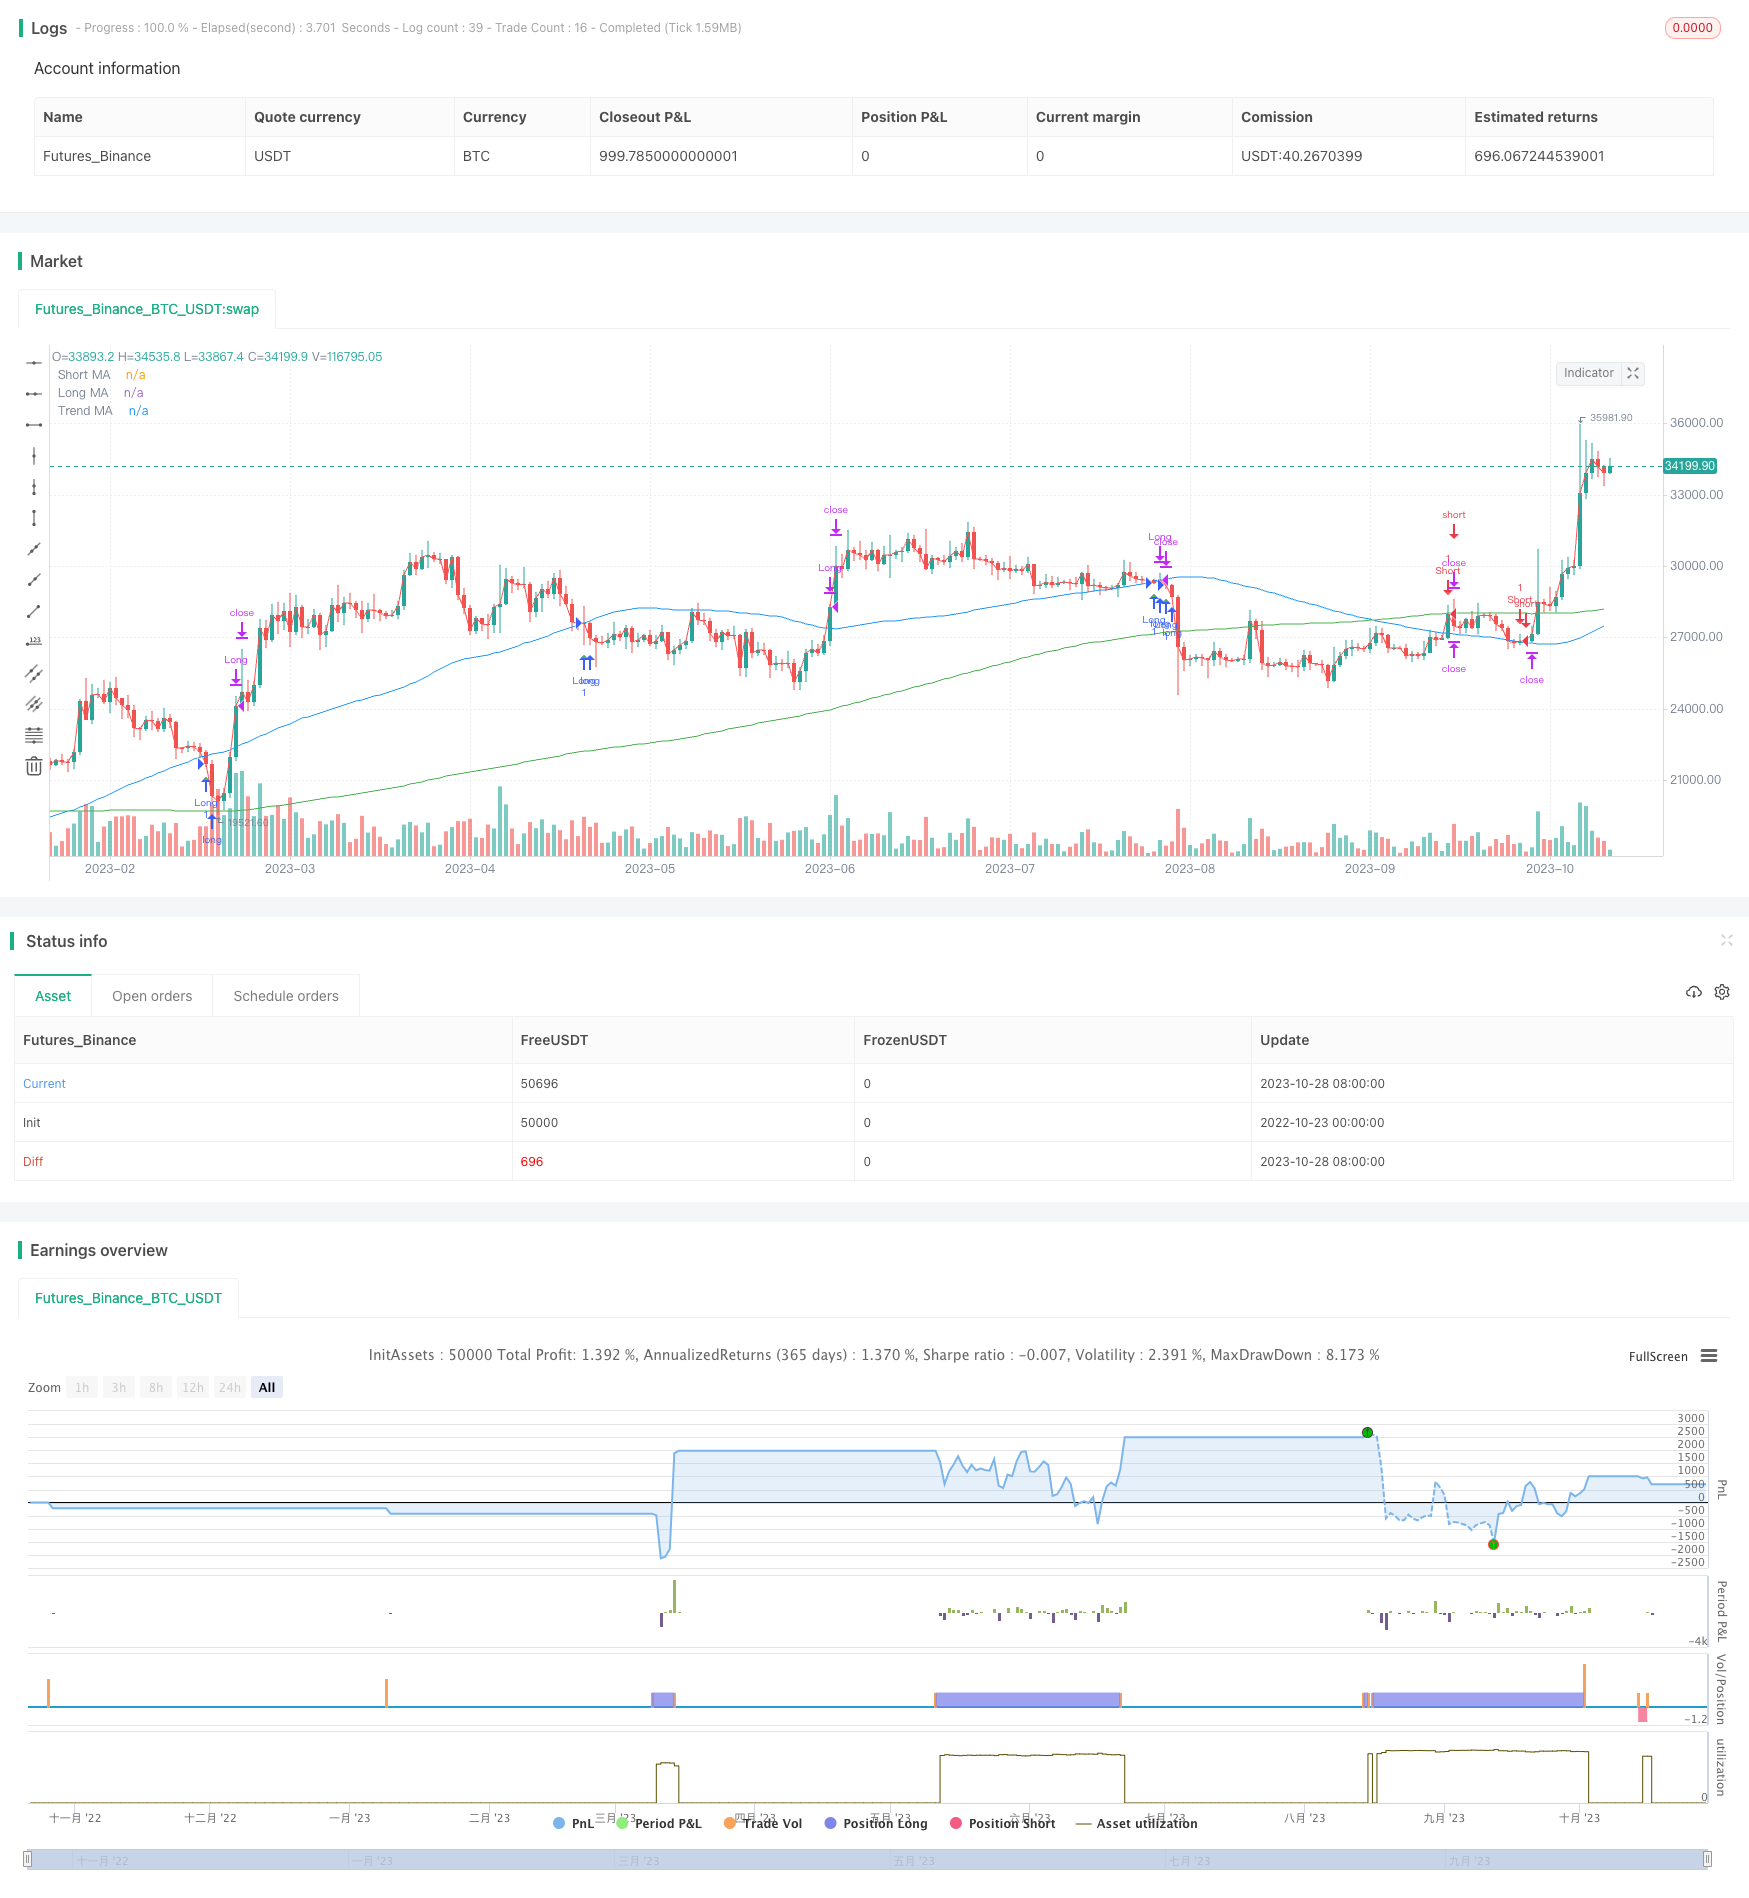
Golden Cross Death Cross Moving Average Trading Strategy
Author: ChaoZhang, Date: 2023-10-30 14:42:09Tags:

Overview: This strategy implements golden cross and death cross trading based on three moving averages with different periods. It goes long when the short period MA crosses above the long period MA, and goes short when the short period MA crosses below the long period MA. The trend direction is determined by the trend MA line.
Strategy Logic:
Define three MAs - short period MA, long period MA and trend MA. The periods are 20, 200 and 50 respectively.
A buy signal is generated when the short period MA crosses above the long period MA. A sell signal is generated when the short period MA crosses below the long period MA.
Check if both the short and long MAs are above the trend MA. If not, the signal is filtered out to avoid trading against the trend.
Set stop loss and take profit as a percentage of the entry price. Optimize parameters based on backtesting.
Plot the MA crossover points to visualize entry signals.
Advantages:
Simple and intuitive strategy logic, easy to understand and implement.
Can effectively capture mid-term trends and trade with the momentum.
Filtering with trend MA avoids trading against the trend.
MA periods can be adjusted for different market conditions.
Customizable stop loss and take profit to control risks.
Risks:
Sharp volatile moves may trigger stop loss.
Larger losses when trend reverses.
Improper parameter tuning may lead to overtrading or missing opportunities.
Transaction costs need to be considered.
Enhancements:
Add volatility filter like ATR to avoid false signals.
Use machine learning to dynamically optimize parameters.
Add more indicators like MACD to determine trend.
Implement trailing stop loss to lock in profits.
Backtest to find optimal stop loss and take profit levels.
Conclusion:
The strategy captures trends effectively with clear logic and easy execution. Controlling risks with trend filter, stop loss and take profit. Parameter tuning requires optimization for market conditions. More indicators can improve performance. Suitable for mid-term trend trading. Performed well in backtest and demo trading. In live trading, beware of whipsaws and trend reversal risks. Has practical value overall.
/*backtest
start: 2022-10-23 00:00:00
end: 2023-10-29 00:00:00
period: 1d
basePeriod: 1h
exchanges: [{"eid":"Futures_Binance","currency":"BTC_USDT"}]
*/

//@version=5
strategy("XAU M15", overlay=true)

// Define input parameters
long_length = input.int(64, title="Long MA Length")
short_length = input.int(1, title="Short MA Length")
trend_length = input.int(200, title="Trend MA Length")

// Calculate moving averages
long_ma = ta.sma(close, long_length)
short_ma = ta.sma(close, short_length)
trend_ma = ta.sma(close, trend_length)

// Plot moving averages on chart
plot(long_ma, color=color.blue, title="Long MA")
plot(short_ma, color=color.red, title="Short MA")
plot(trend_ma, color=color.green, title="Trend MA")

// Entry conditions
enterLong = ta.crossover(long_ma, short_ma) and long_ma > trend_ma and short_ma > trend_ma
enterShort = ta.crossunder(long_ma, short_ma) and long_ma < trend_ma and short_ma < trend_ma

if (enterLong)
    strategy.entry("Long", strategy.long)

if (enterShort)
    strategy.entry("Short", strategy.short)

// Exit conditions
exitLong = ta.crossunder(long_ma, short_ma)
exitShort = ta.crossover(long_ma, short_ma)

if (exitLong)
    strategy.close("Long")

if (exitShort)
    strategy.close("Short")

// Set stop loss and take profit levels
long_stop_loss_percentage = input(1, title="Long Stop Loss (%)") / 100
long_take_profit_percentage = input(3, title="Long Take Profit (%)") / 100

short_stop_loss_percentage = input(1, title="Short Stop Loss (%)") / 100
short_take_profit_percentage = input(3, title="Short Take Profit (%)") / 100

strategy.exit("Take Profit/Stop Loss", "Long", stop=close * (1 - long_stop_loss_percentage), limit=close * (1 + long_take_profit_percentage))
strategy.exit("Take Profit/Stop Loss", "Short", stop=close * (1 + short_stop_loss_percentage), limit=close * (1 - short_take_profit_percentage))

plotshape(series=enterLong, title="Buy Entry", location=location.belowbar, color=color.green, style=shape.triangleup, size=size.tiny)
plotshape(series=enterShort, title="Sell Entry", location=location.abovebar, color=color.red, style=shape.triangledown, size=size.tiny)
- Trend Trading Strategy Based on Moving Average
- RSI Long Short Balance Trading Strategy
- Tesla Supertrend Strategy
- Three Inside Up Reversal Strategy
- Dual Moving Average Crossover Algorithmic Trading Strategy
- Trend Following Strategy with Trailing Stop Loss
- RSI Threshold Trading Strategy
- Strong Trend Breakout Strategy
- ZigZag Based Trend Following Strategy
- Ichimoku Equilibrium Strategy
- Trend Strategy Based on HULL SMA and EMA Crossover
- Dual EMA Crossover Strategy
- Trend-Following Strategy Based on Moving Average Breakout
- MACD Closing Turtle Hybrid Strategy
- Multi Timeframe Take Profit Strategy
- Low Point Rebound Strategy
- Momentum Reversal Combo Strategy
- Volume Difference Delta Cycle Oscillator Trading Strategy
- MA Trendline Breakthrough Strategy
- Momentum Trend Following Strategy