VB Strategy Based on Volume Balances
Author: ChaoZhang, Date: 2023-10-30 17:03:02Tags:

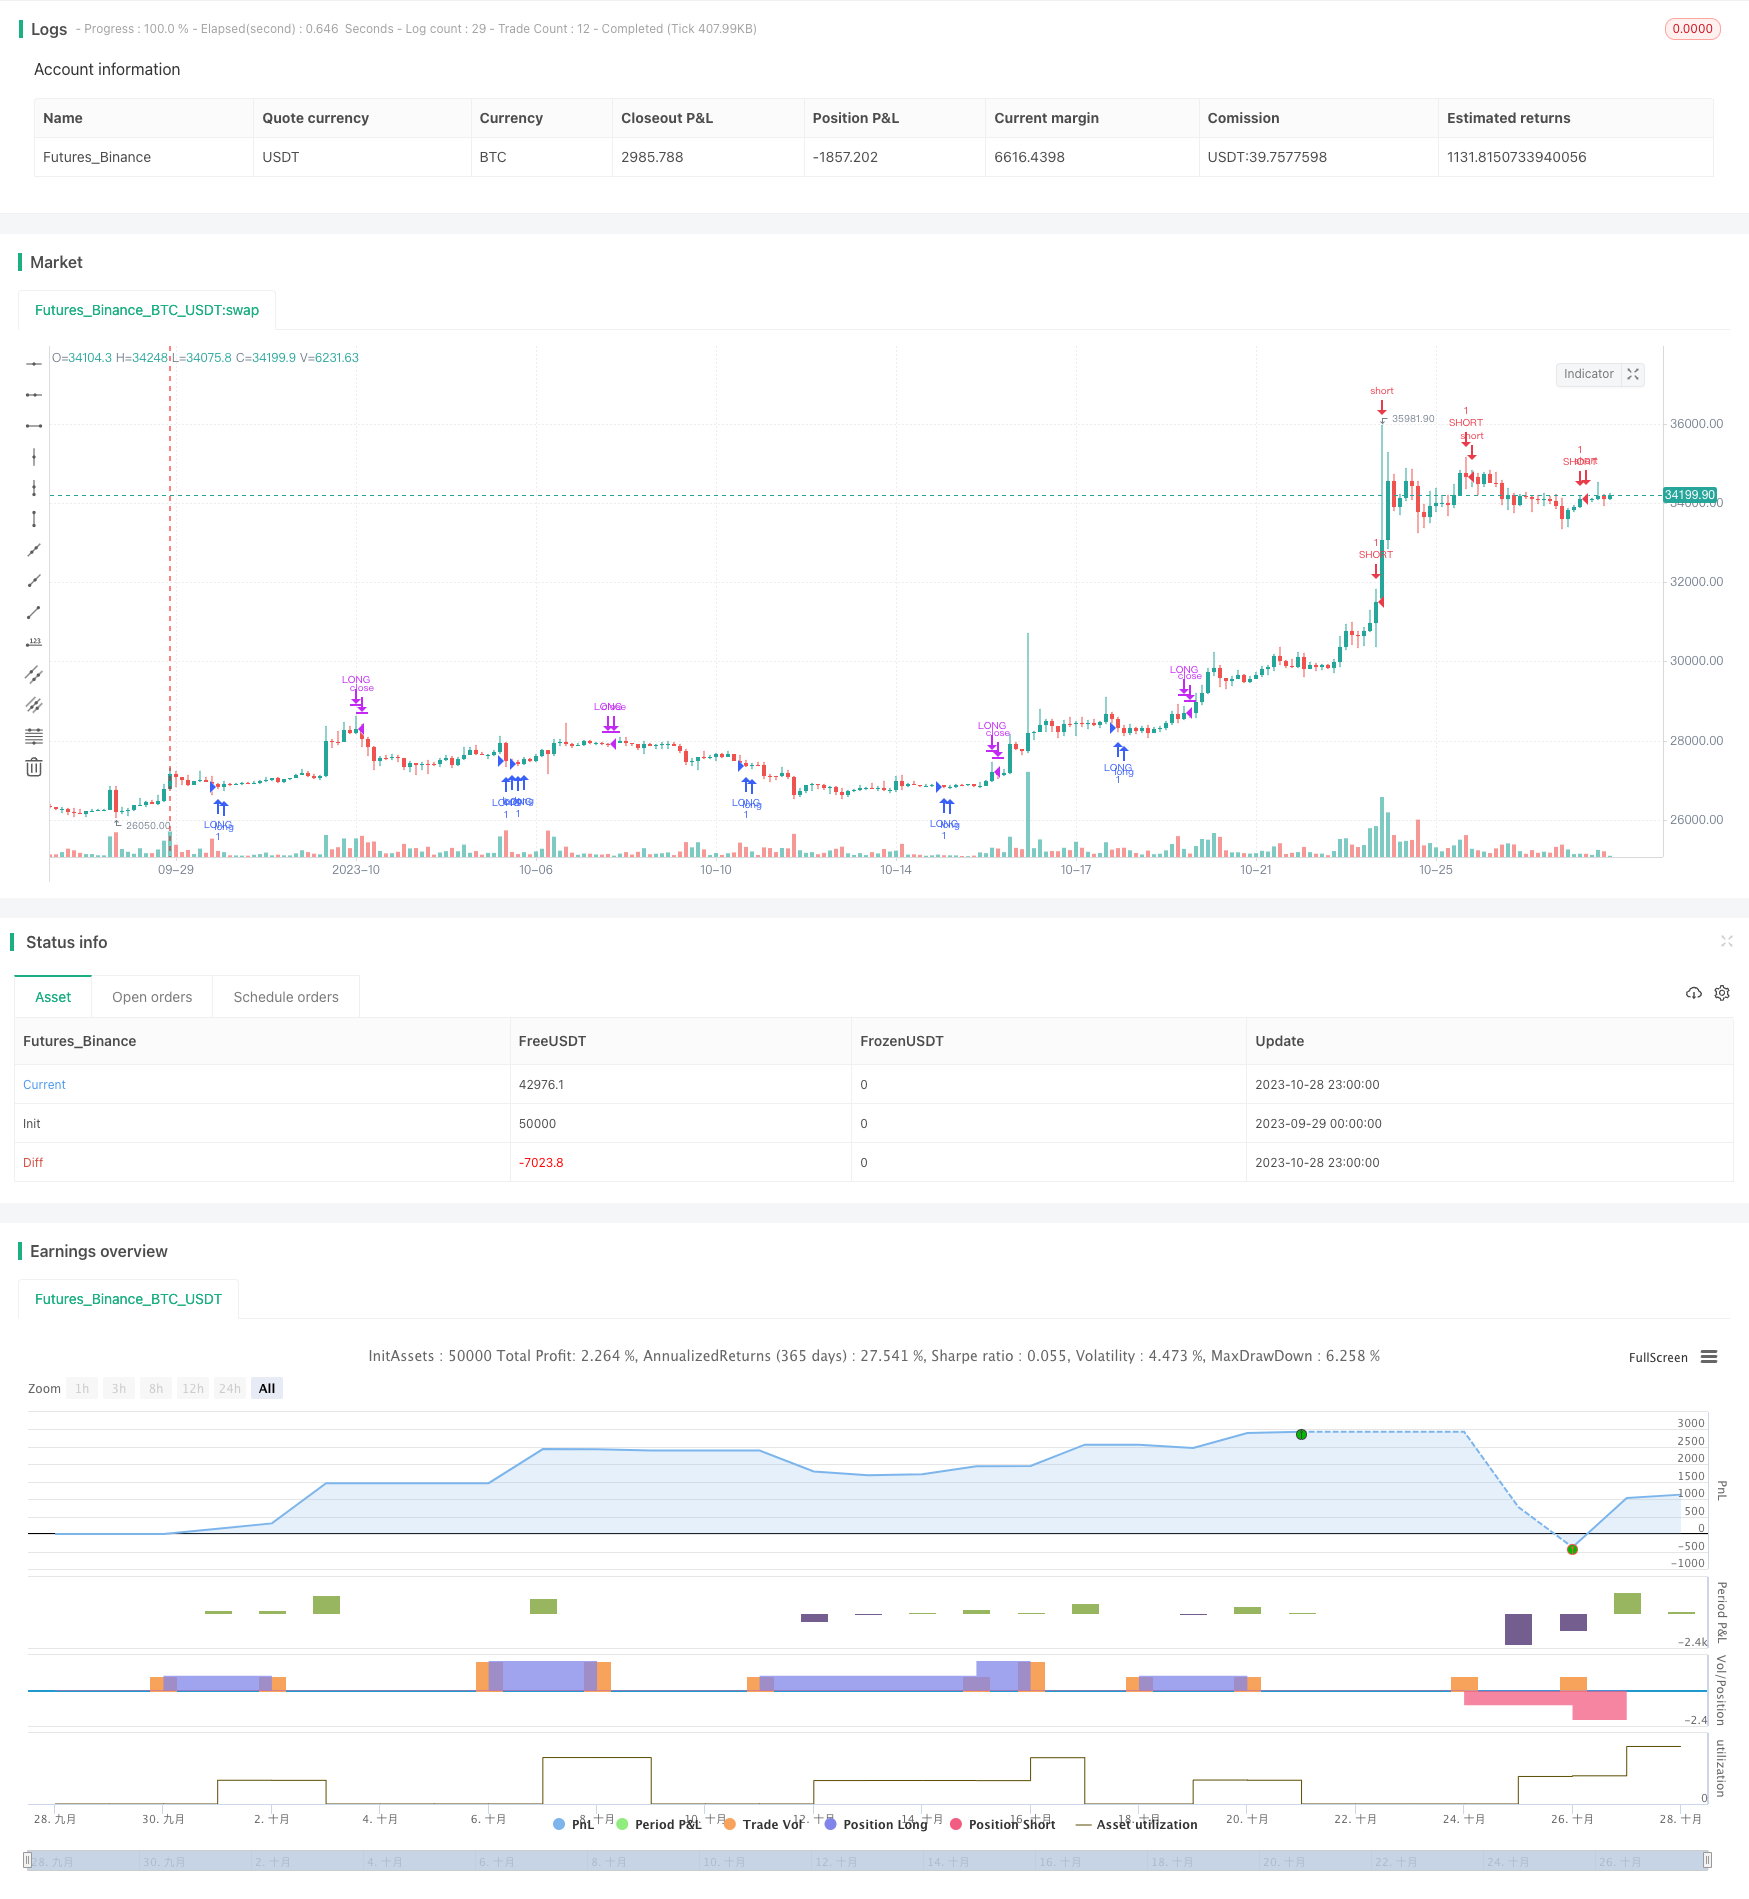
This strategy is designed based on the Volume Balances indicator to determine the buying and selling power in the market.
Strategy Logic
The Volume Balances (VB) indicator reflects the driving force of volume changes on prices. Its construction idea is:
Calculate the intraday volatility rate of typical price as the price momentum.
Judge the buying and selling power at close by the product of volume and price momentum.
The indicator fluctuates above and below the 0-axis. The criteria for measuring buying and selling power is the positivity and negativity of the indicator value.
This strategy constructs the VB indicator and sets a signal line. A buy signal is generated when the VB indicator crosses above the signal line. A sell signal is generated when the VB indicator crosses below the signal line.
The main steps of the code are:
Calculate the intraday volatility rate of typical price inter as the price momentum.
Set the cutoff range coef for the momentum. The excess momentum above the range is taken as coef.
Calculate the quantified momentum vcp after cutoff.
Sum vcp to obtain the quantified indicator vfi.
Set the length of the signal line signalLength and obtain it vfima.
Compare the VB indicator vfi with the signal line vfima to generate trading signals.
Advantages
The advantages of this strategy are:
Use the volume-price relationship to judge the buying and selling power, unaffected by the price itself.
The calculation range of the quantified momentum can be controlled by parameters to avoid the impact of abnormal fluctuations.
Combining the comparison between the VB indicator itself and the signal line can set reasonable entry timing.
The indicator calculation method is simple and clear, easy to operate in live trading.
Customizable indicator parameters and signal line parameters for optimizing strategy performance.
Risks
There are also some risks in this strategy:
The VB indicator is sensitive to abnormal price fluctuations. Proper cutoff parameters need to be set.
The probability of price divergence from indicator signals is high. Blind following should be avoided.
Indicator parameters and signal line parameters need proper optimization to prevent false signals.
More suitable for products with obvious volume-price characteristics. Not suitable for low liquidity products.
Pay attention to the divergence of the indicator, which may signal a market reversal.
Risks can be controlled by adjusting parameter range, using other filters, allowing proper loose stop loss, etc.
Optimization Directions
The strategy can be optimized in the following aspects:
Optimize calculation parameters for quantified momentum to balance sensitivity and stability.
Optimize signal line parameters to balance lag and noise.
Add other indicators like Volume Spread Analysis for verification.
Add trend and support/resistance indicators to avoid unfavorable trades.
Set dynamic stop loss based on market volatility.
Use machine learning to find the optimal parameter combination.
Backtest across variety of products and timeframes to evaluate robustness.
Compare indicator parameters’ impact on profit curve to find the optimum.
Summary
This strategy judges buying/selling power based on the Volume Balances indicator. It has advantages like simple indicator design and adjustable parameters, and also risks like false signals. Further optimization and verification from multiple aspects can improve live performance.
/*backtest
start: 2023-09-29 00:00:00
end: 2023-10-29 00:00:00
period: 3h
basePeriod: 15m
exchanges: [{"eid":"Futures_Binance","currency":"BTC_USDT"}]
*/

//@version=3
strategy("VB Strategy", overlay=true)

length = input(130, title="거래량 길이")
coef = input(0.2, title="계수")
vcoef = input(2.5, title="최대 계수")
signalLength=input(5)
smoothVFI=input(false, type=bool, title="부드럽게")
//볼밴
length2 = input(20, minval=1, title="볼밴 길이")

ma(x,y) => smoothVFI ? sma(x,y) : x

typical=hlc3
inter = log( typical ) - log( typical[1] )
vinter = stdev(inter, 30 )
cutoff = coef * vinter * close
vave = sma( volume, length )[1]
vmax = vave * vcoef
vc = iff(volume < vmax, volume, vmax)
mf = typical - typical[1]
vcp = iff( mf > cutoff, vc, iff ( mf < -cutoff, -vc, 0 ) )

vfi = ma(sum( vcp , length )/vave, 3)
vfima=ema( vfi, signalLength )
d=vfi-vfima

upper = vfima + stdev(vfi, length2)
lower = vfima - stdev(vfi, length2)

buysignal = cross(vfi, lower) and crossunder(vfi, lower) == 1 ? vfima : na

sellsignal = cross(vfi, upper) and crossover(vfi, upper) == 1 ? vfima : na

//times = timestamp("GMT+6", 2017, 12, 6, 00, 00)

//if (buysignal and times <= time)
if (buysignal)
    if(strategy.position_size < 0)
        strategy.close("SHORT")

    if(strategy.position_size > 0)
        strategy.order("LONG", true, 1, when = (low+high)/2)

    if(strategy.position_size == 0)
        strategy.entry("LONG", strategy.long, when = (low+high)/2)

//if (sellsignal and times <= time)
if (sellsignal)
    if(strategy.position_size > 0)
        strategy.close("LONG")

    if(strategy.position_size < 0)
        strategy.order("SHORT", false, 1, when = (low+high)/2)

    if(strategy.position_size == 0)
        strategy.entry("SHORT", strategy.short, when = (low+high)/2)
- Bollinger Bands Reversal Oscillation Trend Strategy
- EMA and MAMA Indicators Based Trading Strategy
- Ehlers Leading Indicator Trading Strategy
- trend-following strategy based on moving averages
- Leledec DEC Strategy
- Stochastic RSI with Auto Buy Scalper Strategy
- Breakout Trading Strategy with Scalability
- Bollinger Bands and StochRSI Momentum Strategy
- RSI Long Short Automated Trading Strategy
- Trendless MACD Strategy
- Volatility Breakout Trading Strategy
- Triple Moving Average Crossover Strategy
- Strategy of Support & Resistance with MACD LONG
- Trend Trading Strategy Based on Moving Average
- RSI Long Short Balance Trading Strategy
- Tesla Supertrend Strategy
- Three Inside Up Reversal Strategy
- Dual Moving Average Crossover Algorithmic Trading Strategy
- Trend Following Strategy with Trailing Stop Loss
- RSI Threshold Trading Strategy