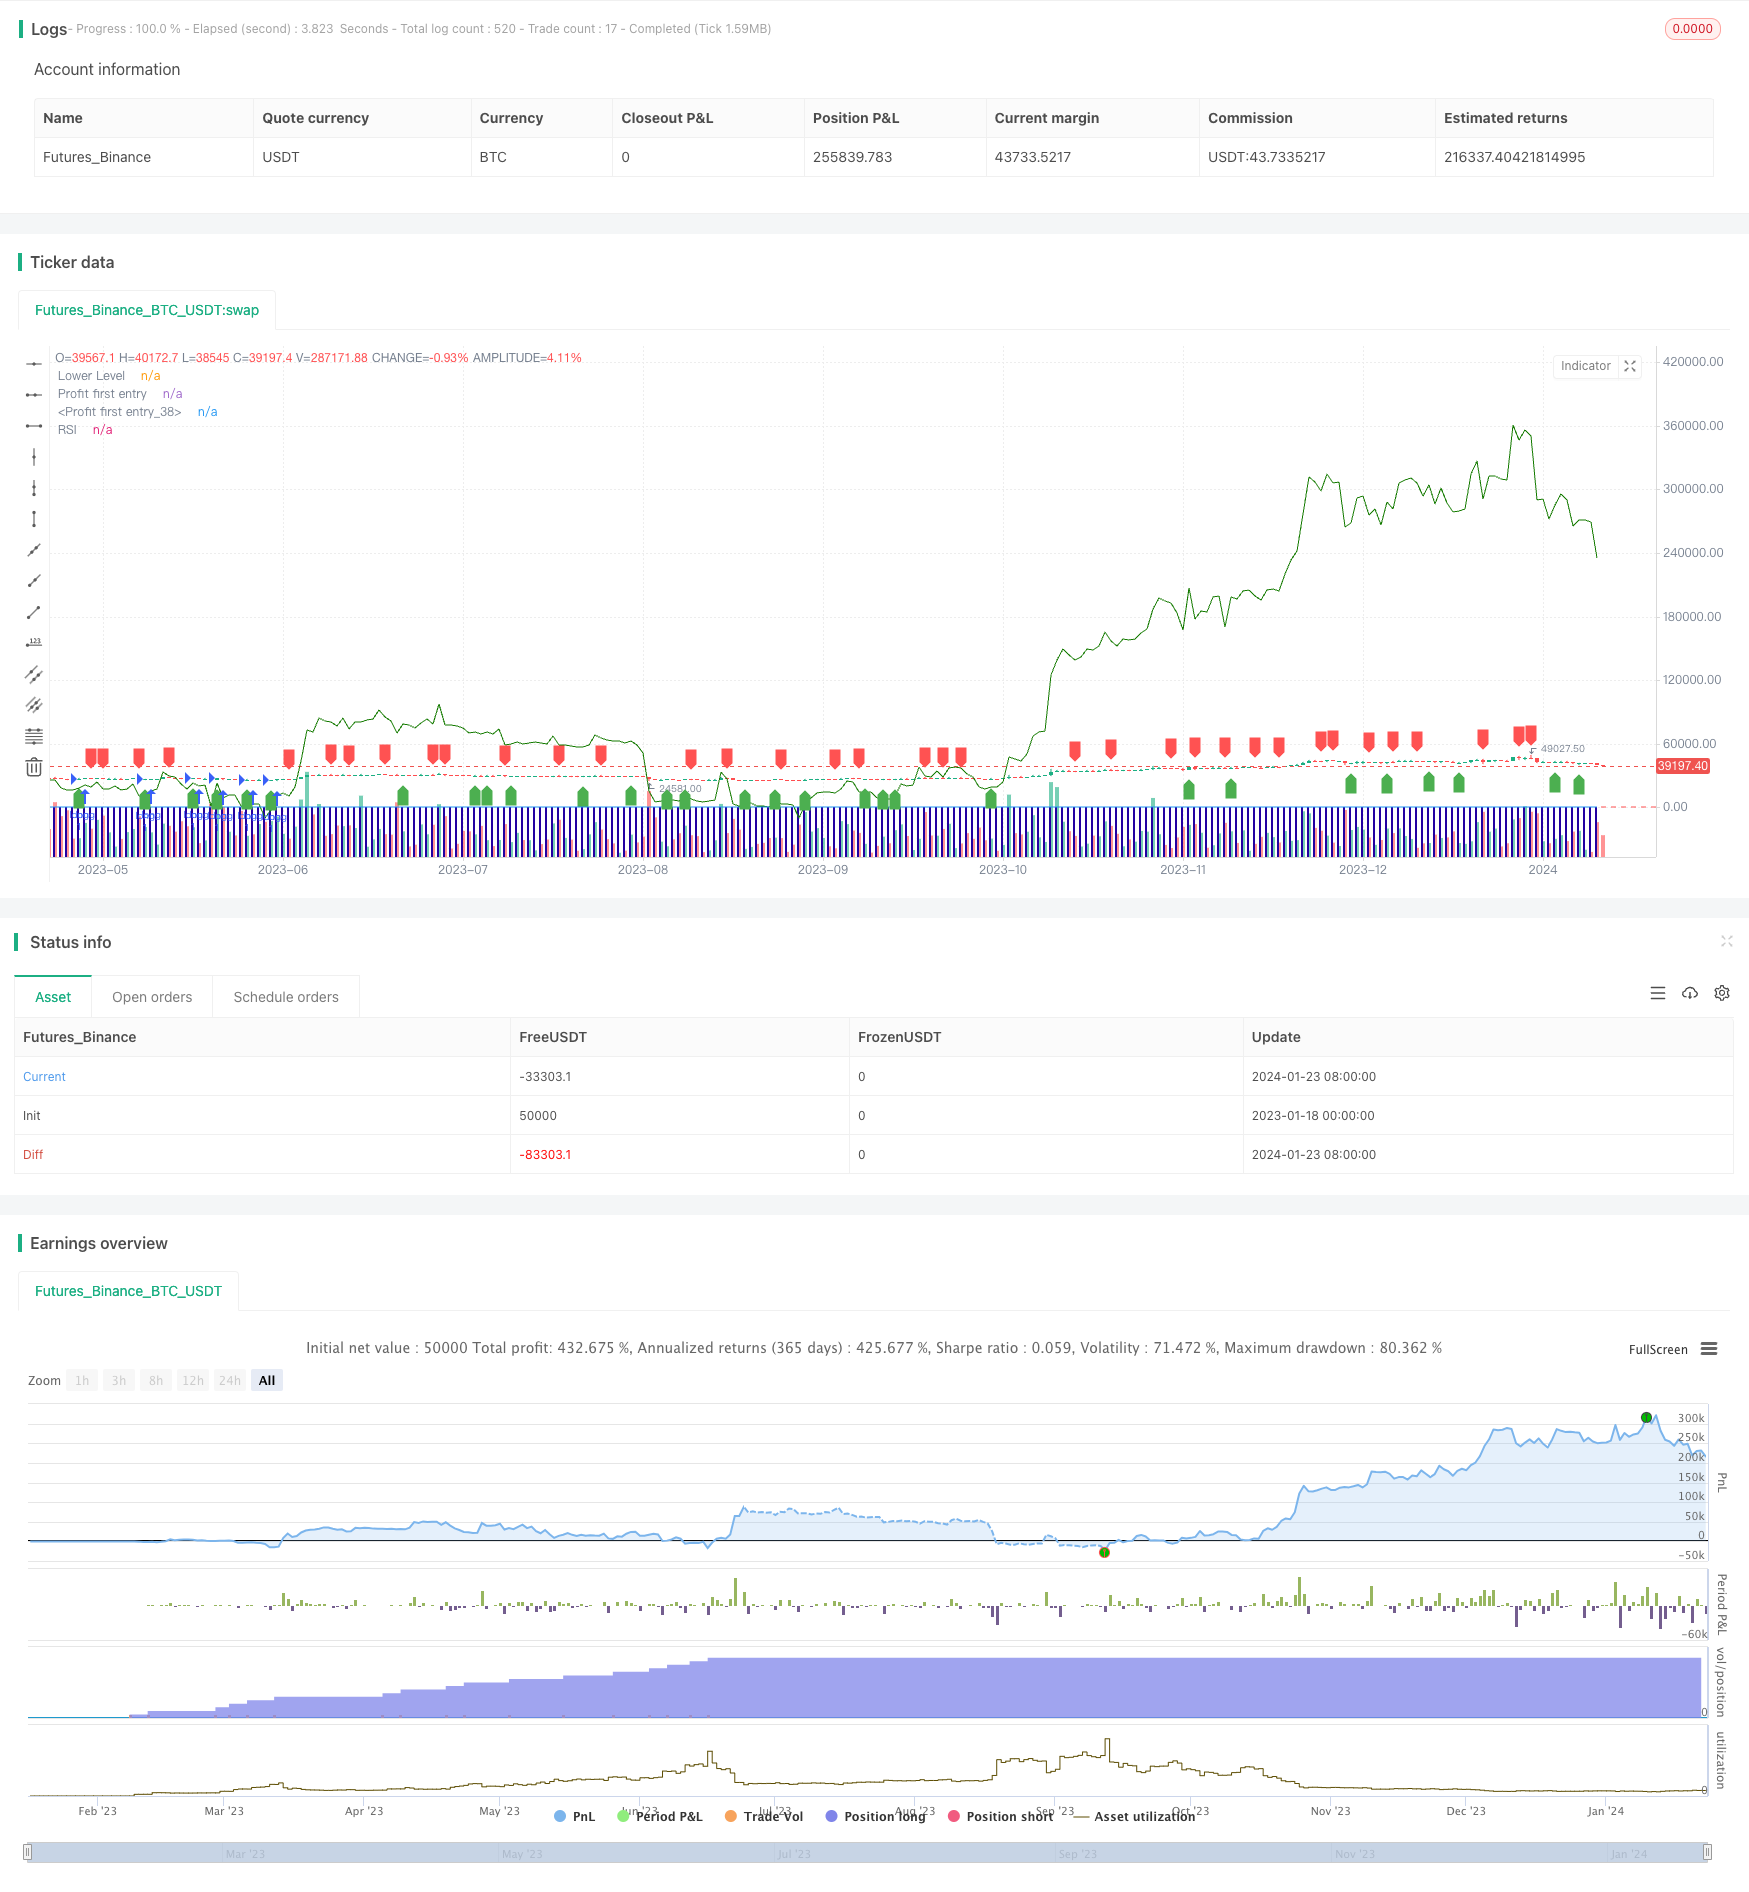
Nifty Trading Strategy Based on RSI Indicator
Author: ChaoZhang, Date: 2024-01-25 12:23:39Tags:

Overview
This strategy designs a quantitative investment strategy for trading Nifty index based on the Relative Strength Index (RSI) indicator. It identifies overbought and oversold opportunities using RSI to implement low buying and high selling for excess returns.
Strategy Principle
The strategy sets 2-period RSI as trading signals. It goes long when RSI crosses above 20, and closes position when RSI crosses below 70. This captures the short-term adjustment opportunities of the index.
The logic is: when RSI is below 20, it indicates oversold status, implying the asset is underestimated and rebound is ahead. When RSI crosses above 20, go long. When RSI is above 70, it indicates overbought status, implying the asset is overvalued and callback is ahead. When RSI crosses below 70, close position.
Advantage Analysis
As a strategy identifying short-term overbought/oversold opportunities with indicators, the main advantages are:
- The principle is simple and clear, easy to understand and validate
- Few indicator parameters, easy to optimize and adjust
- Pursuing short-term excess returns, aligns with scalping trading philosophy
- Customizable trading time period, adapts to different expectations
Risk Analysis
The main risks of this strategy includes:
- Incapable to capture long-term trends, likely to miss big moves
- Overly relying on parameter optimization, overfitting risk
- No stop loss mechanism to effectively control losses
- Frequent trading affects holding period, incurring more transaction costs
To control aforementioned risks, optimizations can be made in below aspects:
- Incorporate trend indicators to identify long-term moves
- Adopt Walk Forward Analysis to prevent overfitting
- Set stop loss points for timely stop loss
- Adjust trading parameters appropriately to control trade frequency
Optimization Directions
Main aspects for optimizing the strategy:
- Optimize RSI parameters to find optimum parameter combinations
- Add stop loss mechanism to limit maximum drawdown
- Incorporate moving averages etc. to judge long-term trend
- Add position sizing module to optimize position allocation
- Add quantitative copyright to automatically adjust parameters
Conclusion
This strategy designs a short-term trading strategy based on RSI indicator, capturing overbought/oversold signals for low buying and high selling. The strategy has simple principle and is easy to implement, but has certain degree of frequent trading, inability to identify long-term trends etc. Future improvements can be made on optimizing RSI parameters, adding stop loss, combining trend judgment etc., to make the strategy more stable and reliable.
/*backtest
start: 2023-01-18 00:00:00
end: 2024-01-24 00:00:00
period: 1d
basePeriod: 1h
exchanges: [{"eid":"Futures_Binance","currency":"BTC_USDT"}]
*/

//@version=4
strategy("RSI Strategy", overlay=true,pyramiding = 1000)
rsi_period = 2
rsi_lower = 20
rsi_upper = 70

rsi_value = rsi(close, rsi_period)
buy_signal = crossover(rsi_value, rsi_lower)
sell_signal = crossunder(rsi_value, rsi_upper)
current_date1 =  input(defval=timestamp("01 Nov 2009 00:00 +0000"), title="stary Time", group="Time Settings")

current_date =  input(defval=timestamp("01 Nov 2023 00:00 +0000"), title="End Time", group="Time Settings")
investment_amount = 100000.0
start_time = input(defval=timestamp("01 Dec 2018 00:00 +0000"), title="Start Time", group="Time Settings")
end_time = input(defval=timestamp("30 Nov 2023 00:00 +0000"), title="End Time", group="Time Settings")

in_time = time >= start_time and time <= end_time
// Variable to track accumulation.
var accumulation = 0.0
out_time = time >= end_time

if (buy_signal )
    strategy.entry("long",strategy.long,qty= 1)
    accumulation += 1
if (out_time)
    strategy.close(id="long")

plotshape(series=buy_signal, title="Buy Signal", location=location.belowbar, color=color.green, style=shape.labelup)
plotshape(series=sell_signal, title="Sell Signal", location=location.abovebar, color=color.red, style=shape.labeldown)

plot(rsi_value, title="RSI", color=color.blue)
hline(rsi_lower, title="Lower Level", color=color.red)


plot(strategy.opentrades, style=plot.style_columns,
     color=#2300a1, title="Profit first entry")
plot(strategy.openprofit, style=plot.style_line,
     color=#147a00, title="Profit first entry")
// plot(strategy.position_avg_price, style=plot.style_columns,
//      color=#ca0303, title="Profit first entry")
// log.info(strategy.position_size * strategy.position_avg_price)
- Kalman Filter Based Trend Tracking Strategy
- Seasonal Reversal Intertemporal Trading Strategy
- Dual Exponential Moving Average Crossover Algorithmic Trading Strategy
- Quantitative Trading Strategy with Multiple Factors
- Lagging Span 2 Line Tracking Trading Strategy
- EMA and MACD Based BTC Trading Strategy
- Intelligent Trailing Stop Loss Strategy
- Adaptive Volatility Breakout
- Momentum Finding Strategy
- Piercing Pin Bar Reversal Strategy
- RSI and EMA Based Trend Following Strategy
- Trend Confirmation Tracking Strategy
- The RSI Divergence Indicator Strategy
- Momentum Moving Average Consolidation Strategy
- Fast QQE Crossover Trading Strategy Based on Trend Filter
- Adaptive Moving Average Tracking Strategy
- Scalping Strategy in Trend Reversal Market
- Bidirectional EMA Cross Quant Trading Strategy
- EMA Intraday Scalping Strategy
- Compound Stop Loss and Take Profit Strategy Based on Random Entry