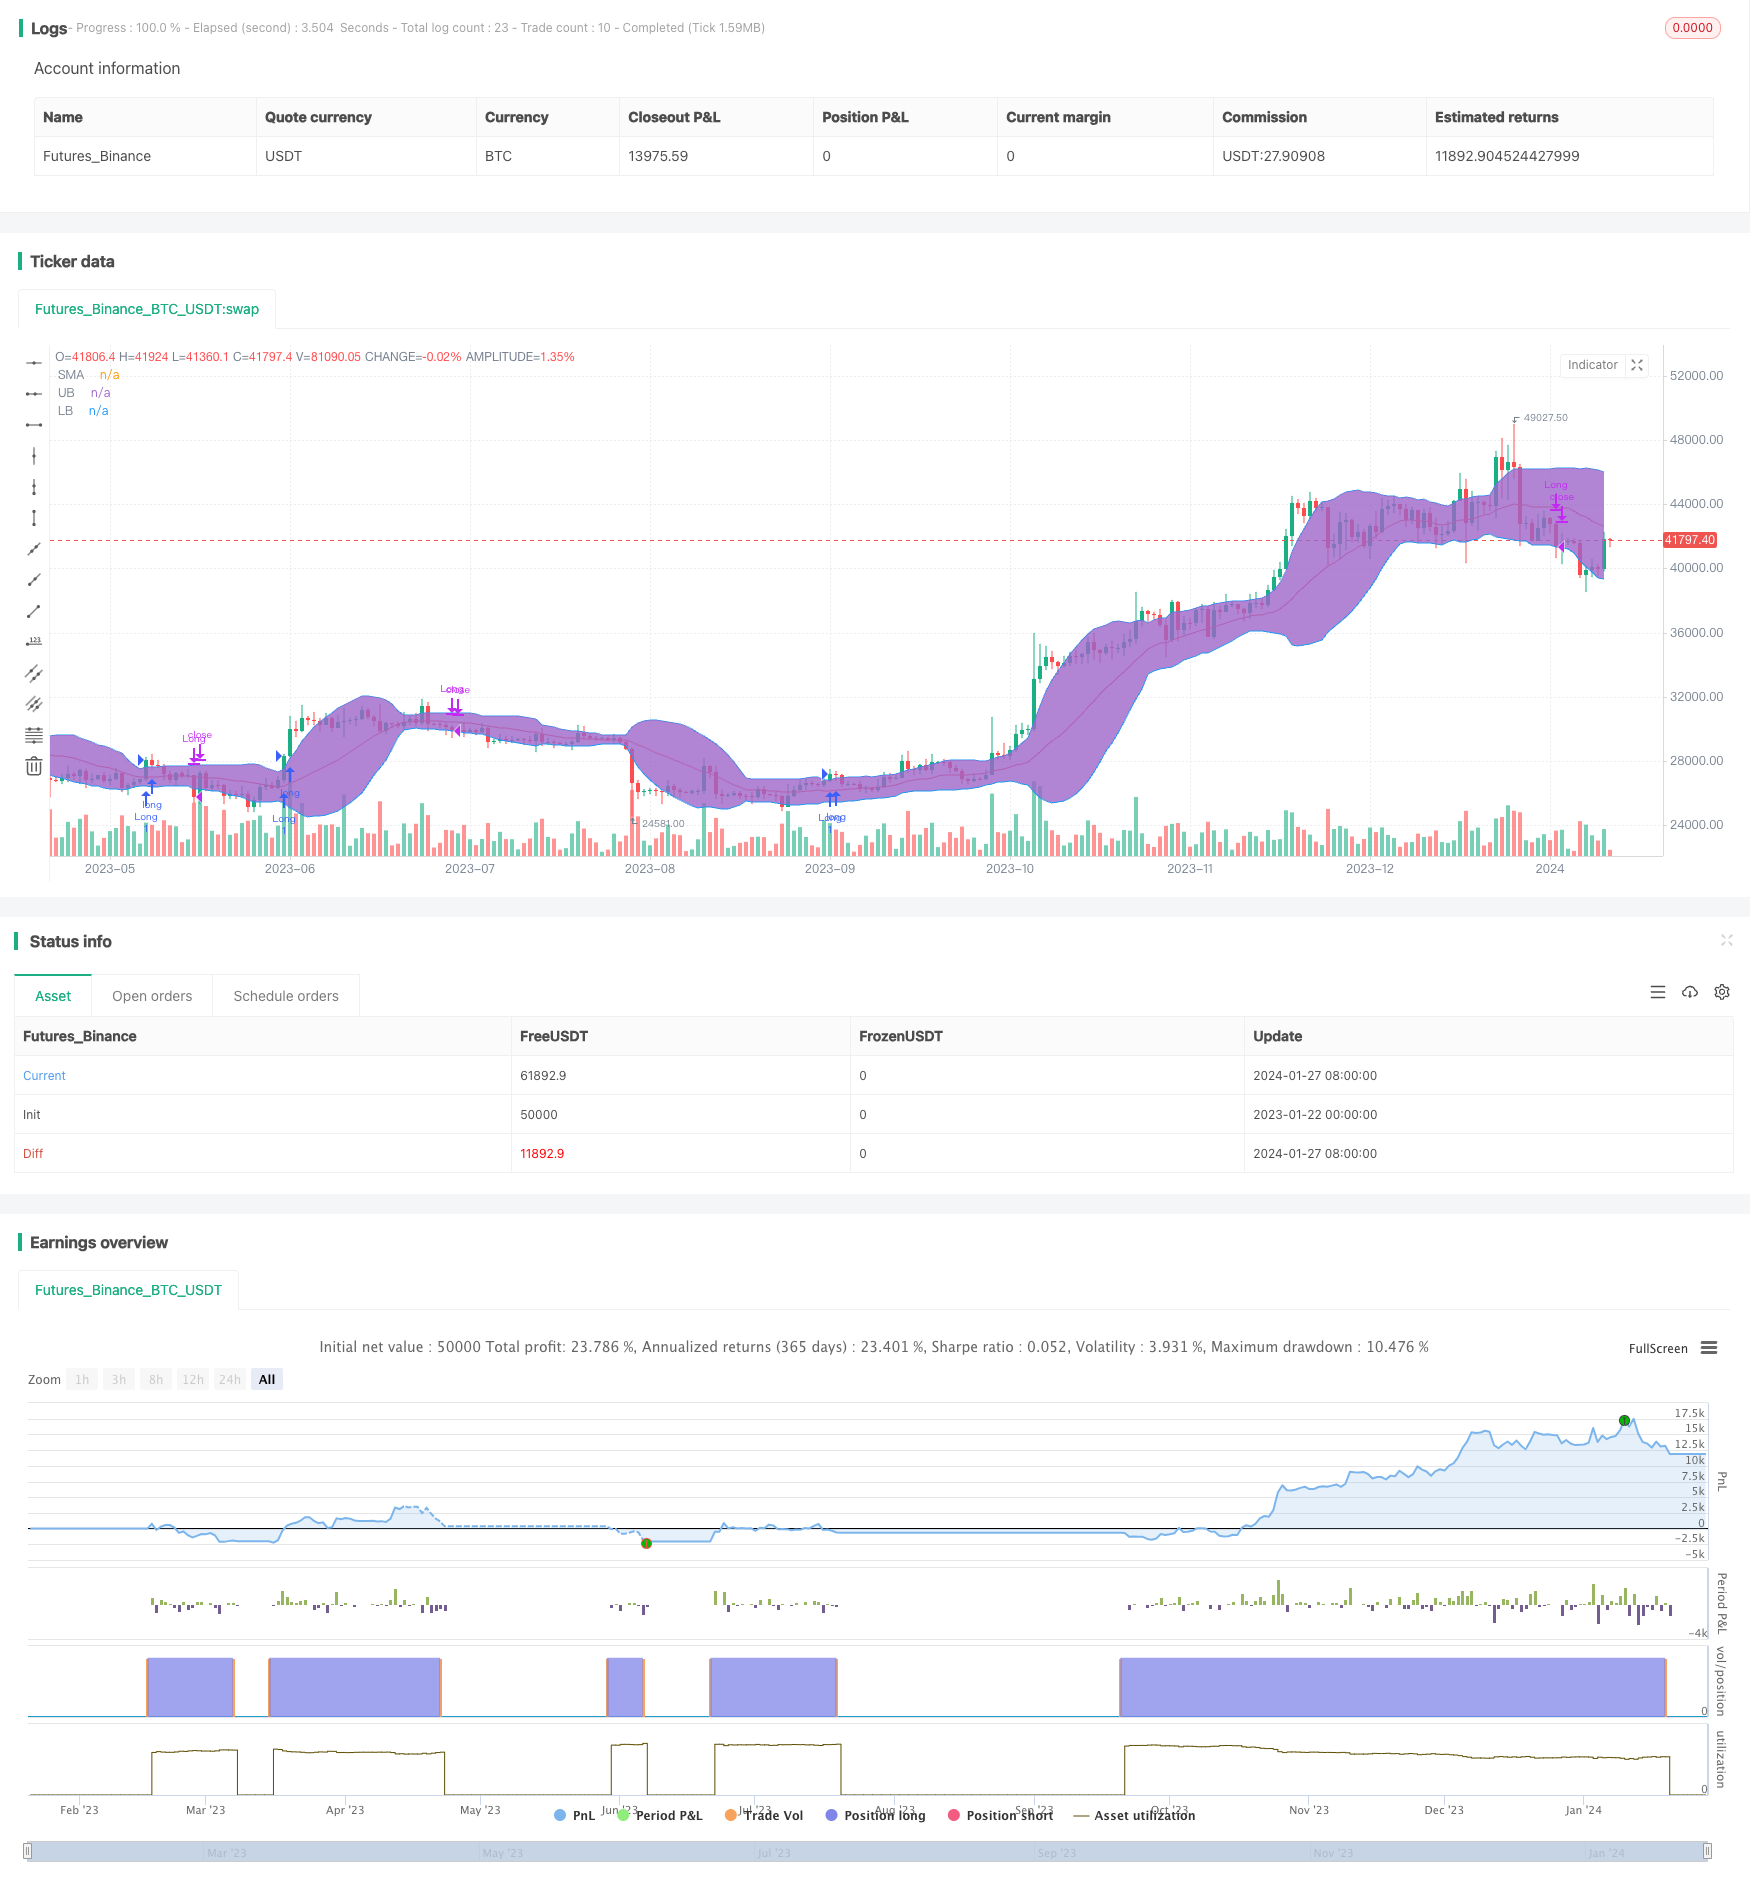
The Bollinger Band breakout strategy is a long-only momentum chasing strategy
Author: ChaoZhang, Date: 2024-01-29 11:05:29Tags:

Overview
The Bollinger Band breakout strategy is a long-only momentum chasing strategy. It uses the upper and lower bands of Bollinger Bands to judge price momentum and goes long when price breaks out above the upper band and closes position when price breaks down the lower band or moving average.
Strategy Logic
The strategy first calculates N-day moving average as the baseline, then adds and subtracts K times standard deviation above and below the baseline to construct upper and lower bands, forming Bollinger Bands. When price breaks out above the upper band, it signals an upward breakout, which is a golden cross signal. The strategy will open long position on this signal. When price breaks down the lower band or moving average, it signals a downward reversal, which is a death cross signal. The strategy will close out positions on this signal.
Since the upper and lower bands of Bollinger Bands can dynamically contain most of the distribution of price data, they represent the reasonable fluctuation range of current market prices. When price breaks through this reasonable fluctuation range, it means something unusual is happening in the market and positions need to be adjusted accordingly. This is the basic logic of the strategy.
Advantage Analysis
The strategy has the following advantages:
- Can effectively capture price trends and timely chase market momentum
- Uses Bollinger Bands to judge abnormal breakouts, avoiding false breakouts
- Clear rules easy to implement and automate
- Parameters can be optimized according to market volatility to improve strategy
Risk Analysis
The strategy also has some risks:
- Bollinger Bands may fail when extreme volatility occurs
- Cannot determine actual market trend, may buy high and sell low
- Has some time lag
- Ignores trading costs, actual performance will be discounted
To control these risks, we can incorporate trend indicators like MACD, or properly adjust parameters to narrow Bollinger Bands to reduce bad signals.
Optimization Directions
The strategy can also be optimized from the following aspects:
- Incorporate trading volume to judge true breakouts
- Use adaptive Bollinger Bands to dynamically optimize parameters
- Add stop loss mechanisms to control single loss
- Increase position management to dynamically adjust positions based on market conditions
Through the above optimizations, we can further improve the stability of the strategy and reduce trading risks.
Conclusion
In summary, the Bollinger Band breakout strategy is a rather classic trend chasing strategy. It has clear logic and easy automation. But there are still some flaws, requiring further optimizations to adapt to complex changing market environments. If combined properly with other indicators and mechanisms, the results can be greatly improved.
/*backtest
start: 2023-01-22 00:00:00
end: 2024-01-28 00:00:00
period: 1d
basePeriod: 1h
exchanges: [{"eid":"Futures_Binance","currency":"BTC_USDT"}]
*/

// This source code is subject to the terms of the Mozilla Public License 2.0 at https://mozilla.org/MPL/2.0/
// © Senthaamizh

//@version=4
strategy(title="Bollinger Band Breakout", shorttitle = "BB-BO", overlay=true)
source = close
length = input(20, minval=1, title = "Period") //Length of the Bollinger Band
mult = input(1.5, minval=0.001, maxval=50, title = "Standard Deviation") // Use 1.5 SD for 20 period MA; Use 2 SD for 10 period MA
exit = input(1, minval=1, maxval=2,title = "Exit Option") // Use Option 1 to exit using lower band; Use Option 2 to exit using moving average

basis = sma(source, length)
dev = mult * stdev(source, length)

upper = basis + dev
lower = basis - dev

if (crossover(source, upper))
    strategy.entry("Long", strategy.long, qty=1)

if(exit==1)
    if (crossunder(source, lower))
        strategy.close("Long")

if(exit==2) //basis is good for N50 but lower is good for BN (High volatility)
    if (crossunder(source, basis))
        strategy.close("Long")

plot(basis, color=color.red,title= "SMA")
p1 = plot(upper, color=color.blue,title= "UB")
p2 = plot(lower, color=color.blue,title= "LB")
fill(p1, p2)
- Moving Average Trend Tracking Strategy
- RSI Indicator Grid Trading Strategy
- PPO Price Sensitivity Momentum Double Bottom Directional Trading Strategy
- Scalping Strategy with Volume and VWAP Confirmation
- ADX, MA and EMA Long Only Trend Tracking Strategy
- Momentum Breakthrough Golden Cross Strategy
- Triple Indicator Collision Strategy
- Out-of-the-box Machine Learning Trading Strategy
- Moving Average Turning Point Crossover Trading Strategy
- Cross-Cycle Arbitrage Strategy Based on Multiple Indicators
- Flawless Victory Quantitative Trading Strategy Based on Double BB Indicators and RSI
- RSI-based Stop Loss and Take Profit Strategy
- Moving Average Channel Breakout Strategy
- Fixed Time Breakback Testing Strategy
- Time and Space Optimized Multi Timeframe MACD Strategy
- Quantitative Trading Strategy Based on Stoch RSI and MFI
- Multi-indicator Composite Trading Strategy
- Crossover EMA Short-term Trading Strategy
- Trend Following Strategy Based on Dynamic Stop Loss of Dual EMA Crossover
- Bull Market Breakout Darvas Box Buy Strategy