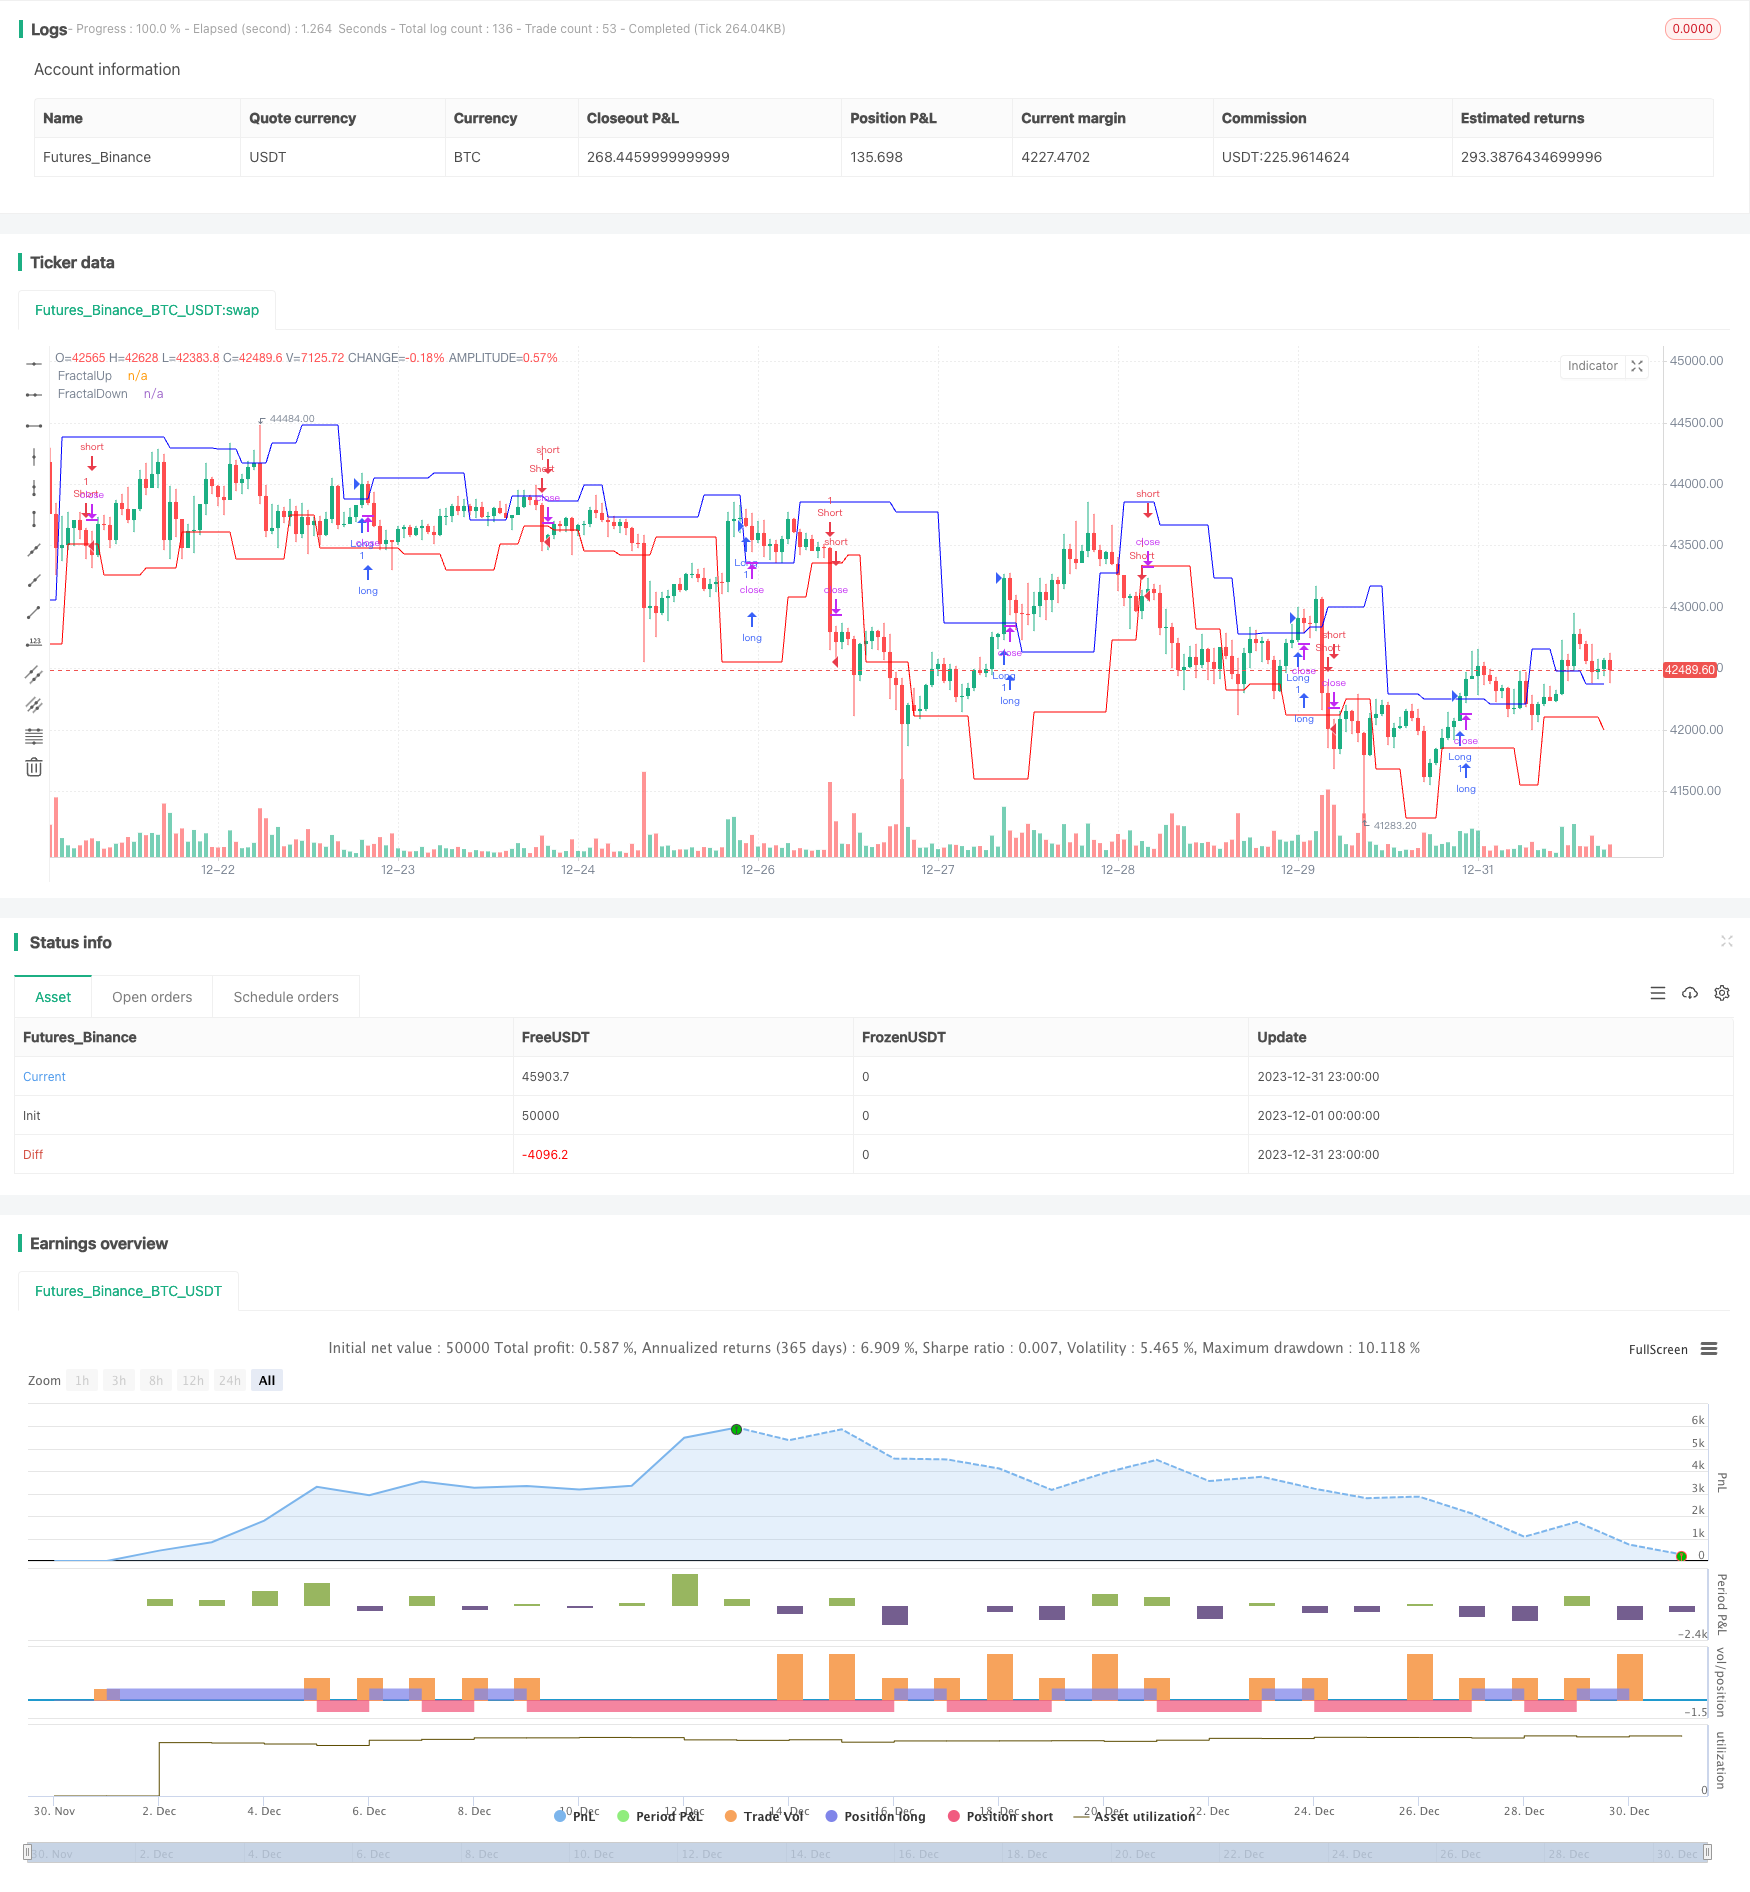
Double Fractal Breakout Strategy
Author: ChaoZhang, Date: 2024-01-30 15:53:27Tags:

Overview
The double fractal breakout strategy is a quantitative trading strategy based on technical pattern recognition. It identifies potential trend reversals by detecting double bottom and double top fractal formations, and generates buy and sell signals when prices break out of these fractals.
Strategy Logic
The core idea behind this strategy lies in fractal theory. The emergence of M-shaped or W-shaped short term turning points suggests a possible reversal of the prevailing trend. Specifically, bottom or top fractals form when 5 consecutive bars create particular high/low combinations of relative greater/lower highs/lows. For example, a top fractal forms when the highest prices of the former 2 bars are above those of the latter 3 bars.
The strategy generates long and short signals when prices break below bottom fractals and above top fractals respectively, as such breakouts indicate a higher likelihood of trend reversal.
Advantages
The main advantage of this strategy is its ability to detect potential trend reversal points, which can be very useful for trend-following trading systems. Additionally, the double fractal pattern provides more reliable trading signals compared to strategies relying solely on single bar patterns.
Risks
The major risk is that fractal detection does not guarantee price reversals with full certainty. Sometimes prices may just be making short-term corrections without real trend changes. Incorrect signals can lead to unnecessary losses in such cases. To mitigate this risk, other indicators like trading volumes can be used to verify the validity of reversal signals.
Enhancement
Possible ways to enhance this strategy include:
Adding filters like volume to avoid false reversals.
Tuning parameters to detect larger-degree double fractals and capture big trend turns.
Incorporating moving stop loss to reduce losses from bad trades.
Conclusion
The double fractal breakout strategy identifies potential price reversals by detecting specific technical patterns. As a technical indicator-driven approach, it can effectively track short and medium-term trends in the market and provide respectable risk-reward outcomes. It is a reliable and practical trading system overall.
/*backtest
start: 2023-12-01 00:00:00
end: 2023-12-31 23:59:59
period: 1h
basePeriod: 15m
exchanges: [{"eid":"Futures_Binance","currency":"BTC_USDT"}]
*/

//@version=4
// This source code is subject to the terms of the Mozilla Public License 2.0 at https://mozilla.org/MPL/2.0/
// © ceyhun

strategy("Fractal Breakout Strategy", overlay=true)

FUp = high[4] < high[2] and high[3] < high[2] and high[1] < high[2] and high < high[2] or
   high[5] < high[2] and high[4] < high[2] and high[3] <= high[2] and
   high[1] < high[2] and high < high[2] or
   high[6] < high[2] and high[5] < high[2] and high[4] <= high[2] and
   high[3] <= high[2] and high[1] < high[2] and high < high[2] or
   high[7] < high[2] and high[6] < high[2] and high[5] <= high[2] and
   high[4] <= high[2] and high[3] <= high[2] and high[1] < high[2] and
   high < high[2] or
   high[8] < high[2] and high[7] < high[2] and high[6] <= high[2] and
   high[5] <= high[2] and high[4] <= high[2] and high[3] <= high[2] and
   high[1] < high[2] and high < high[2]
FractalUp = valuewhen(FUp, high[2], 1)
plot(FractalUp, color=#0000FF,title="FractalUp")

FDown = low[4] > low[2] and low[3] > low[2] and low[1] > low[2] and low > low[2] or
   low[5] > low[2] and low[4] > low[2] and low[3] >= low[2] and low[1] > low[2] and
   low > low[2] or
   low[6] > low[2] and low[5] > low[2] and low[4] >= low[2] and low[3] >= low[2] and
   low[1] > low[2] and low > low[2] or
   low[7] > low[2] and low[6] > low[2] and low[5] >= low[2] and low[4] >= low[2] and
   low[3] >= low[2] and low[1] > low[2] and low > low[2] or
   low[8] > low[2] and low[7] > low[2] and low[6] >= low[2] and low[5] >= low[2] and
   low[4] >= low[2] and low[3] >= low[2] and low[1] > low[2] and low > low[2]
FractalDown = valuewhen(FDown, low[2], 1)
plot(FractalDown, color=#FF0000,title="FractalDown")

if crossover(close, FractalUp)
    strategy.entry("Long", strategy.long, comment="Long")

if crossunder(close, FractalDown)
    strategy.entry("Short", strategy.short, comment="Short")
- Dual-directional ADX Trading Strategy
- Vix Fix Linear Regression Bottom Fishing Strategy
- Three Exponential Moving Averages and Stochastic Relative Strength Index Trading Strategy
- Double 7 Days Breakout Strategy
- Dual MACD Quantitative Trading Strategy
- Bollinger Band Moving Average Crossover Strategy
- Scalping Dips in Bull Market Strategy
- Trend Following Strategy Based on Adaptive Moving Average
- True Relative Movement Moving Average Strategy
- MACD and RSI Based 5-Minute Momentum Trading Strategy
- Noro Shifted Moving Average Stop Loss Strategy
- Double Exponential Moving Average RSI Trading Strategy
- Simple Moving Average Crossover Strategy
- Scalping Strategy Based on Market Liquidity and Trend
- Cross-Border Short-Term Breakthrough Reversal 5EMA Strategy
- RSI Indicator Based Stock Trading Pyramiding Strategy
- All about EMA Channel Trading Strategy
- Double Decker RSI Trading Strategy
- Bollinger Bands and RSI Combination Strategy
- Double Inside Bar & Trend Strategy