概述
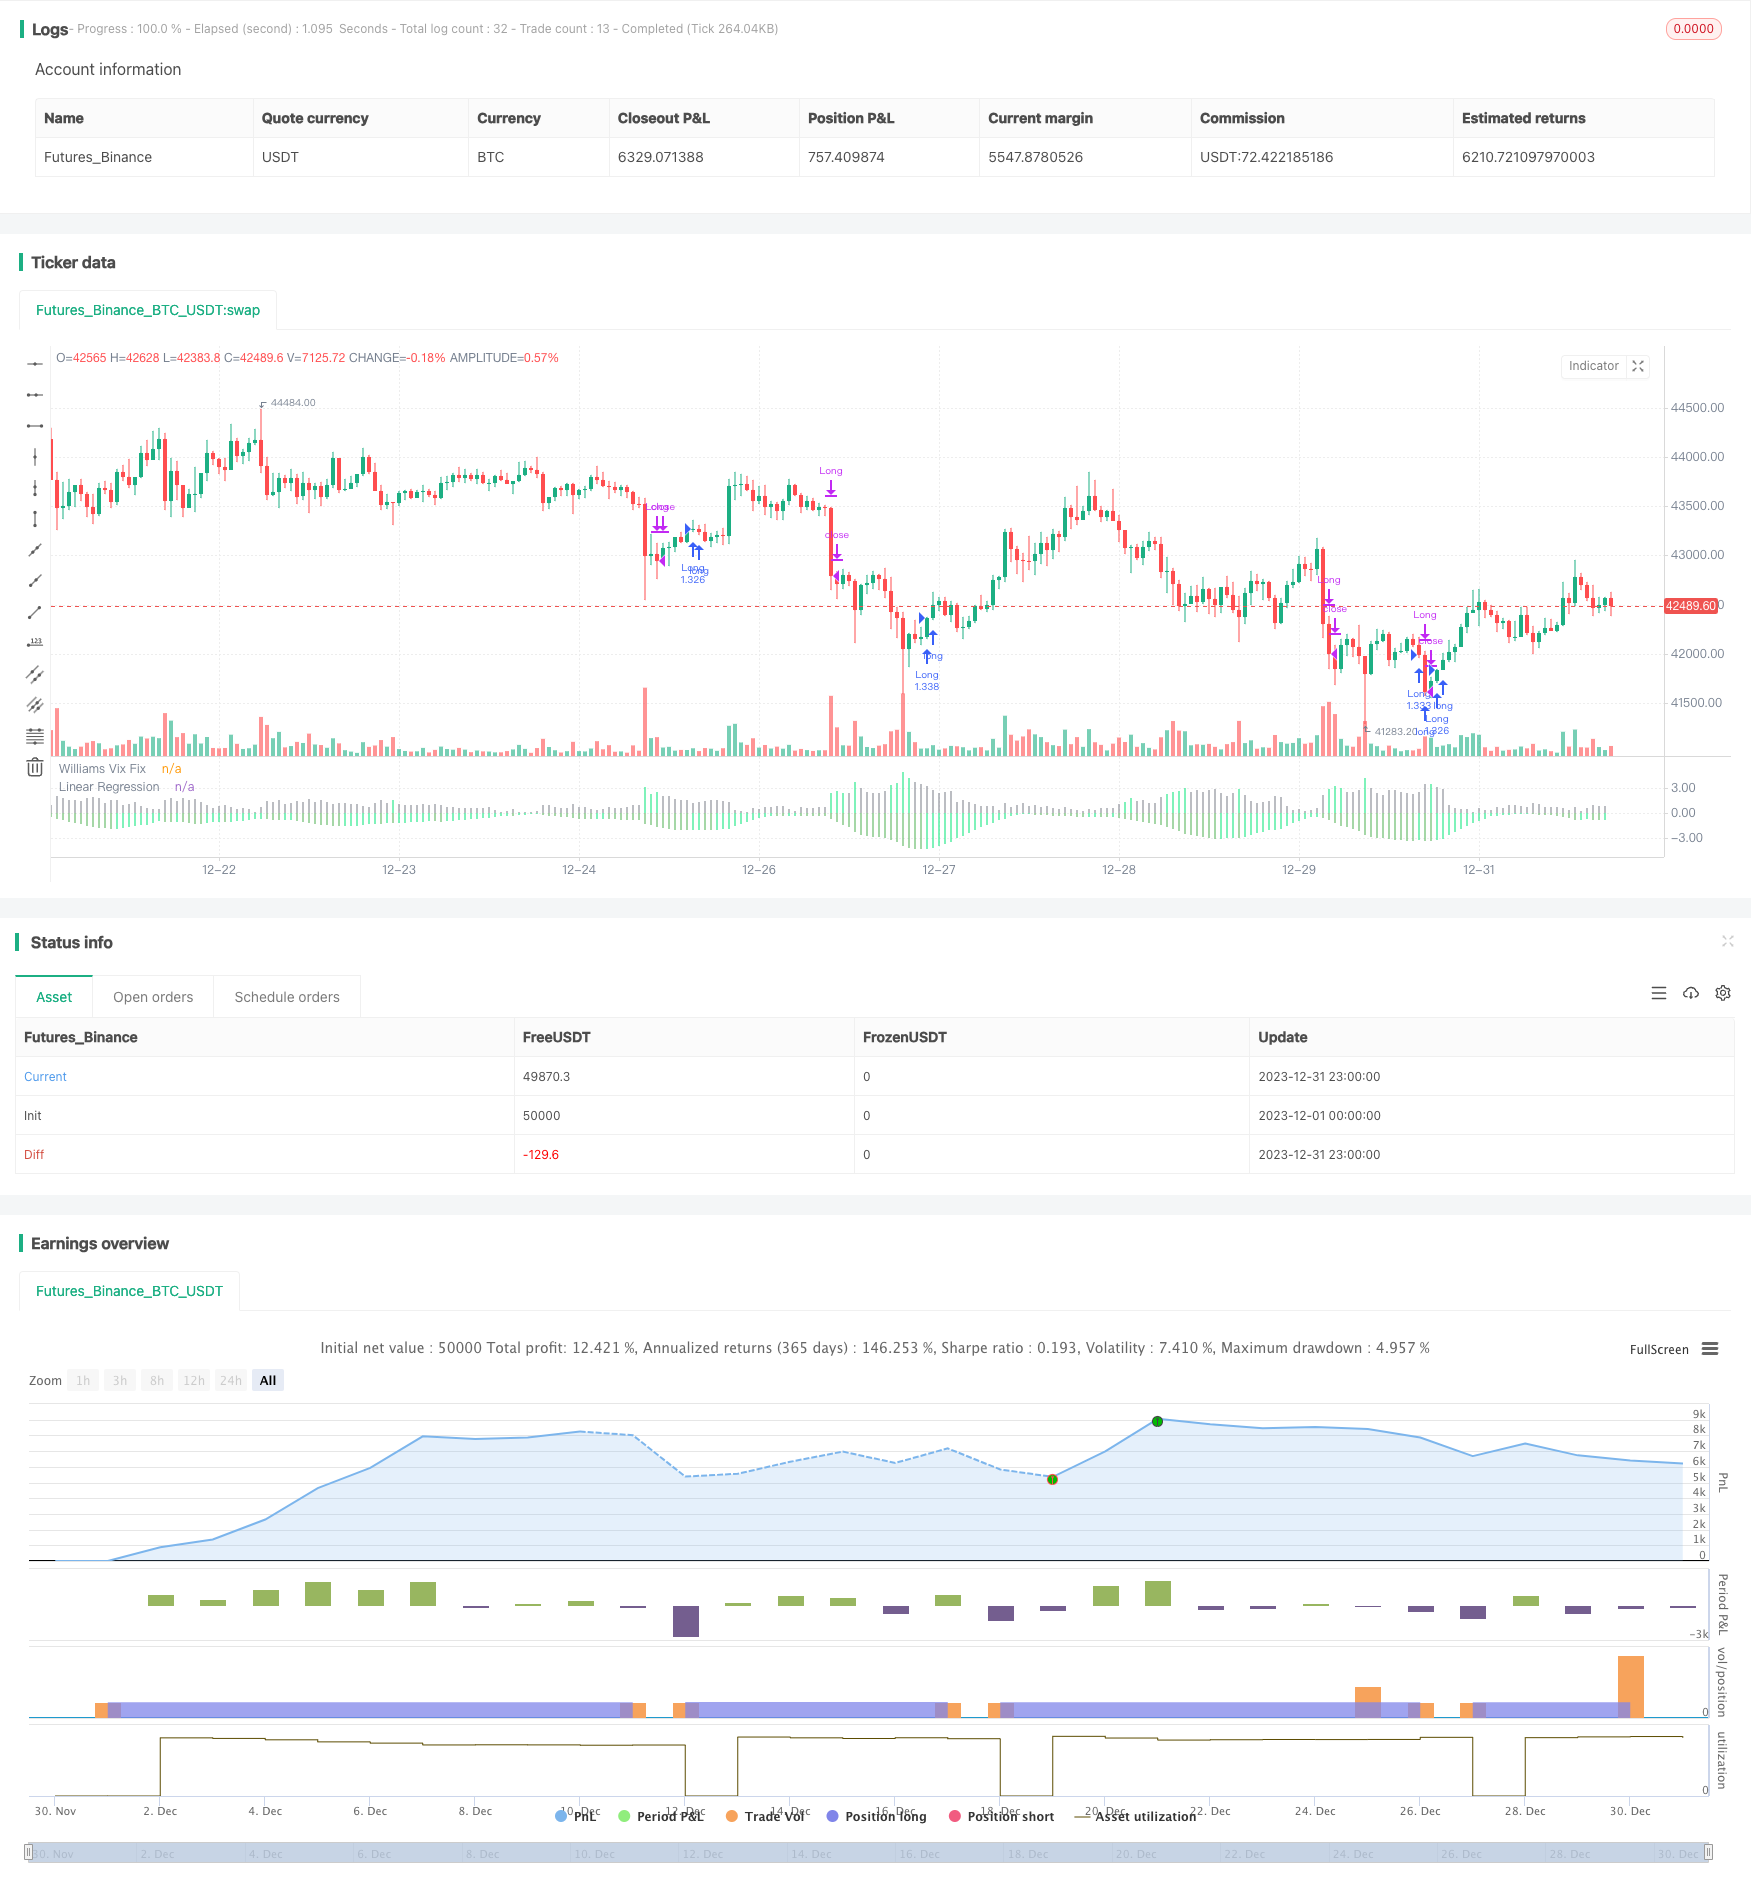
该策略的核心思想是结合Vix修复指标和其线性回归,精确捕捉市场的低点。策略名为“修复线性回归低点策略”。
策略原理
- 计算Vix修复指标,它能较好地判断市场低点
- 对Vix修复指标应用线性回归。当线性回归 histogram颜色转绿时,表明Vix修复线性回归开始上升,可以发出买入信号
- 结合Vix修复指标绿色柱子,可以进一步确认买入时机
- 当线性回归histogram颜色转红时,表明Vix修复线性回归开始下降,发出卖出信号
以上流程,利用线性回归提高Vix修复指标信号的准确性和及时性,过滤掉部分假信号,从而精确捕捉低点。
优势分析
- 策略利用线性回归过滤Vix修复指标的部分假信号,使买入/卖出信号更加准确可靠
- 线性回归提高了信号的灵敏度和及时性,能够快速捕捉市场转折点
- 策略逻辑简单清晰,容易理解实现,适合量化交易
- 可配置参数较多,可以灵活调整,适应市场的变化
风险及解决
- 该策略主要用于判断市场整体低点,不适合个股
- 线性回归并不能完全过滤假信号,结合Vix修复指标可以降低风险
- 需要适当调整参数,适应行情的变化,避免失效
- 建议与其他指标结合使用,进一步确认信号
优化方向
- 可以考虑与波动率指标或者量能指标结合,进一步过滤信号
- 可以研究参数自适应优化方法,使策略更加智能化
- 可以探索机器学习方法,用更复杂的模型预测Vix修复走势
- 可以尝试在个股上运用类似方法,研究如何过滤假信号
总结
该策略利用Vix修复指标判断低点的同时,引入线性回归提高信号质量,从而实现对市场低点的有效捕捉。策略简单实用,结果较为理想,主要风险在假信号未能完全过滤。我们仍需优化参数设置,并考虑引入其他手段进一步确认信号,使策略更加完善。总体来说,该策略为判断市场低点提供了新的有效途径,值得进一步研究。
策略源码
/*backtest
start: 2023-12-01 00:00:00
end: 2023-12-31 23:59:59
period: 1h
basePeriod: 15m
exchanges: [{"eid":"Futures_Binance","currency":"BTC_USDT"}]
*/

// This source code is subject to the terms of the Mozilla Public License 2.0 at https://mozilla.org/MPL/2.0/
// © HeWhoMustNotBeNamed

//@version=4
strategy("VixFixLinReg-Strategy", shorttitle="VixFixLinReg - Strategy",
                     overlay=false, initial_capital = 100000,
                     default_qty_type = strategy.percent_of_equity, default_qty_value = 100, commission_type = strategy.commission.percent, pyramiding = 1,
                     commission_value = 0.01)
pd = input(22, title="LookBack Period Standard Deviation High")
bbl = input(20, title="Bolinger Band Length")
mult = input(2.0    , minval=1, maxval=5, title="Bollinger Band Standard Devaition Up")
lb = input(50  , title="Look Back Period Percentile High")
ph = input(.85, title="Highest Percentile - 0.90=90%, 0.95=95%, 0.99=99%")
pl = input(1.01, title="Lowest Percentile - 1.10=90%, 1.05=95%, 1.01=99%")
hp = input(false, title="Show High Range - Based on Percentile and LookBack Period?")
sd = input(false, title="Show Standard Deviation Line?")
i_startTime = input(defval = timestamp("01 Jan 2010 00:00 +0000"), title = "Start Time", type = input.time)
i_endTime = input(defval = timestamp("01 Jan 2099 00:00 +0000"), title = "End Time", type = input.time)
inDateRange = true
considerVIXFixClose = input(false)
lengthKC=input(20, title="KC Length")
multKC = input(1.5, title="KC MultFactor")

atrLen = input(22)
atrMult = input(5)
initialStopBar = input(5)
waitForCloseBeforeStop = input(true)
f_getStop(atrLen, atrMult)=>
    stop = strategy.position_size > 0 ? close - (atrMult * atr(atrLen)) : lowest(initialStopBar)
    stop := strategy.position_size > 0 ? max(stop,nz(stop[1], stop)) : lowest(initialStopBar)
    stop

wvf = ((highest(close, pd)-low)/(highest(close, pd)))*100

sDev = mult * stdev(wvf, bbl)
midLine = sma(wvf, bbl)
lowerBand = midLine - sDev
upperBand = midLine + sDev

rangeHigh = (highest(wvf, lb)) * ph
rangeLow = (lowest(wvf, lb)) * pl


col = wvf >= upperBand or wvf >= rangeHigh ? color.lime : color.gray

val = linreg(wvf, pd, 0)
absVal = abs(val)

linRegColor = val>val[1]? (val > 0 ? color.green : color.orange): (val > 0 ? color.lime : color.red)
plot(hp and rangeHigh ? rangeHigh : na, title="Range High Percentile", style=plot.style_line, linewidth=4, color=color.orange)
plot(hp and rangeLow ? rangeLow : na, title="Range High Percentile", style=plot.style_line, linewidth=4, color=color.orange)
plot(wvf, title="Williams Vix Fix", style=plot.style_histogram, linewidth = 4, color=col)
plot(sd and upperBand ? upperBand : na, title="Upper Band", style=plot.style_line, linewidth = 3, color=color.aqua)

plot(-absVal, title="Linear Regression", style=plot.style_histogram, linewidth=4, color=linRegColor)

vixFixState = (col == color.lime) ? 1: 0
vixFixState := strategy.position_size == 0? max(vixFixState, nz(vixFixState[1],0)) : vixFixState

longCondition = (vixFixState == 1 and linRegColor == color.lime) and inDateRange
exitLongCondition = (linRegColor == color.orange or linRegColor == color.red) and considerVIXFixClose

stop = f_getStop(atrLen, atrMult)
label_x = time+(60*60*24*1000*20)
myLabel = label.new(x=label_x, y=0, text="Stop : "+tostring(stop), xloc=xloc.bar_time, style=label.style_none, textcolor=color.black, size=size.normal)
label.delete(myLabel[1])
strategy.entry("Long", strategy.long, when=longCondition, oca_name="oca_buy")
strategy.close("Long", when=exitLongCondition or (close < stop and waitForCloseBeforeStop and linRegColor == color.green))
strategy.exit("ExitLong", "Long", stop = stop, when=not waitForCloseBeforeStop and linRegColor == color.green)