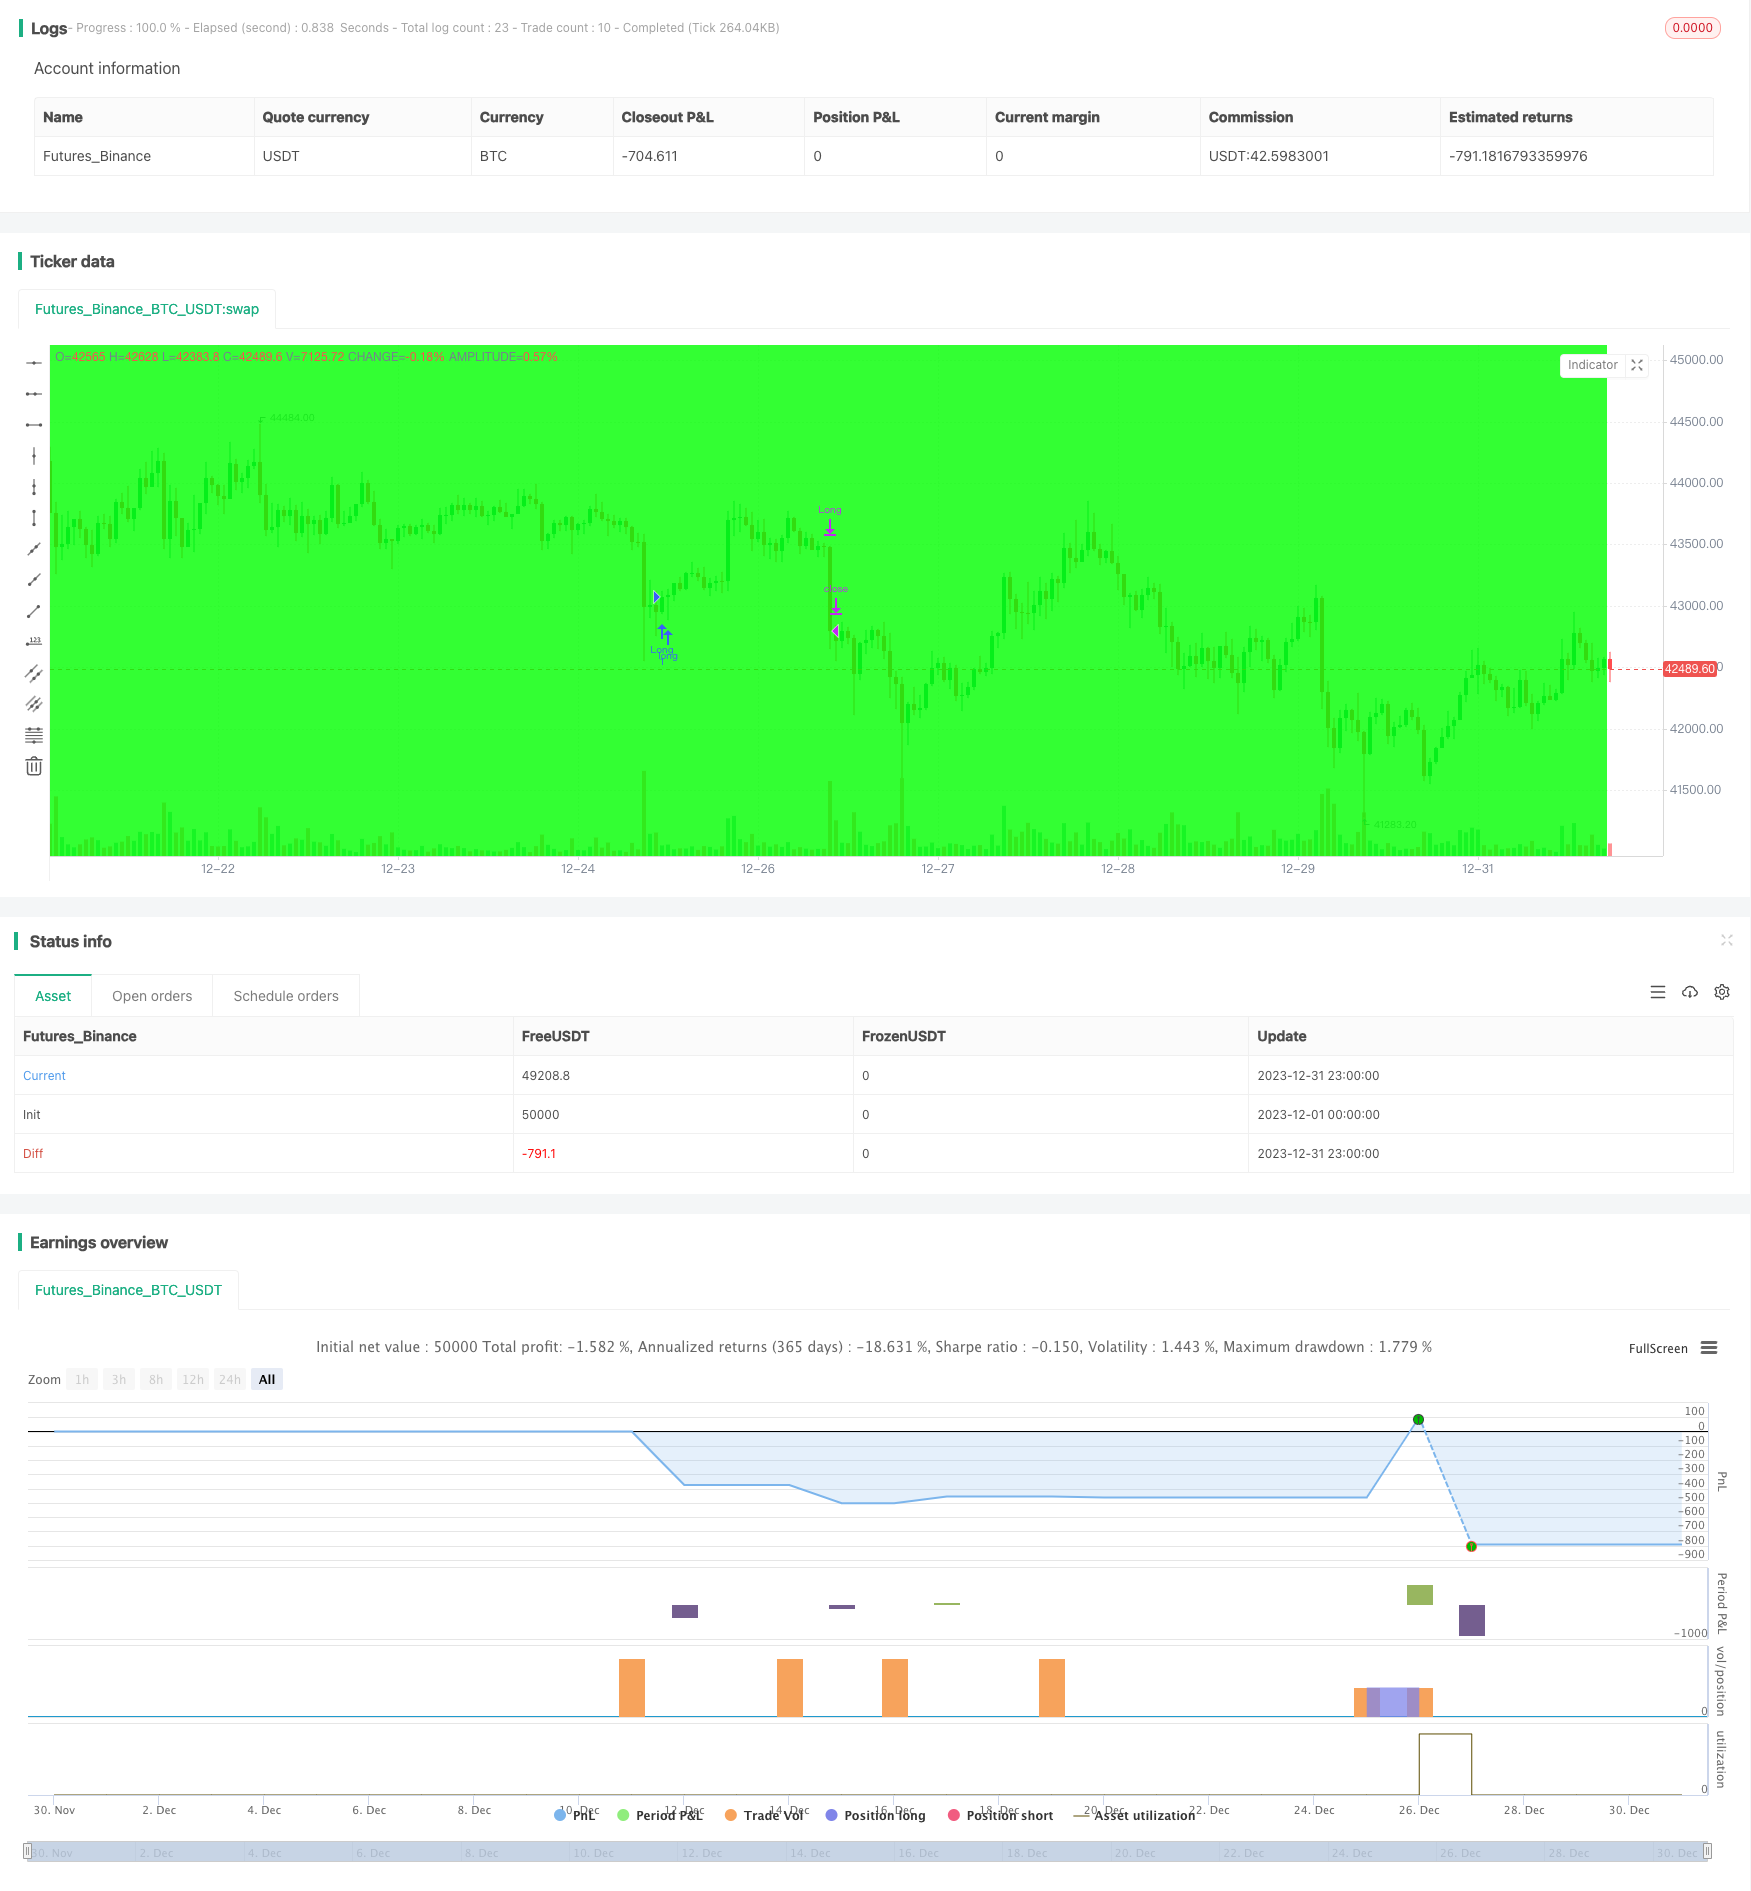
Overview
This strategy identifies overbought and oversold market conditions using the RSI indicator to go short on bearish crossovers in overbought zones and go long on bullish crossovers in oversold zones. It is a reversal trading strategy based on indicators. The strategy incorporates trend trailing stops and fixed take profit/stop loss to effectively control trading risk.
Strategy Logic
The trading signals of this strategy are generated based on bullish/bearish crossovers of the RSI indicator. The RSI indicator typically uses 30 as the oversold line and 70 as the overbought line. When the RSI line crosses above the oversold line, a buy signal is generated. When the RSI line crosses below the overbought line, a sell signal is generated. Based on this logic, the strategy identifies overbought and oversold zones and generates corresponding long/short signals.
After entering a position, the strategy uses percentage trailing stops by continuously updating the highest/lowest price reached and trailing a fixed percentage away from that as the stop loss. There are also fixed take profit and stop loss levels, closing the position when the target profit is reached or max loss is exceeded. This combination can effectively control trade risk.
Advantage Analysis
The advantages of this strategy include:
Using RSI to identify overbought/oversold levels is a mature trading technique for reliably capturing market turning points.
Using bullish/bearish crossovers filters out some false signals and makes trading more reliable.
Trend trailing stops lock in profits as much as possible, while also having quick stop outs to contain loss per trade.
Fixed TP/SL levels also control per trade risk effectively.
Overall simple and clear logic, easy to understand and implement, suitable for beginners.
Risk Analysis
The risks of this strategy include:
RSI signals can be false, with high chance of pattern failure, leading to stop loss trigger.
Fixed TP/SL cannot adapt to market volatility, may cut profits short or let losses run.
Percentage trailing only follows highest/lowest price, may be too aggressive leaving profits behind.
Overfitting risk as parameters could be optimized just for historical data.
High trade frequency increasing transaction costs and slippage.
Optimization Directions
Possible ways to improve the strategy:
Optimize RSI parameters for best results.
Add filter indicators for higher signal accuracy.
Adaptive stops/profits based on market volatility.
Limit trade frequency to reduce transaction costs.
Add position sizing to limit loss per trade.
Backtest over longer timeframe to test stability.
Conclusion
In summary this is a typical reversal strategy using RSI to identify overbought/oversold, with bull/bear crossovers as signals. Trend trailing stops and fixed TP/SL manage risk. The logic is simple and easy to implement, suitable for beginners. But risks like false signals and curve fitting need to be addressed through further verification and optimization before live trading.
/*backtest
start: 2023-12-01 00:00:00
end: 2023-12-31 23:59:59
period: 1h
basePeriod: 15m
exchanges: [{"eid":"Futures_Binance","currency":"BTC_USDT"}]
*/

// LOVE JOY PEACE PATIENCE KINDNESS GOODNESS FAITHFULNESS GENTLENESS SELF-CONTROL
// This source code is subject to the terms of the Mozilla Public License 2.0 at https://mozilla.org/MPL/2.0/
// Author: © JoshuaMcGowan
// Taken from https://www.tradingview.com/script/GbZGYi6l-Adding-some-essential-components-to-a-prebuilt-RSI-strategy/
// Just updated to compile in version 4.

//@version=4

strategy("Adding some essential components to a prebuilt RSI strategy", overlay=true)

/////////////// Component Code Start ///////////////

testStartYear = input(2011, "Backtest Start Year")
testStartMonth = input(8, "Backtest Start Month")
testStartDay = input(1, "Backtest Start Day")
testPeriodStart = timestamp(testStartYear,testStartMonth,testStartDay,0,0)

testStopYear = input(2100, "Backtest Stop Year")
testStopMonth = input(9, "Backtest Stop Month")
testStopDay = input(29, "Backtest Stop Day")
// testStopDay = testStartDay + 1
testPeriodStop = timestamp(testStopYear,testStopMonth,testStopDay,0,0)

// A switch to control background coloring of the test period
testPeriodBackground = input(title="Color Background?", type=input.bool, defval=true)
testPeriodBackgroundColor = testPeriodBackground and (time >= testPeriodStart) and (time <= testPeriodStop) ? #00FF00 : na
bgcolor(testPeriodBackgroundColor, transp=97)

testPeriod() => true

/////////////// Component Code Stop ///////////////

// Replace RSI Component, Long/Short, and Long Signal/Short Signal conditions with your trade setup components.
///////////// RSI component /////////////

length = input( 14 )
overSold = input( 30 )
overBought = input( 70 )
price = close

vrsi = rsi(price, length)
notna = not na(vrsi)

/////////////// STRATEGY ///////////////

ts = input(99999, "Trailing Stop") / 100
tp = input(99999, "Take Profit") / 100
sl = input(99999, "Stop Loss") / 100

// Update this with your setup.
long = notna and crossover(vrsi, overSold)
short = notna and crossunder(vrsi, overBought)

last_long = 0
last_short = 0
last_long := long ? time : nz(last_long[1])
last_short := short ? time : nz(last_short[1])

// Update this to reflect your setup.
long_signal = crossover(last_long, last_short)
short_signal = crossover(last_short, last_long)

float last_open_long_signal = 0
float last_open_short_signal = 0
last_open_long_signal := long_signal ? open : nz(last_open_long_signal[1])
last_open_short_signal := short_signal ? open : nz(last_open_short_signal[1])

last_long_signal = 0
last_short_signal = 0
last_long_signal := long_signal ? time : nz(last_long_signal[1])
last_short_signal := short_signal ? time : nz(last_short_signal[1])

in_long_signal = last_long_signal > last_short_signal
in_short_signal = last_short_signal > last_long_signal

float last_high = 0
float last_low = 0
last_high := not in_long_signal ? na : in_long_signal and (na(last_high[1]) or high > nz(last_high[1])) ? high : nz(last_high[1])
last_low := not in_short_signal ? na : in_short_signal and (na(last_low[1]) or low < nz(last_low[1])) ? low : nz(last_low[1])

long_ts = not na(last_high) and high <= (last_high - ts) //and high >= last_open_long_signal
short_ts = not na(last_low) and low >= (last_low + ts) //and low <= last_open_short_signal

long_tp = high >= (last_open_long_signal + tp)
short_tp = low <= (last_open_short_signal - tp)

long_sl = low <= (last_open_long_signal - sl)
short_sl = high >= (last_open_short_signal + sl)

leverage = input(200, "Leverage")
long_call = last_open_long_signal - (0.8 + 0.2 * (1/leverage)) / leverage * last_open_long_signal
short_call = last_open_short_signal + (0.78 + 0.2 * (1/leverage)) / leverage * last_open_short_signal
long_call_signal = low <= long_call
short_call_signal = high >= short_call

if testPeriod()
    strategy.entry("Long", strategy.long, when=long_signal)
    strategy.entry("Short", strategy.short, when=short_signal)

    // plot(long_call, color=color.red)
    // plot(short_call, color=color.green)
    strategy.close("Long", when=long_call_signal)
    strategy.close("Short", when=short_call_signal)
    strategy.close("Long", when=long_tp)
    strategy.close("Short", when=short_tp)
    strategy.close("Long", when=long_sl)
    strategy.close("Short", when=short_sl)
    strategy.close("Long", when=long_ts)
    strategy.close("Short", when=short_ts)