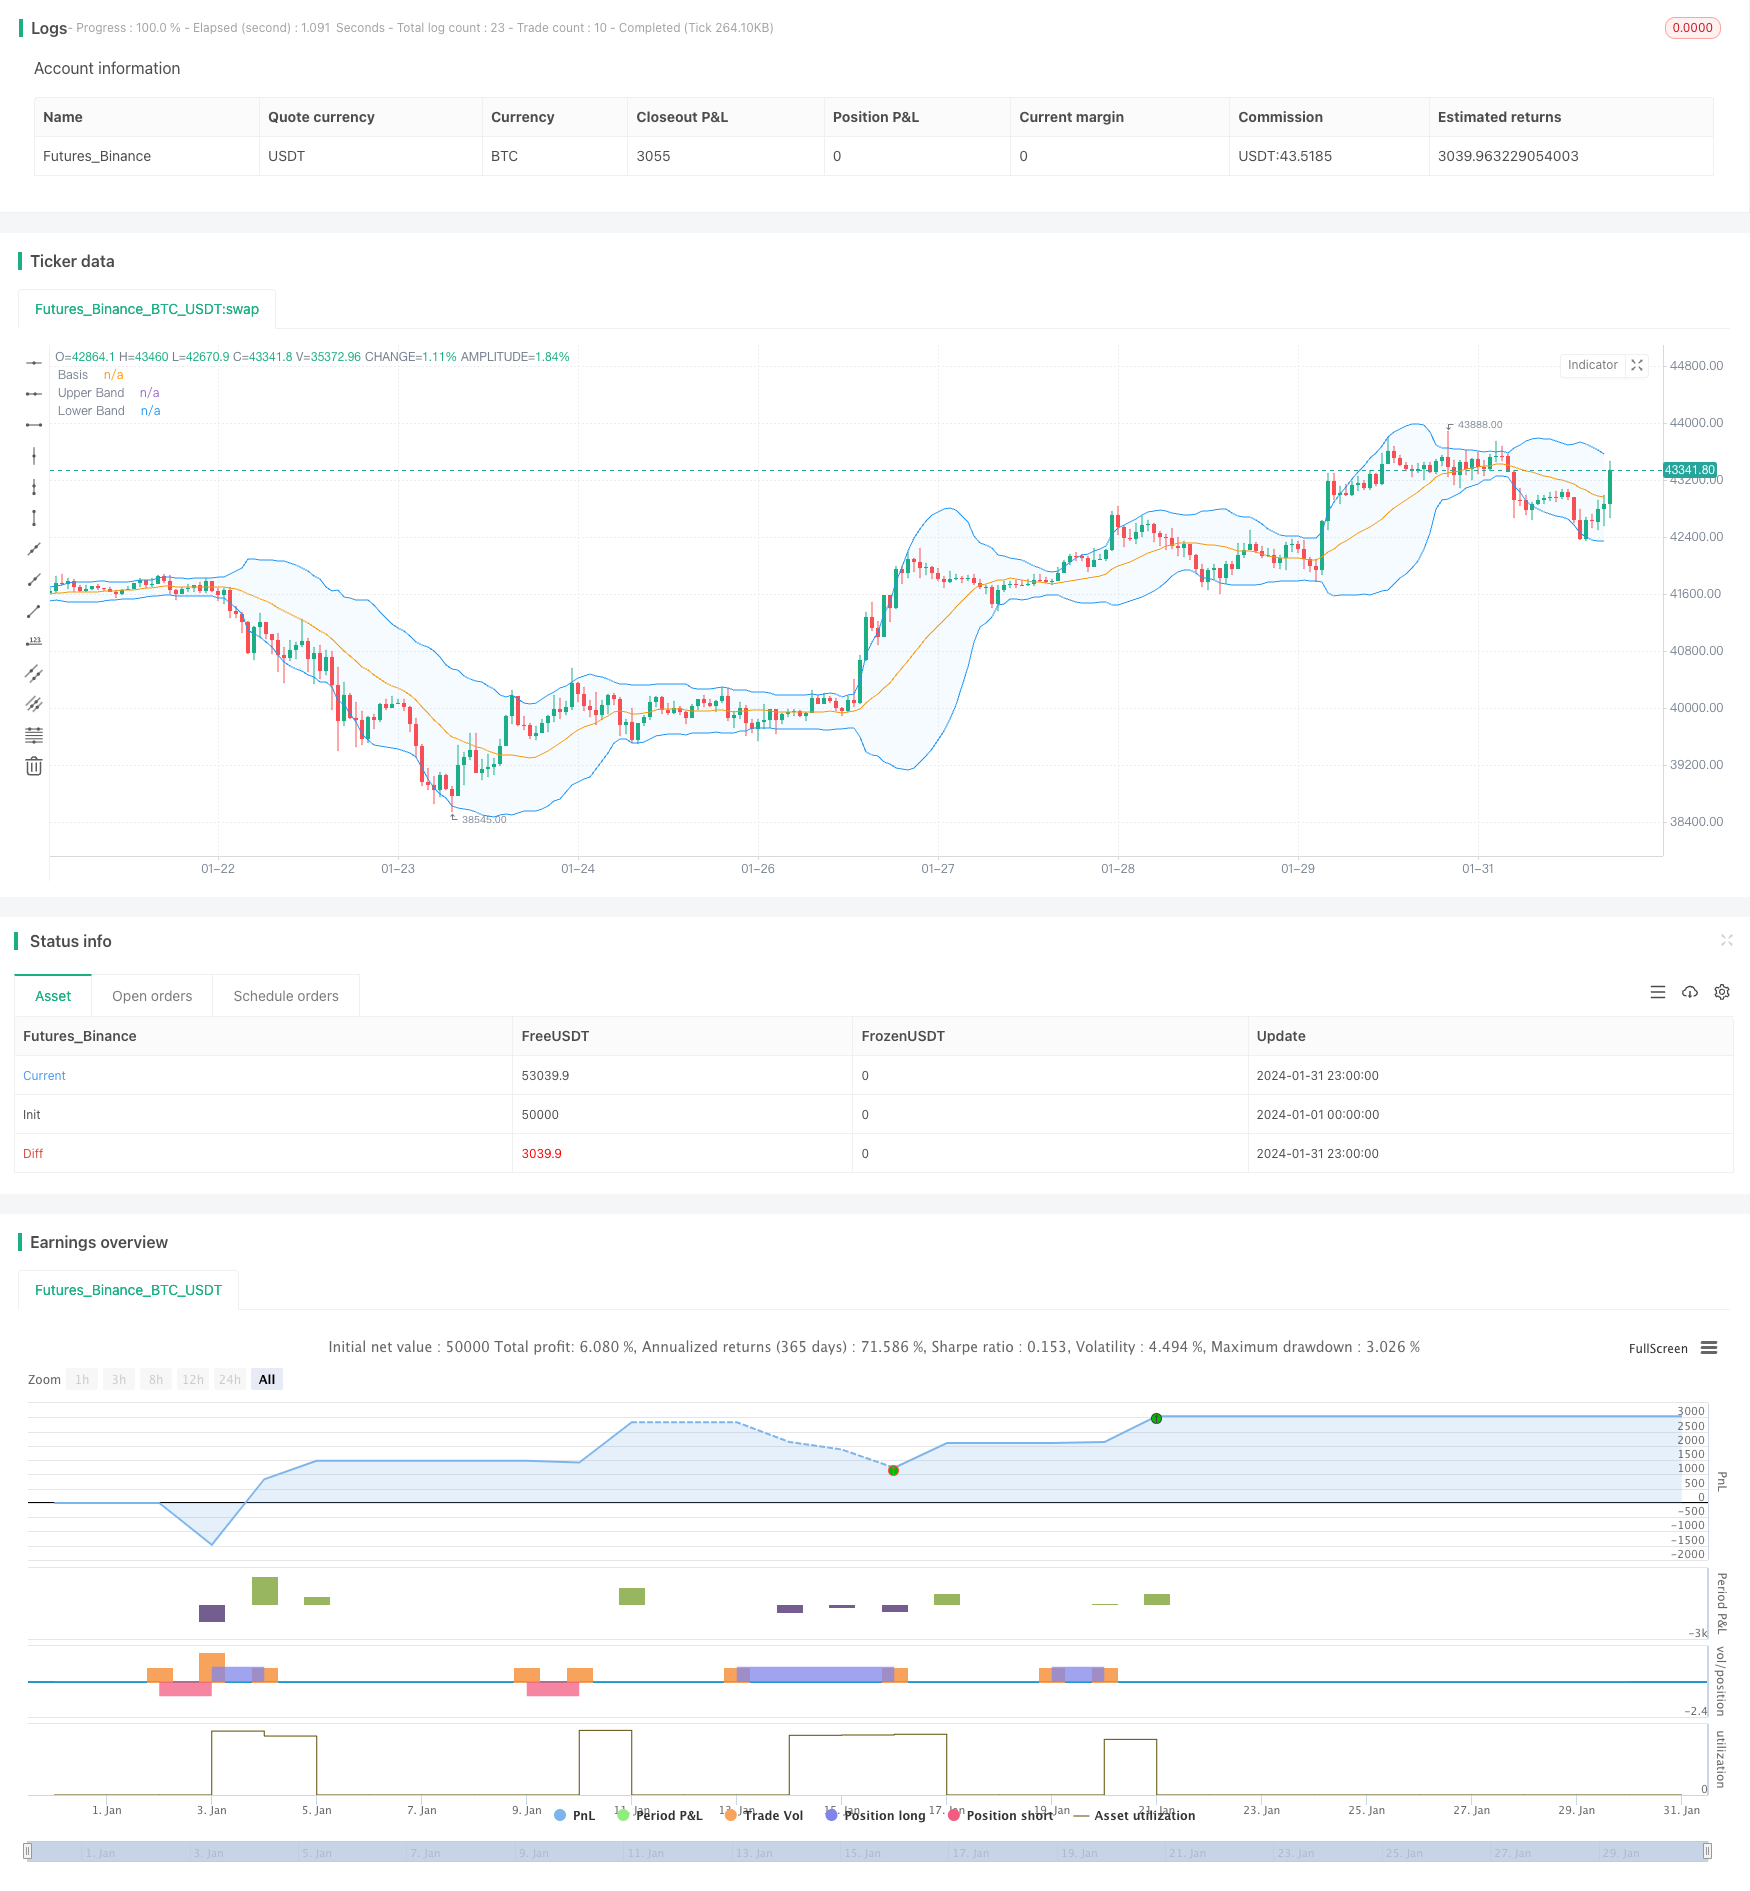
Overview
This strategy incorporates Bollinger Bands, RSI indicator and multi-timeframe analysis to capture the direction of mid-to-long term trends. It identifies trend reversal points through Bollinger Bands breakouts combined with RSI overbought/oversold signals for low-risk entry. Meanwhile, higher timeframes are applied to filter out ranging markets and avoid being trapped.
Strategy Logic
Apply Bollinger Bands to determine price breakouts. The middle band is the Moving Average of closing price over N days. The upper and lower bands are placed at a distance of one standard deviation on either side of the middle band. Breaking above upper band signals bullishness while breaking below lower band signals bearishness.
Incorporate the RSI indicator to identify overbought/oversold levels. RSI above 70 suggests overbought conditions while below 30 suggests oversold conditions. An RSI upside breakout above 70 confirms the weakening of upside momentum. An RSI downside breakout below 30 confirms the weakening of downside momentum.
Utilize higher timeframes to filter false breakouts. When a breakout signal emerges on the daily timeframe, it requires additional confirmation from the 4-hour or higher timeframes to avoid being trapped.
Advantages
Multi-indicator integration enhances strategy stability and profitability.
RSI inclusion mitigates losses from false breakouts.
Multi-timeframe analysis effectively filters out ranging markets and prevents being trapped.
Optimized breakout signal determination (breakouts over 3 consecutive bars) ensures sufficient trend maturity before entries.
Vortex Indicator determines nascent trend directionality early on.
Risks
Inadequate Bollinger Bands parameterization leads to erroneous overbought/oversold signals.
Reasonable RSI parameter values must be determined separately for different products.
Breakout signals may turn out to be false breakouts. Consider widening stop loss accordingly.
Maintain sufficient stop loss margin, e.g. 3 times ATR.
Enhancement Opportunities
Apply machine learning algorithms to auto-tune parameters for Bollinger Bands and RSI.
Optimize stop loss levels based on volatility metrics.
Incorporate position sizing module to calibrate exposures based on changing market conditions.
Constrain maximum loss per trade based on money management principles.
Evaluate signal stability across different trading sessions.
Conclusion
This strategy comprehensively examines trend determination, overbought/oversold conditions and multiple timeframes to control risks while seeking optimal entry timing to capture high-quality mid-to-long term trends for attractive risk-reward profiles. Further enhancements may be explored through parameter optimization, stop loss mechanisms etc. to achieve even better investment performance.
/*backtest
start: 2024-01-01 00:00:00
end: 2024-01-31 23:59:59
period: 1h
basePeriod: 15m
exchanges: [{"eid":"Futures_Binance","currency":"BTC_USDT"}]
*/

// This Pine Script™ code is subject to the terms of the Mozilla Public License 2.0 at https://mozilla.org/MPL/2.0/
// © Noway0utstorm
//@version=5
strategy(title='Vortex0.71.3 + bb 3bar breakout + rsi - close hit upper or lower', shorttitle='truongphuthinh', format=format.price, precision=4,overlay = true)

length = input(20, title="Length")
mult = input(2.0, title="Multiplier")
source = close

basis = ta.sma(source, length)
dev = mult * ta.stdev(source, length)

upperBand = basis + dev
lowerBand = basis - dev

isClosedBar = ta.change(time("15"))

var bool closeAboveUpperBand = false
var bool closeBelowLowerBand = false


// Vortex Indicator Settings
period_ = input.int(14, title='Period', minval=2)

VMP = math.sum(math.abs(high - low[1]), period_)
VMM = math.sum(math.abs(low - high[1]), period_)
STR = math.sum(ta.atr(1), period_)
VIP = VMP / STR
VIM = VMM / STR

//
lengthrsi = input(14, title="RSI Length")
overboughtLevel = input(70, title="Overbought Level")
oversoldLevel = input(30, title="Oversold Level")

sourcersi = close
rsiValue = ta.rsi(sourcersi, lengthrsi)

shouldShort = rsiValue > overboughtLevel
shouldLong = rsiValue < oversoldLevel


if bool(isClosedBar[1]) and bool(isClosedBar[2]) and bool(isClosedBar[3])

    if close[1] > upperBand[1] and close[2] > upperBand[2] and close[3] > upperBand[3] and VIP > 1.25 and VIM < 0.7 and rsiValue > overboughtLevel
        strategy.entry("Short", strategy.short)
        closeAboveUpperBand := false  // Reset the condition when entering a new Short position
    if close[1] < lowerBand[1] and close[2] < lowerBand[2] and close[3] < lowerBand[3] and VIP < 0.7 and VIM > 1.25 and rsiValue < oversoldLevel
        strategy.entry("Long", strategy.long)
        closeBelowLowerBand := false  // Reset the condition when entering a new Long position


if strategy.position_size > 0  // Check if there is an open Long position
    closeAboveUpperBand := close > upperBand  // Update the condition based on close price
    if closeAboveUpperBand
        strategy.close("Long",disable_alert=true)  // Close the Long position if close price is above upper band

if strategy.position_size < 0  // Check if there is an open Short position
    closeBelowLowerBand := close < lowerBand  // Update the condition based on close price
    if closeBelowLowerBand
        strategy.close("Short",disable_alert=true)  // Close the Short position if close price is below lower band

// Plots
plot(basis, color=color.orange, title="Basis")
p1 = plot(upperBand, color=color.blue, title="Upper Band")
p2 = plot(lowerBand, color=color.blue, title="Lower Band")
fill(p1, p2, title = "Background", color=color.rgb(33, 150, 243, 95))