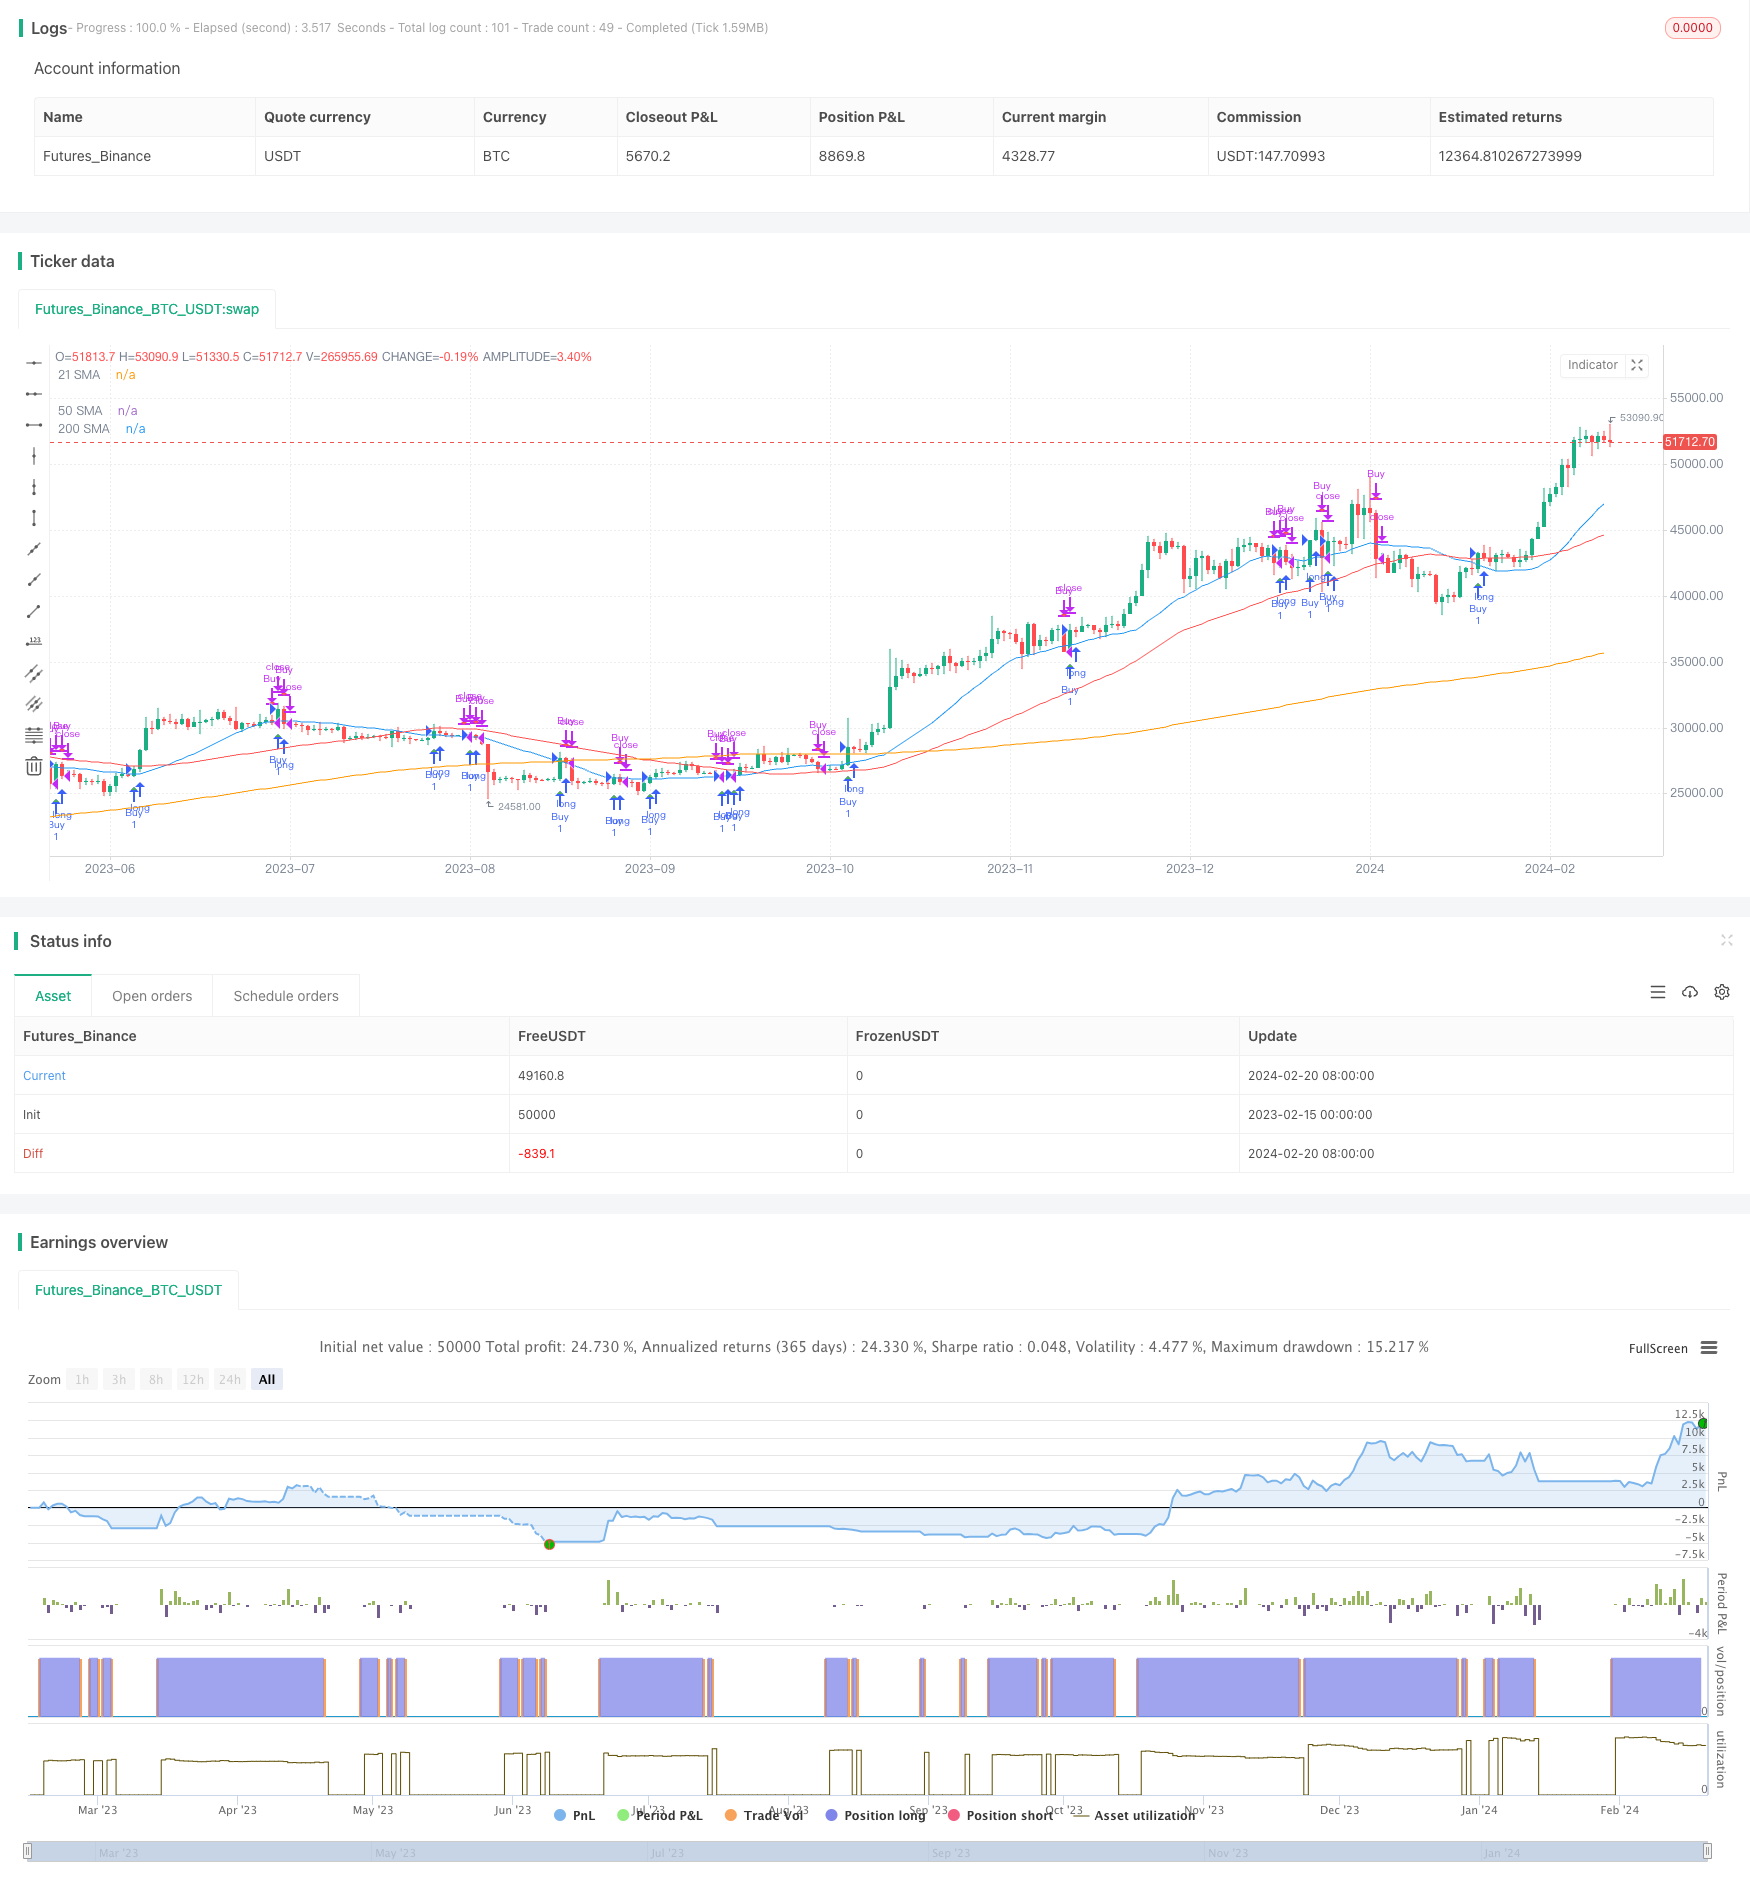
Quantitative Trading Strategy Based on Price Crossover with SMA
Author: ChaoZhang, Date: 2024-02-22 17:34:09Tags:

Overview
The strategy is named “Quantitative Trading Strategy Based on Price Crossover with SMA”. It mainly generates trading signals by calculating SMAs of different periods and tracking price crossover with SMAs. When price breaks SMA upwards, it triggers buy signal. When price breaks SMA downwards, it triggers sell signal.
Strategy Logic
The core logic of this strategy is to track price crossover with 21-day simple moving average (SMA). Meanwhile, it also calculates 50-day SMA and 200-day SMA to determine the general trend.
Specifically, the strategy requests close price within given date range, and calculates different SMAs based on input periods. If price breaks 21-day SMA upwards, it sets buy signal. If price breaks 21-day SMA downwards, it sets sell signal.
Along with calculating SMAs and determining crossovers, the strategy tracks current position as well. It enters position when buy signal triggers, and flattens position when sell signal triggers. In this way, it realizes automated trading system based on SMA crossover.
Advantage Analysis
The biggest advantage of this strategy is being simple and easy to understand and implement. SMA is a commonly used technical indicator and SMA crossover is one of the most common trading signals. This kind of indicator crossover strategies can be easily applied to different stocks and time range for automated trading.
Another advantage is that this strategy can be optimized by adjusting SMA parameters. For example, we can test different combinations of SMA periods to find the optimal one for specific stocks. Also, the strategy can be improved by adding other indicators for confirmation and optimization.
Risks and Solutions
The biggest risk of this strategy is that indicator-based strategies tend to generate excessive false signals. For instance, price may frequently crossover SMA during range-bound periods, resulting in unnecessary trades.
Common solutions include setting stop loss, tuning parameters, or adding filter conditions. For example, we can set maximum loss ratio to limit risk, adjust SMA periods to find more stable parameters, or use other indicators to filter some trading signals.
Optimization Directions
The strategy can be optimized in the following aspects:
Test and select optimal SMA parameter combinations. Backtest different SMA lengths to find the best periods.
Add other indicators for filterSignal confirmation, like RSI, MACD etc. This helps filter false signals.
Incorporate stop loss logic. Set maximum tolerable loss or trailing stop to better control risks.
Optimize entry timing. Consider entering around major breakouts rather than strictly following SMA crossover.
Test composite strategies. Combine with other strategy types like trend following.
Conclusion
The strategy realizes automated trading with simple SMA crossover signals. The pros are being easy to understand and implement. The cons are excessive signals and prone to whipsaws. We can improve it by parameter tuning, adding filters, stop loss etc. The strategy provides us a basic framework. We can enrich it by incorporating more components.
/*backtest
start: 2023-02-15 00:00:00
end: 2024-02-21 00:00:00
period: 1d
basePeriod: 1h
exchanges: [{"eid":"Futures_Binance","currency":"BTC_USDT"}]
*/

//@version=5
strategy("Price Cross Above/Below SMA Strategy", shorttitle="Tressy Strat", overlay=true)

// Define start and end year inputs
start_year = input.int(2022, title="Start Year")
end_year = input.int(2022, title="End Year")

// Define start and end month inputs
start_month = input.int(1, title="Start Month", minval=1, maxval=12)
end_month = input.int(12, title="End Month", minval=1, maxval=12)

// Define SMA length inputs
sma_length = input.int(21, title="SMA Length")
sma_length_50 = input.int(50, title="50 SMA Length")
sma_length_200 = input.int(200, title="200 SMA Length")

// Filter data within the specified date range
filter_condition = true
filtered_close = request.security(syminfo.tickerid, "D", close[0], lookahead=barmerge.lookahead_on)

// Define SMAs using the input lengths
sma = ta.sma(filtered_close, sma_length)
sma_50 = ta.sma(filtered_close, sma_length_50)
sma_200 = ta.sma(filtered_close, sma_length_200)

// Initialize position
var bool in_position = false

// Condition for a price cross above SMA within the date range
cross_above = filter_condition and ta.crossover(filtered_close, sma)

// Condition for a price cross below SMA within the date range
cross_below = filter_condition and ta.crossunder(filtered_close, sma)

// Buy condition
if cross_above
    in_position := true

// Sell condition
if cross_below
    in_position := false

// Strategy entry and exit
if cross_above
    strategy.entry("Buy", strategy.long)
if cross_below
    strategy.close("Buy")

// Plot the SMAs on the chart
plot(sma, color=color.blue, title="21 SMA")
plot(sma_50, color=color.red, title="50 SMA")
plot(sma_200, color=color.orange, title="200 SMA")

// Plot the Buy and Sell signals with "tiny" size
plotshape(cross_above, style=shape.triangleup, location=location.belowbar, color=color.green, size=size.tiny, title="Buy Signal")
plotshape(cross_below, style=shape.triangledown, location=location.abovebar, color=color.red, size=size.tiny, title="Sell Signal")
- Trend Following Strategy Based on Moving Average Crossover
- Dual EMA Golden Cross Long Line Strategy
- Dynamic Regression Channel Strategy
- Reversal Momentum Breakout Strategy
- Triple Dynamic Moving Average Trend Tracking Strategy
- Momentum Breakout EMA Crossover Strategy
- Trading Dynamic Trend Tracking Strategy
- MACD Momentum with MA Strategy
- EMA Crossover Trading Strategy
- Simple Cryptocurrency Trading Strategy Based on RSI
- Dual Moving Average Crossover Strategy with Stop Loss and Take Profit
- The Momentum Tracking and Trend Strategy
- Trend Following Strategy Based on MA Lines
- Trend Following Strategy Based on Bollinger Bands
- The Oscillating Breakthrough Strategy
- Adaptive Moving Average Trading Strategy
- RSI Golden Cross Short Strategy
- Dual Moving Average and Bollinger Band Combination Trend Tracking Strategy
- Adaptive Fluctuation Strategy Based on Quantitative Range Breakthrough
- Bull Flag Breakout Strategy