概述
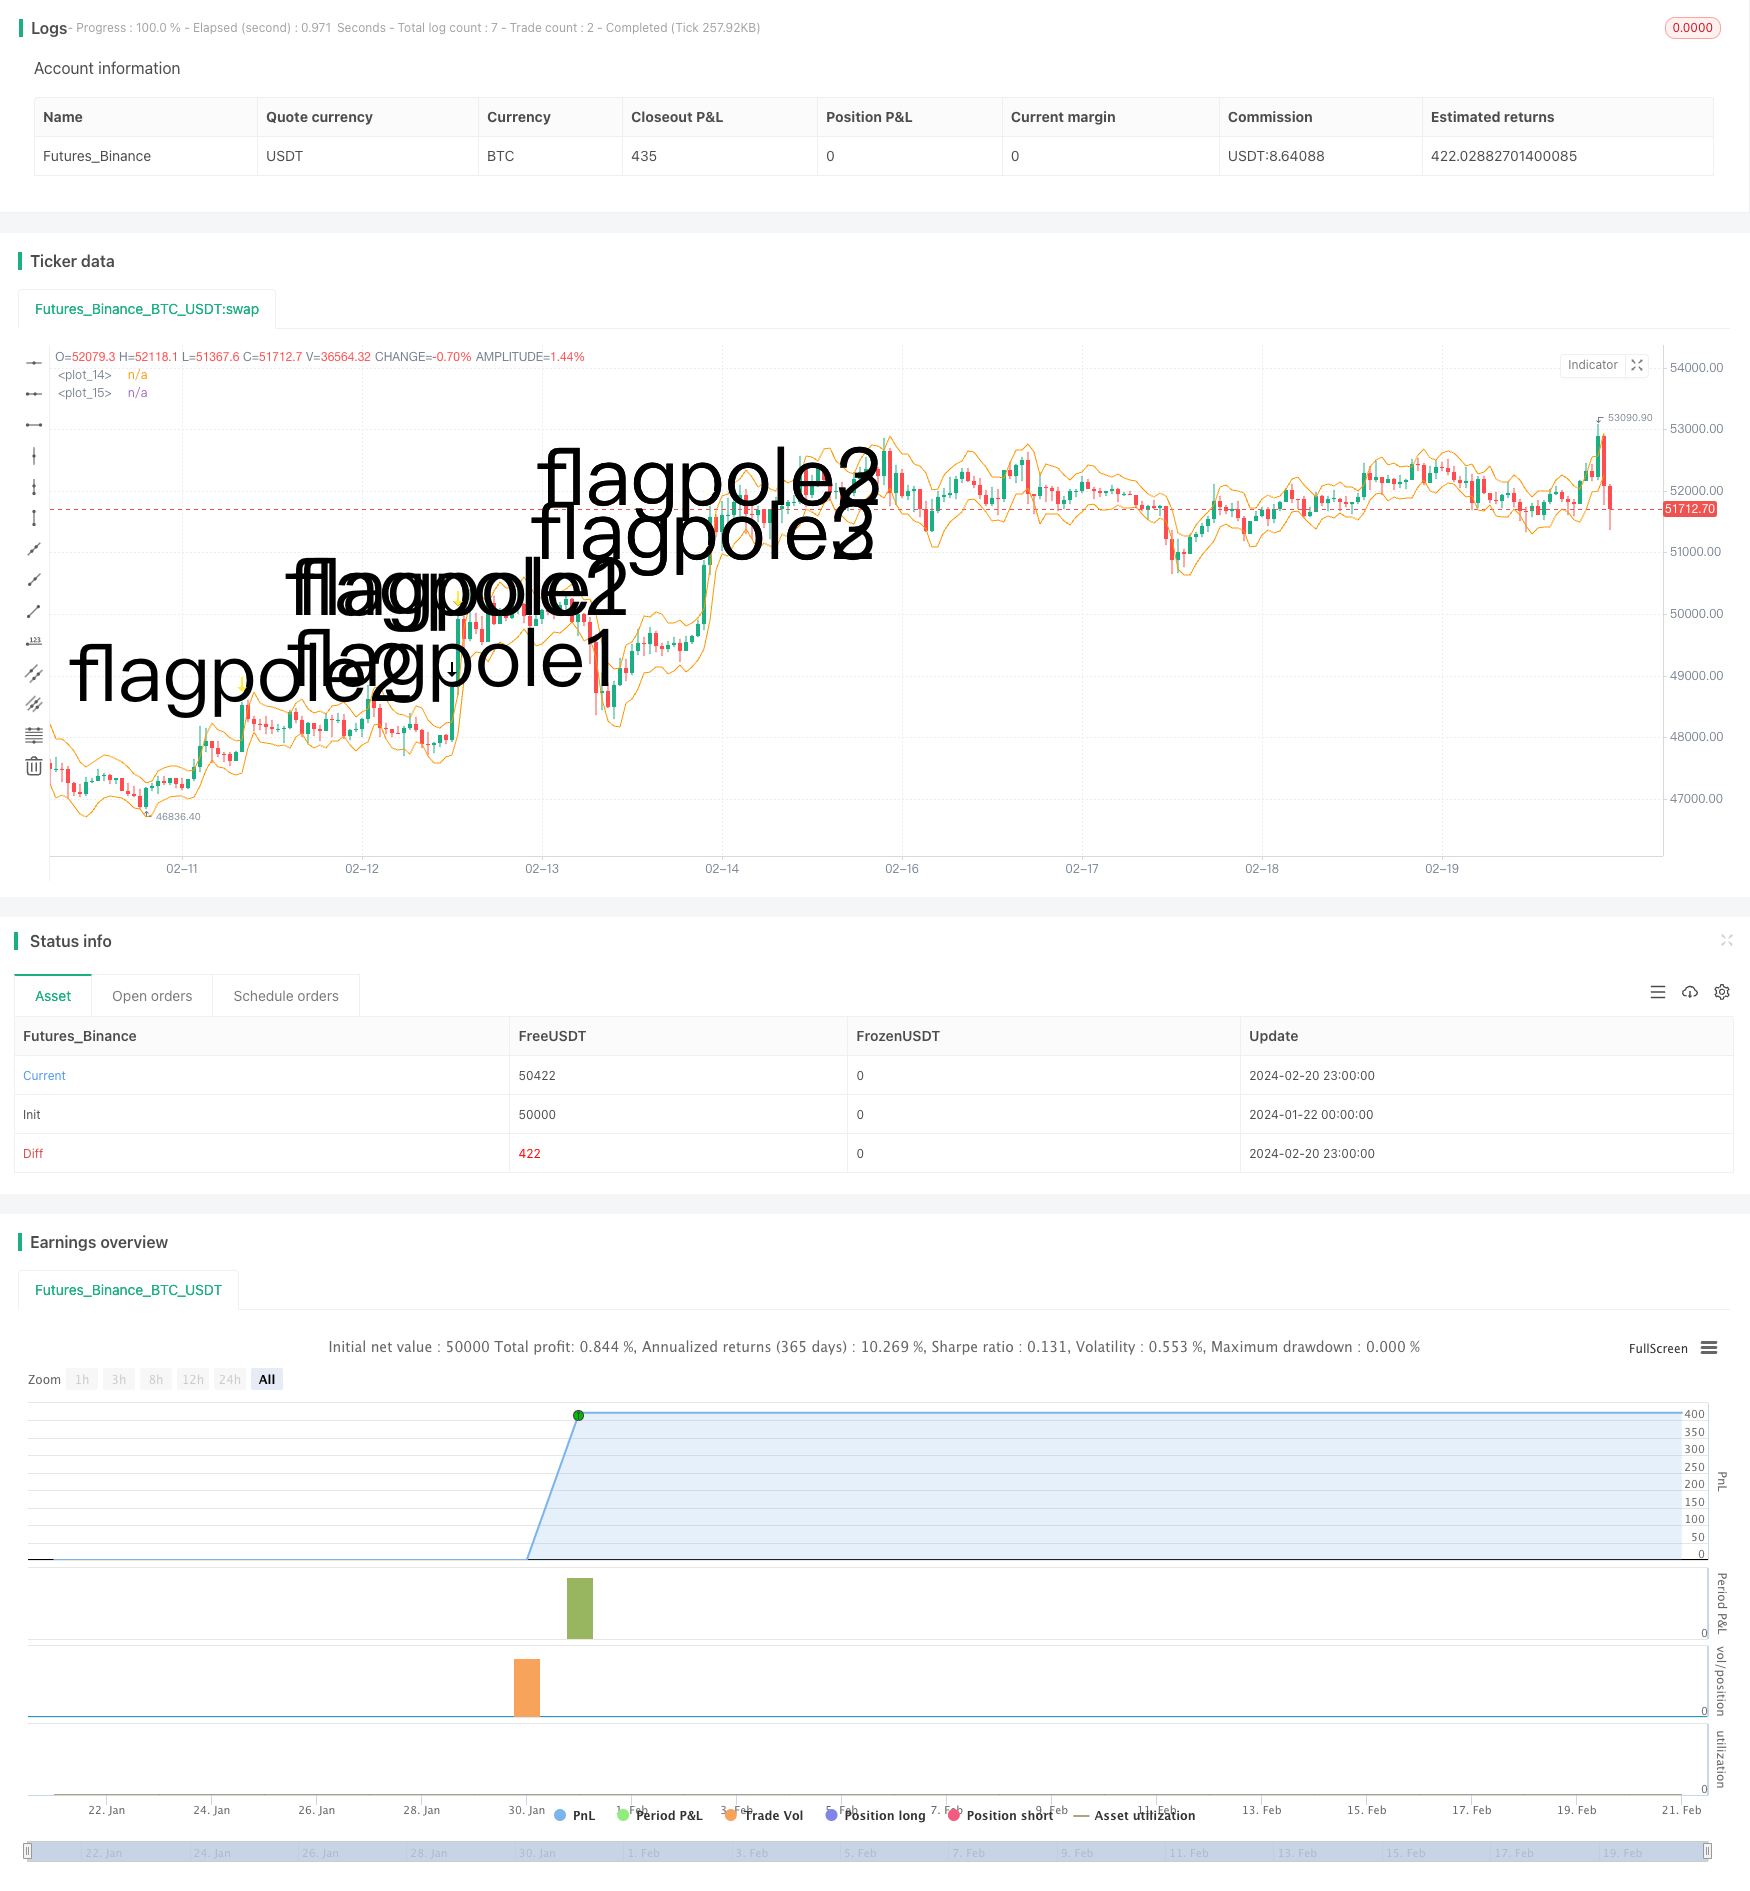
旗型突破策略是一种技术分析策略,它通过识别旗型图形并在突破点入场,目标是捕捉趋势的开始。该策略使用平均真实波动范围(ATR)指标辅助判断,在明确的旗杆后判断旗帜范围,从而筛选入场机会。
策略原理
该策略主要分为以下几个步骤:
- 确定旗杆:需要满足价格创新高和突破ATR通道。
- 确定旗杆高度:测量旗杆顶点与前期SMA的距离。
- 确定旗帜范围:旗帜低点为旗杆高度的33%,作为旗帜的最小范围。
- 判定旗型:判断前3根K线是否全部处于旗帜范围内。
- 入场:出现旗型时做多。
- 出场:固定持有6根K线后清仓。
在判断旗杆和旗帜时,策略巧妙地利用ATR指标判断明显突破,并且严格限定旗帜高度在旗杆高度33%以内,避免过多假信号。此外,判断连续3根K线构成旗帜,可靠性较高。总体来说,该策略规则设计严谨,在捕捉趋势初期突破上确实有一定优势。
优势分析
该策略主要具有以下几个优势:
- 利用旗型结构判定趋势开始,是技术分析中较经典的方法,成功率较高。
- ATR指标和严格范围限制可避免大量假信号,提高入场准确率。
- 固定6根K线出场可锁定部分利润,避免走势反转风险。
- 策略规则清晰易实现,容易掌握和遵循。
- 可在各类行情中寻找机会,灵活性较好。
风险分析
该策略的主要风险包括:
- 旗型无法完全判断趋势,也存在失败的情况。
- 6根K线出场过于武断,可能会过早离场。
- 行情过于震荡时,容易产生假旗型。
- 无法有效控制单笔损失。
针对以上风险,我们可以设置止损策略,或者优化出场机制,在盈利达到一定比例时及时获利了结。此外,我们也可以结合其它指标进行过滤,避免行情过于震荡时产生假信号。
优化方向
该策略可以从以下几个方向进行优化:
- 利用MACD、KD等指标结合,避免震荡行情下假信号。
- 根据市场类别参数化ATR倍数、出场周期等,使策略更具适应性。
- 设置移动止损或考虑收益回撤比来动态出场。
- 尝试machine learning方法寻找更准确的特征判定旗帜高度。
- 评估实际胜率和盈亏比,动态调整仓位规模。
总结
总体而言,旗型突破策略利用技术形态判断趋势开始,是一种较为经典的方法,该策略在入场规则设计上确实严谨,可过滤大量假信号。但风险控制和出场机制仍有优化空间,我们可以从整体角度考量,使策略在不同市场中都能稳定运行。如果经过充分验证和优化,该策略可以成为量化交易体系中的一个有价值的组成部分。
策略源码
/*backtest
start: 2024-01-22 00:00:00
end: 2024-02-21 00:00:00
period: 1h
basePeriod: 15m
exchanges: [{"eid":"Futures_Binance","currency":"BTC_USDT"}]
*/

// © smith26
//This strategy enters on a bull flag and closes position 6 bars later.  Average true range is used instead of a moving average.
//The reason for ATR instead of MA is because with volatile securities, the flagpole must stand up a noticable "distance" above the trading range---which you can't determine with a MA alone.
//This is broken up into multiple parts: Defining a flagpole, defining the pole height, and defining the flag, which will be constrained to the top third (33%) of the pole height to be considered a flag.
//@version=4
strategy("Bull Flag v1.00", overlay=true)

ATR = atr(10) //Average True Range over last 10 bars.

upperATR = ohlc4[1] + ATR[1]  //Open + High + Low + Close divided by 4, + prior ATR.  Just used here for visually plotting the ATR upper channel.
lowerATR = ohlc4[1] - ATR[1] //Open + High + Low + Close divided by 4, - prior ATR.  Just used here for visually plotting the ATR lower channel.

//uncomment these two lines to see ATR channels
plot(upperATR, color=color.orange)
plot (lowerATR, color=color.orange)

//Current close higher than previous close, and current close minus current open is greater than 3 times the previous ATR.  "3x ATR" is chosen because any less was not a noticeable distance above the trading range.
flagpole1 = close>close[1] and (close-open) > (ATR[1] * 3)
plotshape(flagpole1, text="flagpole1", style=shape.arrowdown, size=size.huge) //Plots an arrow for flagpole1 for QA testing

//Two consecutive close higer than their previous close, and current close minus PREVIOUS open is greater than 3 times the previous ATR.
flagpole2 = close>close[1] and close[1]>close[2] and (close-open[1]) > (ATR[1] * 3)
plotshape(flagpole2, text="flagpole2", style=shape.arrowdown, size=size.huge, color=color.yellow) //Plots an arrow for flagpole2 for QA testing

//Three consecutive close higer than their previous close, and current close minus open from 2 bars ago is greater than 3 times the previous ATR.
flagpole3 = close>close[1] and close[1]>close[2] and close[2]>close[3] and (close-open[2]) > (ATR[1] * 3)
plotshape(flagpole3, text="flagpole3", style=shape.arrowdown, size=size.huge, color=color.white) //Plots an arrow for flagpole3 for QA testing

//A flagpole can be any of the three definitions of flagpole.
flagpole = flagpole1 or flagpole2 or flagpole3

//This will return the number of bars since "flagpole" was true.  Not being used, but could be useful.
//since_flagpole = barssince(flagpole)

after_pole_1 = flagpole[1] //This marks the bar directly after a flagpole.
//plotshape(after_pole_1, text="after_pole_1", style=shape.cross, size=size.large, color=color.white) //Plots a cross for after_pole_1 for QA testing
after_pole_2 = flagpole[2] //This marks the bar two bars after a flagpole.
after_pole_3 = flagpole[3] //This marks the bar three bars after a flagpole.

//This returns the price at the "top" of the flagpole (using close price) at the most recent occurence, 0.
pole_top = valuewhen(flagpole, close, 0)
//plot(pole_top, trackprice=true)  //plots a horizontal line at the most recent pole_top

//Measures the distance between last pole top and the previous SMA.
pole_height = pole_top - sma(close, 10)[1]
//plot(pole_height)

//This marks 33% below the pole_top, which will be the lowest point a flag can be.
flag_bottom = pole_top - (.33 * pole_height)
//plot(flag_bottom)

//The first, second, and third bars after the pole are considered part of a flag when open and close are between the pole_top and flag_bottom
flag1 = after_pole_1 and (open >= flag_bottom) and (open <= pole_top) and (close >= flag_bottom) and (close <= pole_top)
//plotshape(flag1, text="flag1", style=shape.flag, size=size.large, color=color.teal)
flag2 = after_pole_2 and (open >= flag_bottom) and (open <= pole_top) and (close >= flag_bottom) and (close <= pole_top)
//plotshape(flag2, text="flag2", style=shape.flag, size=size.large, color=color.teal)
flag3 = after_pole_3 and (open >= flag_bottom) and (open <= pole_top) and (close >= flag_bottom) and (close <= pole_top)
//plotshape(flag3, text="flag3", style=shape.flag, size=size.large, color=color.teal)

//When all three bars after a flagpole are a flag, the criteria are met and we have a "bull_flag"
//Specifically, when current bar is flag3, previous bar is flag2, and 2 bars ago is flag1, we have a bull_flag.
bull_flag = flag3 and flag2[1] and flag1[2]
plotshape(bull_flag, text="bull_flag", style=shape.flag, size=size.large, color=color.white) //Plots a flag for bull_flag for QA testing


if (bull_flag)
    strategy.entry("Long", strategy.long)

if barssince(bull_flag) == 6 //close 6 bars after entry.
    strategy.close("Long")