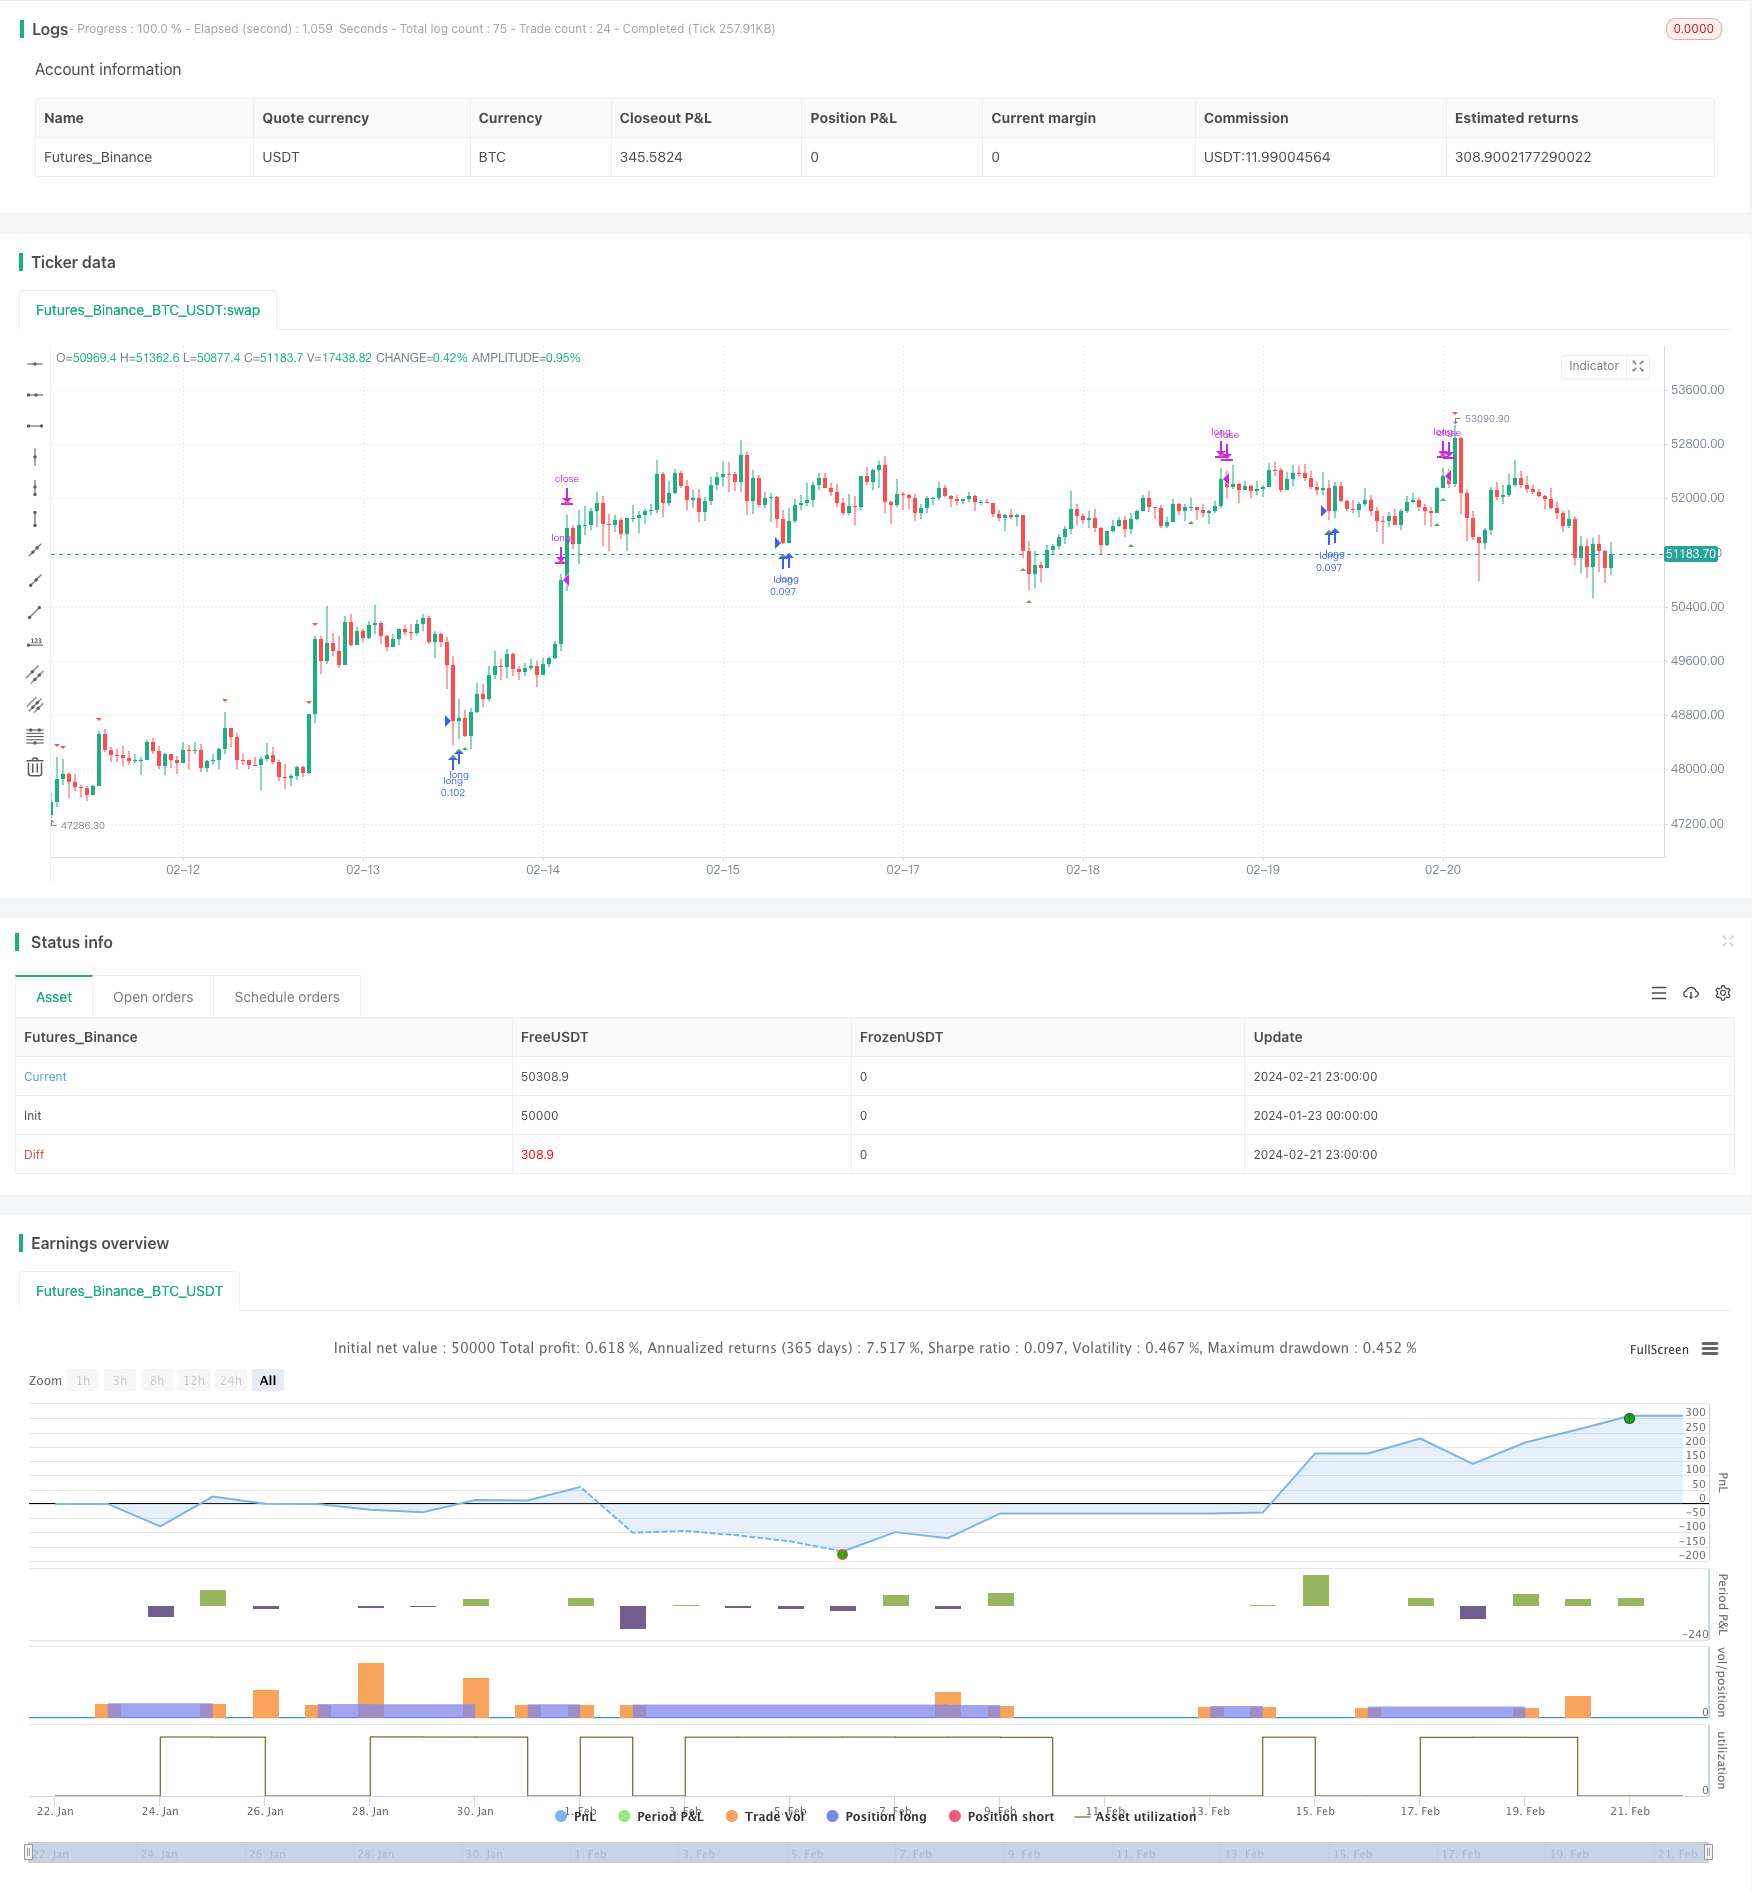
Overview
The Quadruple Crossing Strategy is a medium-to-long term trading strategy. It combines various technical indicators to identify trend changes in stock prices and generates trading signals at critical points. The main technical indicators include moving averages, trading volumes, Relative Strength Index (RSI) and Moving Average Convergence Divergence (MACD). This multi-indicator combination can improve signal reliability and reduce the probability of erroneous trades.
Strategy Logic
The Quadruple Crossing Strategy makes trading decisions based on combined signals from the following four sets of indicators:
- Price crossing its 200-day Exponential Moving Average (EMA200)
- Relationship between the closing price today and the previous day
- Amplification feature of trading volumes
- Oversold and overbought signals from RSI
- Golden crosses and death crosses of MACD
Trading decisions are triggered when these four indicator sets give signals in the same direction. In addition, two independent signals are configured to complement: ratio of price deviation from its 20-day EMA and touching boundaries of Bollinger Bands. In general, this strategy seeks to reduce the probability of wrong signals and capture relatively reliable trading opportunities.
Advantage Analysis
The biggest advantage of the Quadruple Crossing Strategy lies in the combinatorial use of multiple indicators. A single indicator can hardly judge the market comprehensively. Combined indicators provide references in more dimensions, reducing errors. Specifically, the main advantages of this strategy include:
- Using EMA200 to identify the main trendline and spot mid-to-long term trends
- Price amplification feature filters false breakouts
- RSI avoids trading in overbought/oversold zones
- MACD judges short-term internal trends and reversals
- The double independent signals improve reliability
In general, the Quadruple Crossing Strategy is very suitable for medium-to-long term position trading, capable of getting relatively steady returns along major trends.
Risk Analysis
The Quadruple Crossing Strategy also carries some risks, mainly in the following aspects:
- The probability of wrong signals from the indicators still exists
- Lack of stop loss/take profit fails to control single loss
- Larger drawdowns require sufficient psychological bearing capability
- Trading frequency may be too high or too sparse
- Improper parameter settings affect actual performance
In addition, preset parameters and conditions also limit the adaptiveness of the Quadruple Crossing Strategy. Its performance may degrade significantly if market environments see major changes.
Optimization Directions
Based on the above risk analysis, the Quadruple Crossing Strategy can be optimized in the following aspects:
- Add stop loss/take profit functions to control single losses
- Adjust parameter combinations to optimize trading frequency
- Introduce algorithmic judgments to improve adaptability
- Add more condition restrictions to further control erroneous trades
These optimizations can reduce trading risks while maintaining the merits of the original strategy, improving the rate of return.
Summary
In summary, by leveraging the advantage of multi-indicator judgments, the Quadruple Crossing Strategy seeks to capture high probability and high reliability medium-to-long term trading opportunities while controlling risks. It suits investors with sufficient funds and psychological bearing capability. By introducing elements like stop loss/take profit and dynamic optimizations, this strategy can be further enhanced. It represents a typical example of combinatorial application of multi-indicator trading ideas.
/*backtest
start: 2024-01-23 00:00:00
end: 2024-02-22 00:00:00
period: 1h
basePeriod: 15m
exchanges: [{"eid":"Futures_Binance","currency":"BTC_USDT"}]
*/

// This Pine Script™ code is subject to the terms of the Mozilla Public License 2.0 at https://mozilla.org/MPL/2.0/
// © anonXmoous

//@version=5
strategy("Quadruple Cross Strategy", overlay=true, initial_capital=100000, currency="TRY", default_qty_type=strategy.percent_of_equity, default_qty_value=10, pyramiding=0, commission_type=strategy.commission.percent, commission_value=0.1)

// Verileri tanımla
price = close
ema200 = ta.ema(price, 200)
ema20 = ta.ema(price, 20)
vol= volume
rsi = ta.rsi(price, 14)
[macdLine, signalLine, histLine] = ta.macd(price, 12, 26, 9)
n = 20 // SMA periyodu
k = 2.5 // Standart sapma katsayısı
// Bollinger bandı parametrelerini tanımla
sma = ta.sma(price, n) // 20 günlük SMA
std = ta.stdev(price, n) // 20 günlük standart sapma
upperBB = sma + k * std // Bollinger bandının üst sınırı
lowerBB = sma - k * std // Bollinger bandının alt sınırı

// Alım sinyali koşullarını belirle
buyCondition1 = price > ema200 and (price - ema200) / ema200 <= 0.05 or price == ema200
buyCondition2 = price > price[1]
buyCondition3 = vol > vol[1] and vol[1] > vol[2]
buyCondition4 = rsi > 35 and rsi > rsi[1]
buyCondition5 = macdLine > signalLine and histLine > 0
buyCondition6 = price < ema20 and (price - ema20) / ema20 <= -0.14 // bağımsız al değiken 1
buyCondition7 = price < lowerBB // bağımsız al değiken 2- Bollinger bandının alt sınırına dokunduysa, alım sinyali

// Satım sinyali koşullarını belirle
sellCondition1 = price < ema200 and (price - ema200) / ema200 >= -0.03 or price == ema200
sellCondition2 = price < price[1]
sellCondition3 = vol > vol[1] and vol[1] > vol[2]
sellCondition4 = rsi < 65 and rsi < rsi[1]
sellCondition5 = macdLine < signalLine and histLine < 0
sellCondition6 = price > ema20 and (price - ema20) / ema20 >= 0.19 // bağımsız sat değiken 1
sellCondition7 = price > upperBB // bağımsız sat değiken 2- Bollinger bandının üst sınırına dokunduysa, satım sinyali

// Alım ve satım sinyallerini oluştur
buySignal = (buyCondition1 and buyCondition2 and buyCondition3 and buyCondition4 and buyCondition5) or buyCondition6 or buyCondition7
sellSignal = (sellCondition1 and sellCondition2 and sellCondition3 and sellCondition4 and sellCondition5) or sellCondition6 or sellCondition7

// Alım ve satım sinyallerini stratejiye ekle
if (buySignal)
    strategy.entry("long", strategy.long, comment = "Buy")
if (sellSignal)
    strategy.close("long", comment = "Sell")
// Alım ve satım sinyallerini grafik üzerinde göster
plotshape(buySignal, style=shape.triangleup, location=location.belowbar, color=color.new(color.green, 0), size=size.small)
plotshape(sellSignal, style=shape.triangledown, location=location.abovebar, color=color.new(color.red, 0), size=size.small)