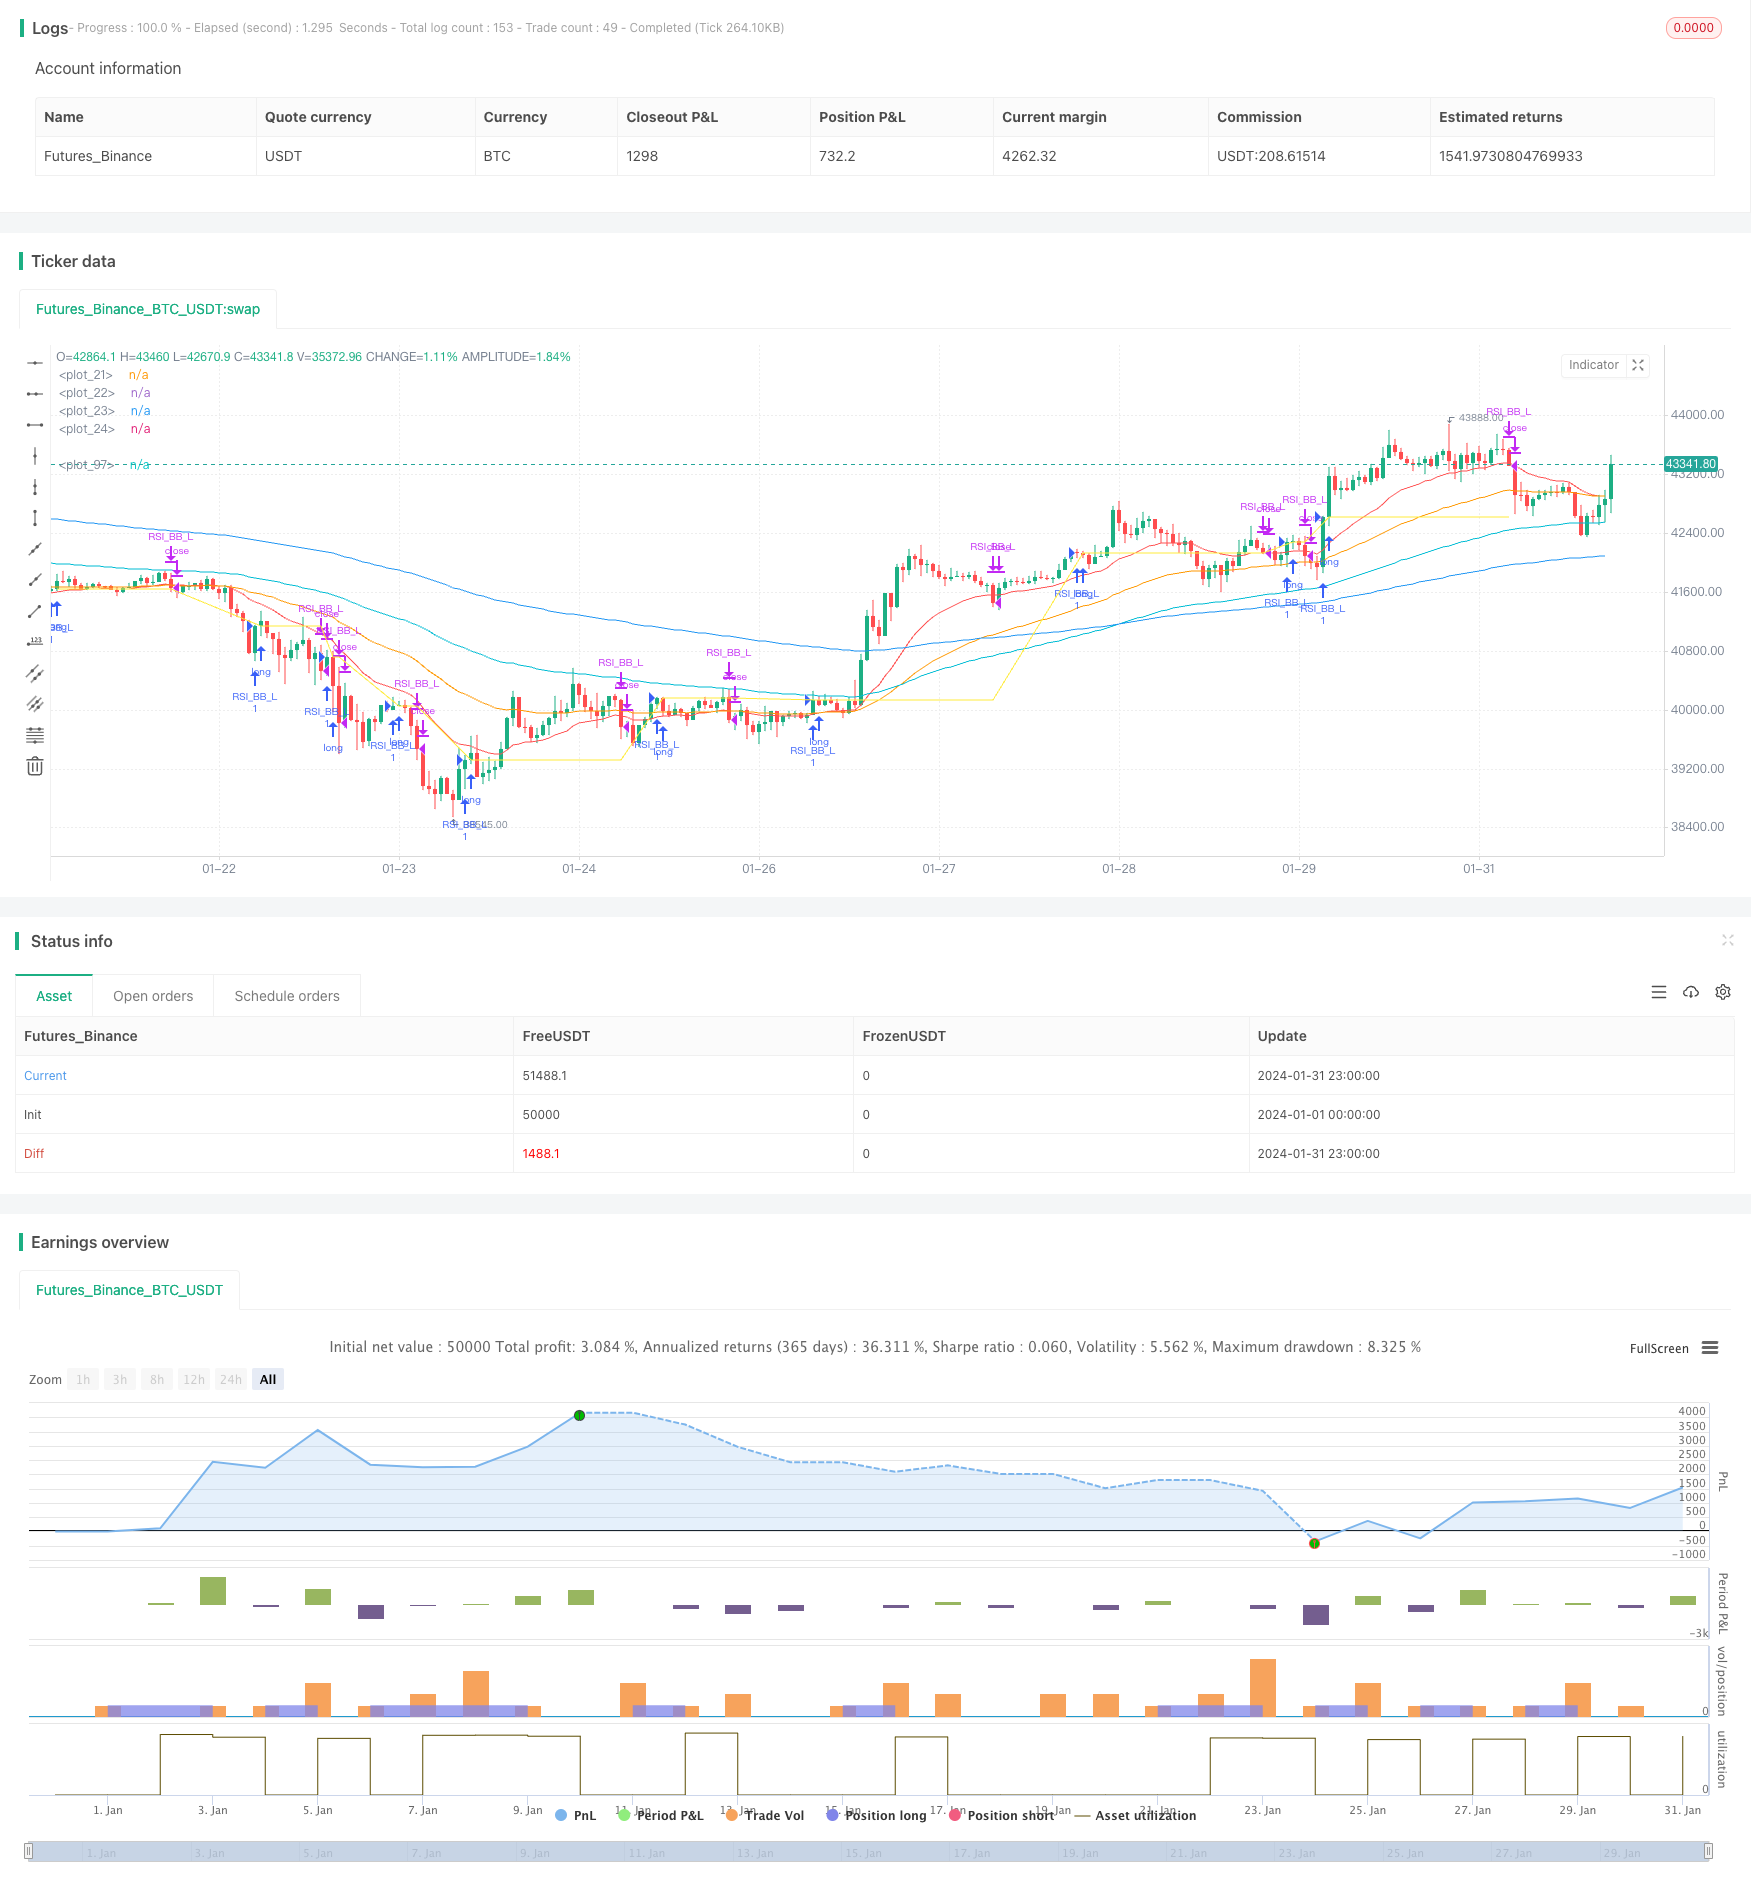
Quantitative Trading Strategy Based on Bollinger Bands and MACD
Author: ChaoZhang, Date: 2024-02-23 14:30:30Tags:

Overview
This strategy is a quantitative trading strategy based on Bollinger Bands and MACD indicators. It combines Bollinger Bands breakout trading and MACD trend tracking to improve the quality of trading signals.
Strategy Principle
The strategy mainly uses Bollinger Bands and MACD indicators to determine trading signals.
Bollinger Bands consist of a middle band, upper band and lower band. A buy signal is generated when the price breaks through the lower band. A sell signal is generated when the price breaks through the upper band. The strategy uses the breakout principle of Bollinger Bands to determine stronger breakout signals.
The MACD indicator reflects the relationship between short-term and long-term moving averages. It uses crossovers of the difference line and signal line to determine entry and exit points. This strategy integrates the use of MACD indicators to filter Bollinger Bands trading signals and generate more effective buy signals when the difference line crosses above the signal line.
Overall, the strategy combines the trend tracking of Bollinger Bands and the moving average advantages of MACD, aiming to capture greater market fluctuations in strong trends.
Advantages of the Strategy
Combining Bollinger Bands and MACD indicators makes trading signals more reliable.
Bollinger Bands trend tracking and MACD moving average crossovers can produce stronger entry signals in trending markets.
False signals can be effectively filtered through dual indicator judgement, reducing trading risk.
There is great room for parameter optimization of the strategy, which can be adjusted according to different products and cycles.
Risks of the Strategy
In range-bound markets, trading signals generated by Bollinger Bands and MACD may be frequent, bringing risks of over-trading.
Three successive MACD golden crosses at low levels may face the risk of a downward reversal.
The strategy uses multiple indicators, making parameter optimization and strategy testing quite difficult.
To address these risks, methods like adjusting holding periods, setting stop losses, optimizing parameters can be used to control them.
Directions for Strategy Optimization
Test longer period Bollinger Bands parameters to reduce trading frequency.
Optimize MACD fast and slow line parameters to improve indicator sensitivity.
Add other indicators for filtering, like KDJ, RSI etc, to improve signal quality.
Set dynamic stops to automatically exit trades and control single trade risks.
Conclusion
In theory, by integrating Bollinger Bands breakout trading and MACD indicator filtering, this strategy can produce high quality trading signals. Through parameter optimization and risk control measures, good backtest results may be achieved. However, no strategy can completely avoid losses. The actual trading performance needs prudent assessment.
/*backtest
start: 2024-01-01 00:00:00
end: 2024-01-31 23:59:59
period: 1h
basePeriod: 15m
exchanges: [{"eid":"Futures_Binance","currency":"BTC_USDT"}]
*/

//@version=5
strategy("Nabz-BBMACD-2022-V1.1", shorttitle="BBM-Nabz", overlay=true)


// My 1st Pine Scrpt Indicator
// Work on best on 1Hr Chart
// Open for Help/Donations.


var float lastentry=1
int result = 0
float x = 0
drawshape = false

/////////////EMA
shortest = ta.ema(close, 20)
short = ta.ema(close, 50)
longer = ta.ema(close, 100)
longest = ta.ema(close, 200)

plot(shortest, color = color.red)
plot(short, color = color.orange)
plot(longer, color = color.aqua)
plot(longest, color = color.blue)

///////////// RSI
RSIlength = input(6,title="RSI Period Length")
RSIoverSold = 50
RSIoverBought = 50
price = close
vrsi = ta.rsi(price, RSIlength)


///////////// Bollinger Bands
BBlength = input.int(200, minval=1,title="Bollinger Period Length")
BBmult = 2 // input(2.0, minval=0.001, maxval=50,title="Bollinger Bands Standard Deviation")
BBbasis = ta.sma(price, BBlength)
BBdev = BBmult * ta.stdev(price, BBlength)
BBupper = BBbasis + BBdev
BBlower = BBbasis - BBdev
source = close
buyEntry = ta.crossover(source, BBlower)
sellEntry = ta.crossunder(source, BBupper)


////////////// MACD
fastLength = input(12)
slowlength = input(26)
MACDLength = input(9)
MACD = ta.ema(close, fastLength) - ta.ema(close, slowlength)
aMACD = ta.ema(MACD, MACDLength)
delta = MACD - aMACD


///////////// Colors
switch1=input(true, title="Enable Bar Color?")
switch2=input(true, title="Enable Background Color?")
TrendColor = RSIoverBought and (price[1] > BBupper and price < BBupper) and BBbasis < BBbasis[1] ? color.red : RSIoverSold and (price[1] < BBlower and price > BBlower) and BBbasis > BBbasis[1] ? color.green : na


///////////Strategy

bool tcu = not (ta.crossunder(price[0],shortest[0]))


if (((price[1]<BBlower[1]) and (ta.crossover(price,BBlower))))
    lastentry := low[1]
    strategy.entry("RSI_BB_L", strategy.long, comment="Buy 1st IF")

if (((ta.crossover(delta, 0.0) and (ta.crossover(price,BBlower)))))
    lastentry := low[1]
    strategy.entry("RSI_BB_L", strategy.long, comment="Buy 2nd IF")

if (((ta.crossover(delta, 0.0)) and (low[0]>shortest[0])) and (price[1]<low))
    lastentry := low[1]
    strategy.entry("RSI_BB_L", strategy.long, comment="Buy 3rd IF")   //else

if (((ta.crossover(delta, 0.01)) and (high[1]<BBupper)) and (tcu))
    lastentry := low[1]
    strategy.entry("RSI_BB_L", strategy.long, comment="Buy 4th IF")


if ((ta.crossunder(low[0],shortest[0]) and close<shortest))
    strategy.close(id="RSI_BB_L", comment="Close by 1st IF")


if (price<lastentry)
    drawshape := true

if (price<strategy.opentrades.entry_price(0)/1.01175734321249)
    strategy.close(id="RSI_BB_L", comment="Close by 2nd IF")


plot(strategy.opentrades.entry_price(0), color=color.yellow)
- Trend Following Strategy Based on Moving Average Crossover
- Spaced Out Trading Strategy
- MoonFlag MACD Momentum StochRSI Trading Strategy
- Institutional Trader Strategy Based on Price Action
- Rainbow Oscillator Trading Strategy
- Trend Following Strategy Based on Moving Average Combination
- Average Line Breakthrough Strategy
- Polynomial Trailing Stop Strategy
- SPY RSI Stochastics Crossover Reversal Trend Strategy
- All about the ATR and EMA based trend following strategy
- The momentum breakout strategy
- Marubozu Candle Range Balance Strategy
- Quadruple Crossing Strategy
- Reversal Bollinger Band RSI MACD Quant Strategy
- RSI Moving Average Double Cross Oscillation Strategy
- Crossing Moving Average RR Strategy
- DCA Strategy with Trailing Take Profit
- SuperTrend Bollinger Bands Dual Moving Average Trading Strategy
- Moving Average Crossover Trading Strategy
- SMA System Trend Following Strategy