EMA Dual Moving Average Crossover Trend Following Strategy
Author: ChaoZhang, Date: 2024-03-29 16:44:34Tags:

Overview
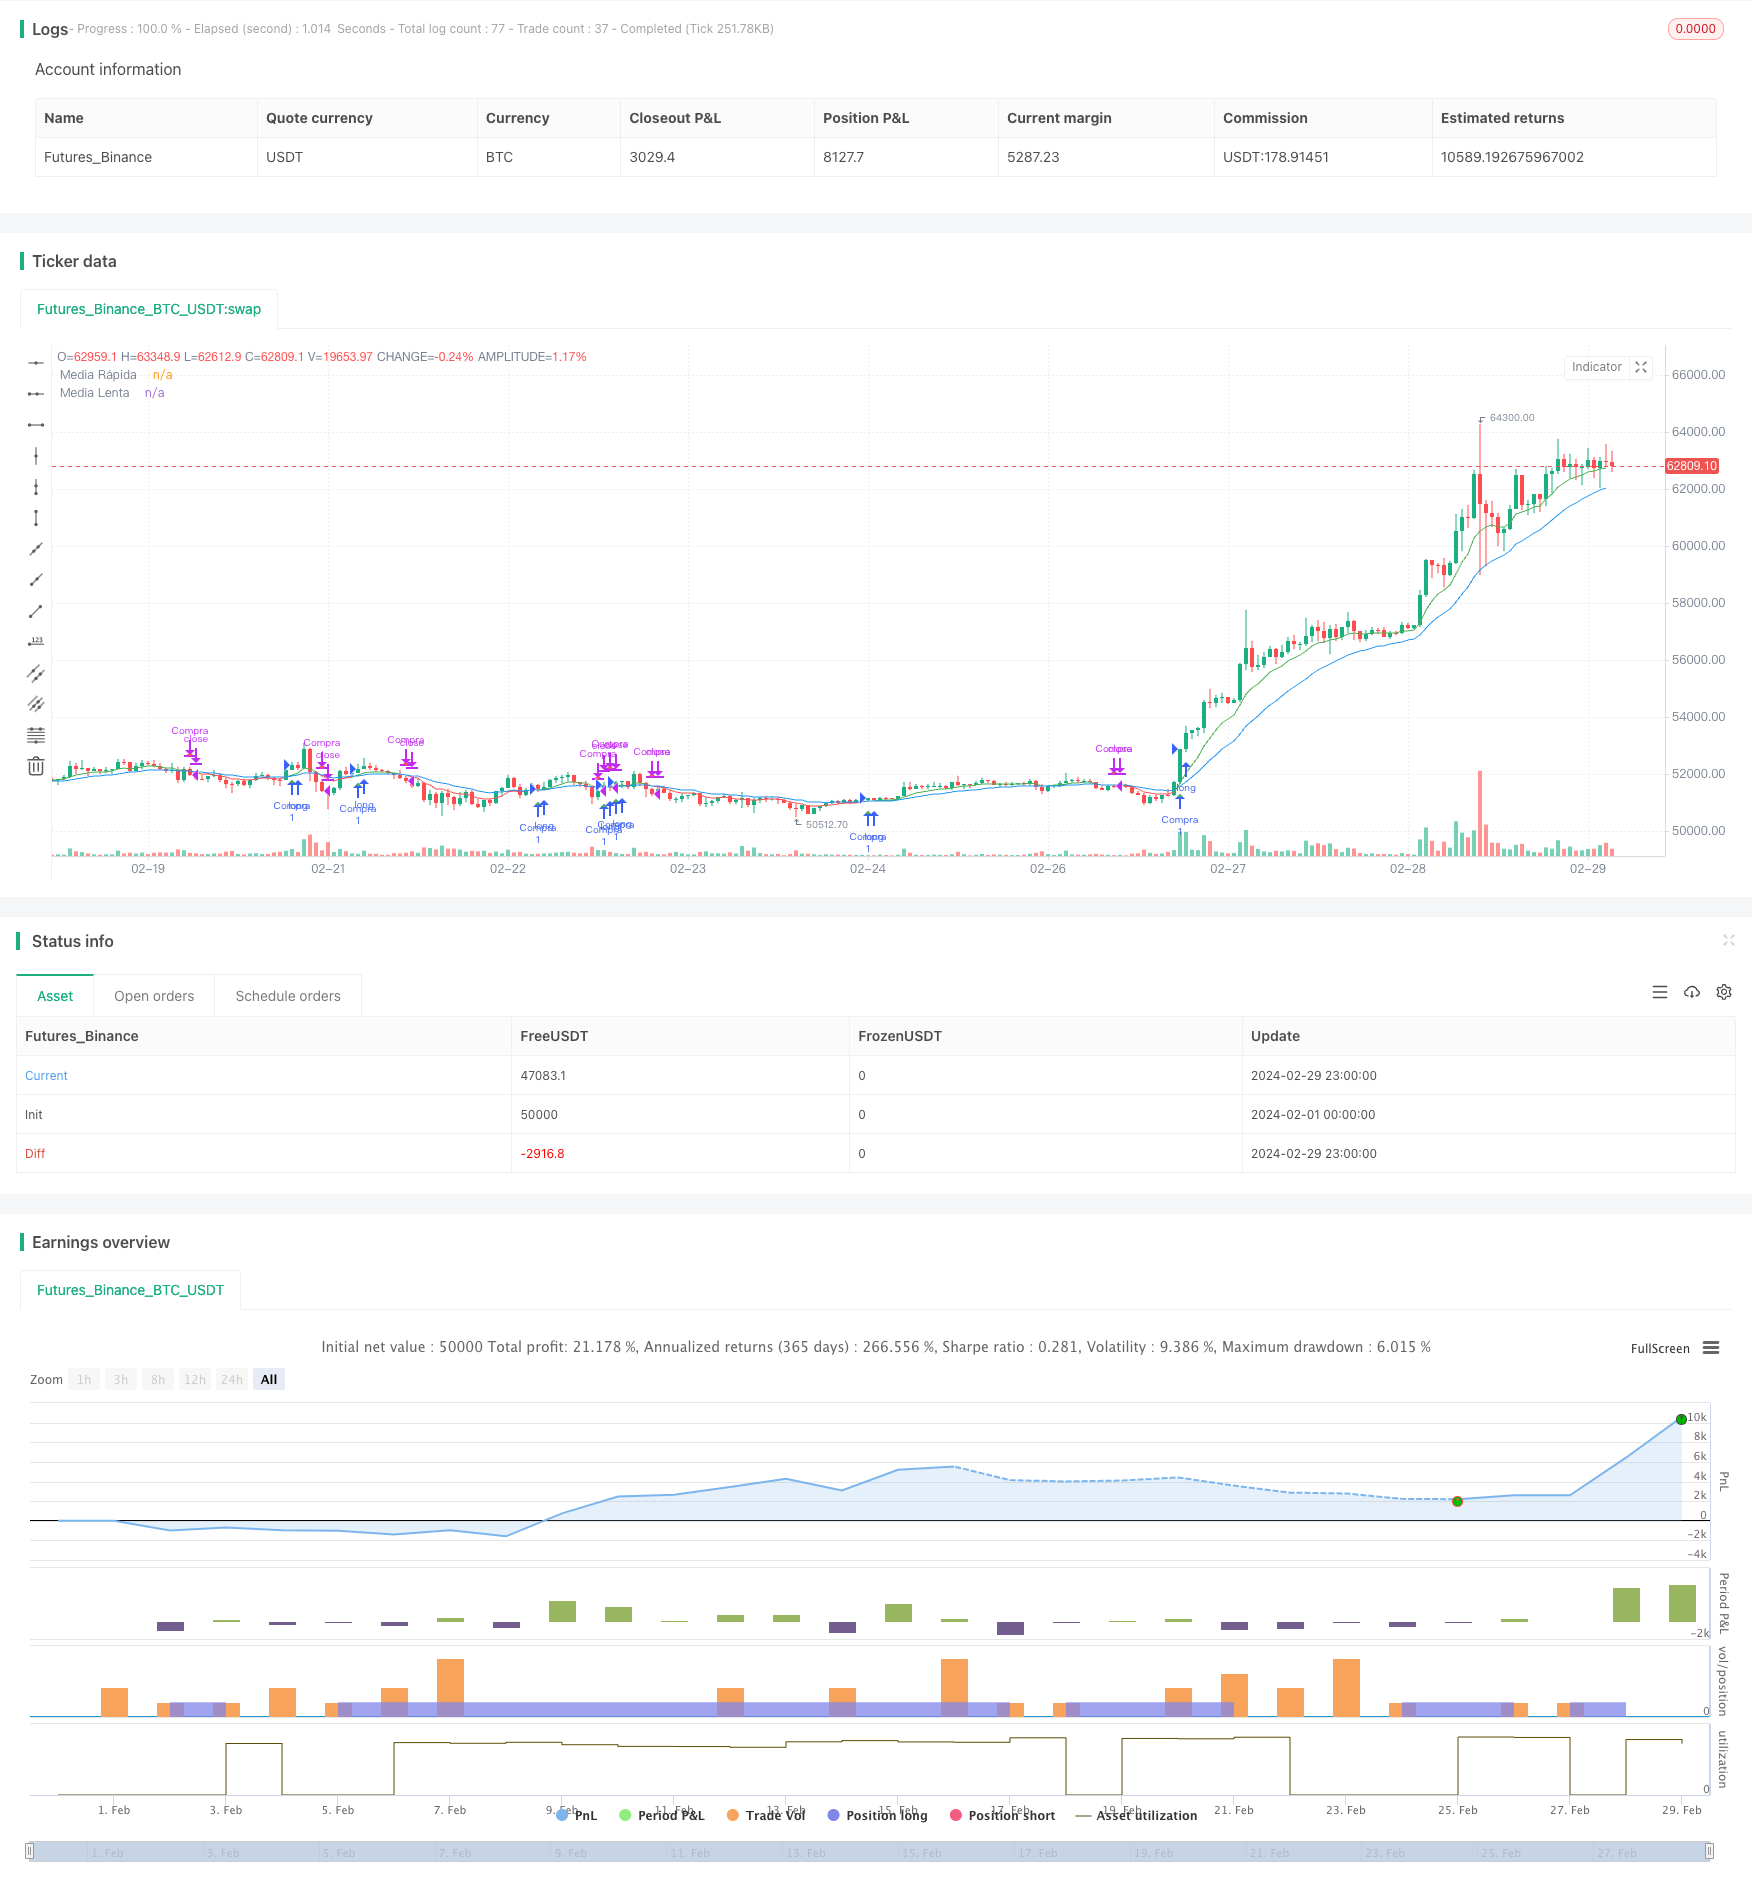
This strategy combines the concepts of trend trading and moving average crossovers, utilizing two exponential moving averages (EMAs) with different lengths to determine market trends. A buy signal is generated when the fast EMA crosses above the slow EMA, while a sell signal is triggered when the fast EMA crosses below the slow EMA. Additionally, the strategy includes arrow indicators and alert functionality to help traders capture trading opportunities in real-time.
Strategy Principle
The core of this strategy is to use two EMAs with different lengths to identify market trends. EMAs react more sensitively to price changes compared to simple moving averages (SMAs), allowing them to reflect trend changes more promptly. When the fast EMA crosses above the slow EMA, it indicates an uptrend and generates a buy signal; conversely, when the fast EMA crosses below the slow EMA, it signifies a downtrend and produces a sell signal. The strategy also plots arrow indicators to visually display buy and sell signals and sets alert conditions to notify traders for timely actions.
Strategy Advantages
Trend Following: By utilizing the crossover of fast and slow EMAs, the strategy effectively captures market trends and follows the momentum.
High Sensitivity: Compared to SMAs, EMAs are more responsive to price changes, enabling quicker identification of trend shifts.
Intuitive and Clear: The inclusion of arrow indicators and alerts makes trading signals more intuitive, helping traders seize trading opportunities in real-time.
Flexible Parameters: The lengths of the fast and slow EMAs can be adjusted based on market characteristics and trader preferences, providing flexibility.
Strategy Risks
Frequent Trading: If the market is highly volatile, frequent crossovers of the fast and slow EMAs may lead to excessive trading signals, increasing transaction costs.
Lag Risk: Although EMAs are relatively sensitive, they still have a certain degree of lag, potentially missing the optimal entry points.
Ineffectiveness in Rangebound Markets: In rangebound markets where trends are not well-defined, crossovers of fast and slow EMAs may generate false signals.
Difficulty in Parameter Optimization: Selecting the appropriate lengths for the fast and slow EMAs requires continuous adjustments based on market characteristics, making optimization challenging.
Strategy Optimization Directions
Incorporate Trend Confirmation Indicators: Add trend confirmation indicators such as ADX to help assess trend strength and filter out false signals in rangebound markets.
Combine with Other Technical Indicators: Integrate other indicators like RSI or MACD to provide additional decision-making support and improve signal accuracy.
Optimize Parameter Selection: Fine-tune the lengths of the fast and slow EMAs based on different markets and timeframes to enhance trend-capturing capabilities.
Implement Stop Loss and Take Profit: Set reasonable stop loss and take profit levels to manage risk on individual trades and enhance strategy stability.
Summary
This strategy utilizes the crossover of fast and slow EMAs to identify trends, offering advantages such as trend following, sensitivity, and clarity. However, it also faces risks like frequent trading, lag, and ineffectiveness in rangebound markets. Future improvements can be made by incorporating additional technical indicators, optimizing parameter selection, and implementing stop loss and take profit levels to enhance the strategy’s stability and profitability.
/*backtest
start: 2024-02-01 00:00:00
end: 2024-02-29 23:59:59
period: 1h
basePeriod: 15m
exchanges: [{"eid":"Futures_Binance","currency":"BTC_USDT"}]
*/

//@version=5
strategy("Trend Trader by Marcus Flechas y Alertas", overlay=true)

// Parámetros de las medias móviles
longitudRapida = input(9, "Longitud Media Rápida")
longitudLenta = input(21, "Longitud Media Lenta")

// Cálculo de las medias móviles
mediaRapida = ta.ema(close, longitudRapida)
mediaLenta = ta.ema(close, longitudLenta)

// Condición de compra (cruce al alza)
comprar = ta.crossover(mediaRapida, mediaLenta)

// Condición de venta (cruce a la baja)
vender = ta.crossunder(mediaRapida, mediaLenta)

// Dibujando las flechas para las señales
plotshape(comprar, title="Compra", location=location.belowbar, color=color.green, style=shape.triangleup, size=size.small)
plotshape(vender, title="Venta", location=location.abovebar, color=color.red, style=shape.triangledown, size=size.small)

// Colores del Trend Trader Indicator (opcional)
colorTendencia = mediaRapida > mediaLenta ? color.green : color.red
plot(mediaRapida, color=colorTendencia, title="Media Rápida")
plot(mediaLenta, color=color.blue, title="Media Lenta")

// Implementando la estrategia
strategy.entry("Compra", strategy.long, when=comprar)
strategy.close("Compra", when=vender)

// Condiciones de alerta
alertcondition(comprar, title="Alerta de Compra", message="Señal de Compra activada")
alertcondition(vender, title="Alerta de Venta", message="Señal de Venta activada")
- Multi-indicator BTC Trading Strategy
- TD Sequential Breakout and Retracement Buy/Sell Strategy
- SMA Crossover Compounding Strategy
- Volatility Trend Following Strategy
- Dual Moving Average and RSI-Based Short-Term Scalable Trend Following Strategy
- Dual Range Filter Momentum Trading Strategy
- VWAP Moving Average Crossover with Dynamic ATR Stop Loss and Take Profit Strategy
- Time Series Adaptive Dynamic Threshold Strategy Based on Equity Data
- Asian Session High Low Breakout Strategy
- Marcus' Trend Trader with Arrows and Alerts Strategy
- Moving Average Crossover Strategy
- RSI Momentum Strategy with Manual TP and SL
- EMA RSI Trend-Following and Momentum Strategy
- Gaussian Channel Trend Following Strategy
- High-Frequency Trading Strategy Combining Bollinger Bands and DCA
- Modified Relative Strength Index Trend Following Strategy
- Intraday Bullish Breakout Strategy
- EMA-MACD-SuperTrend-ADX-ATR Multi-Indicator Trading Signal Strategy
- Trend-Following Variable Position Grid Strategy
- Supertrend and Bollinger Bands Combination Strategy