Dual Moving Average and RSI-Based Short-Term Scalable Trend Following Strategy
Author: ChaoZhang, Date: 2024-04-01 10:58:30Tags:

Overview
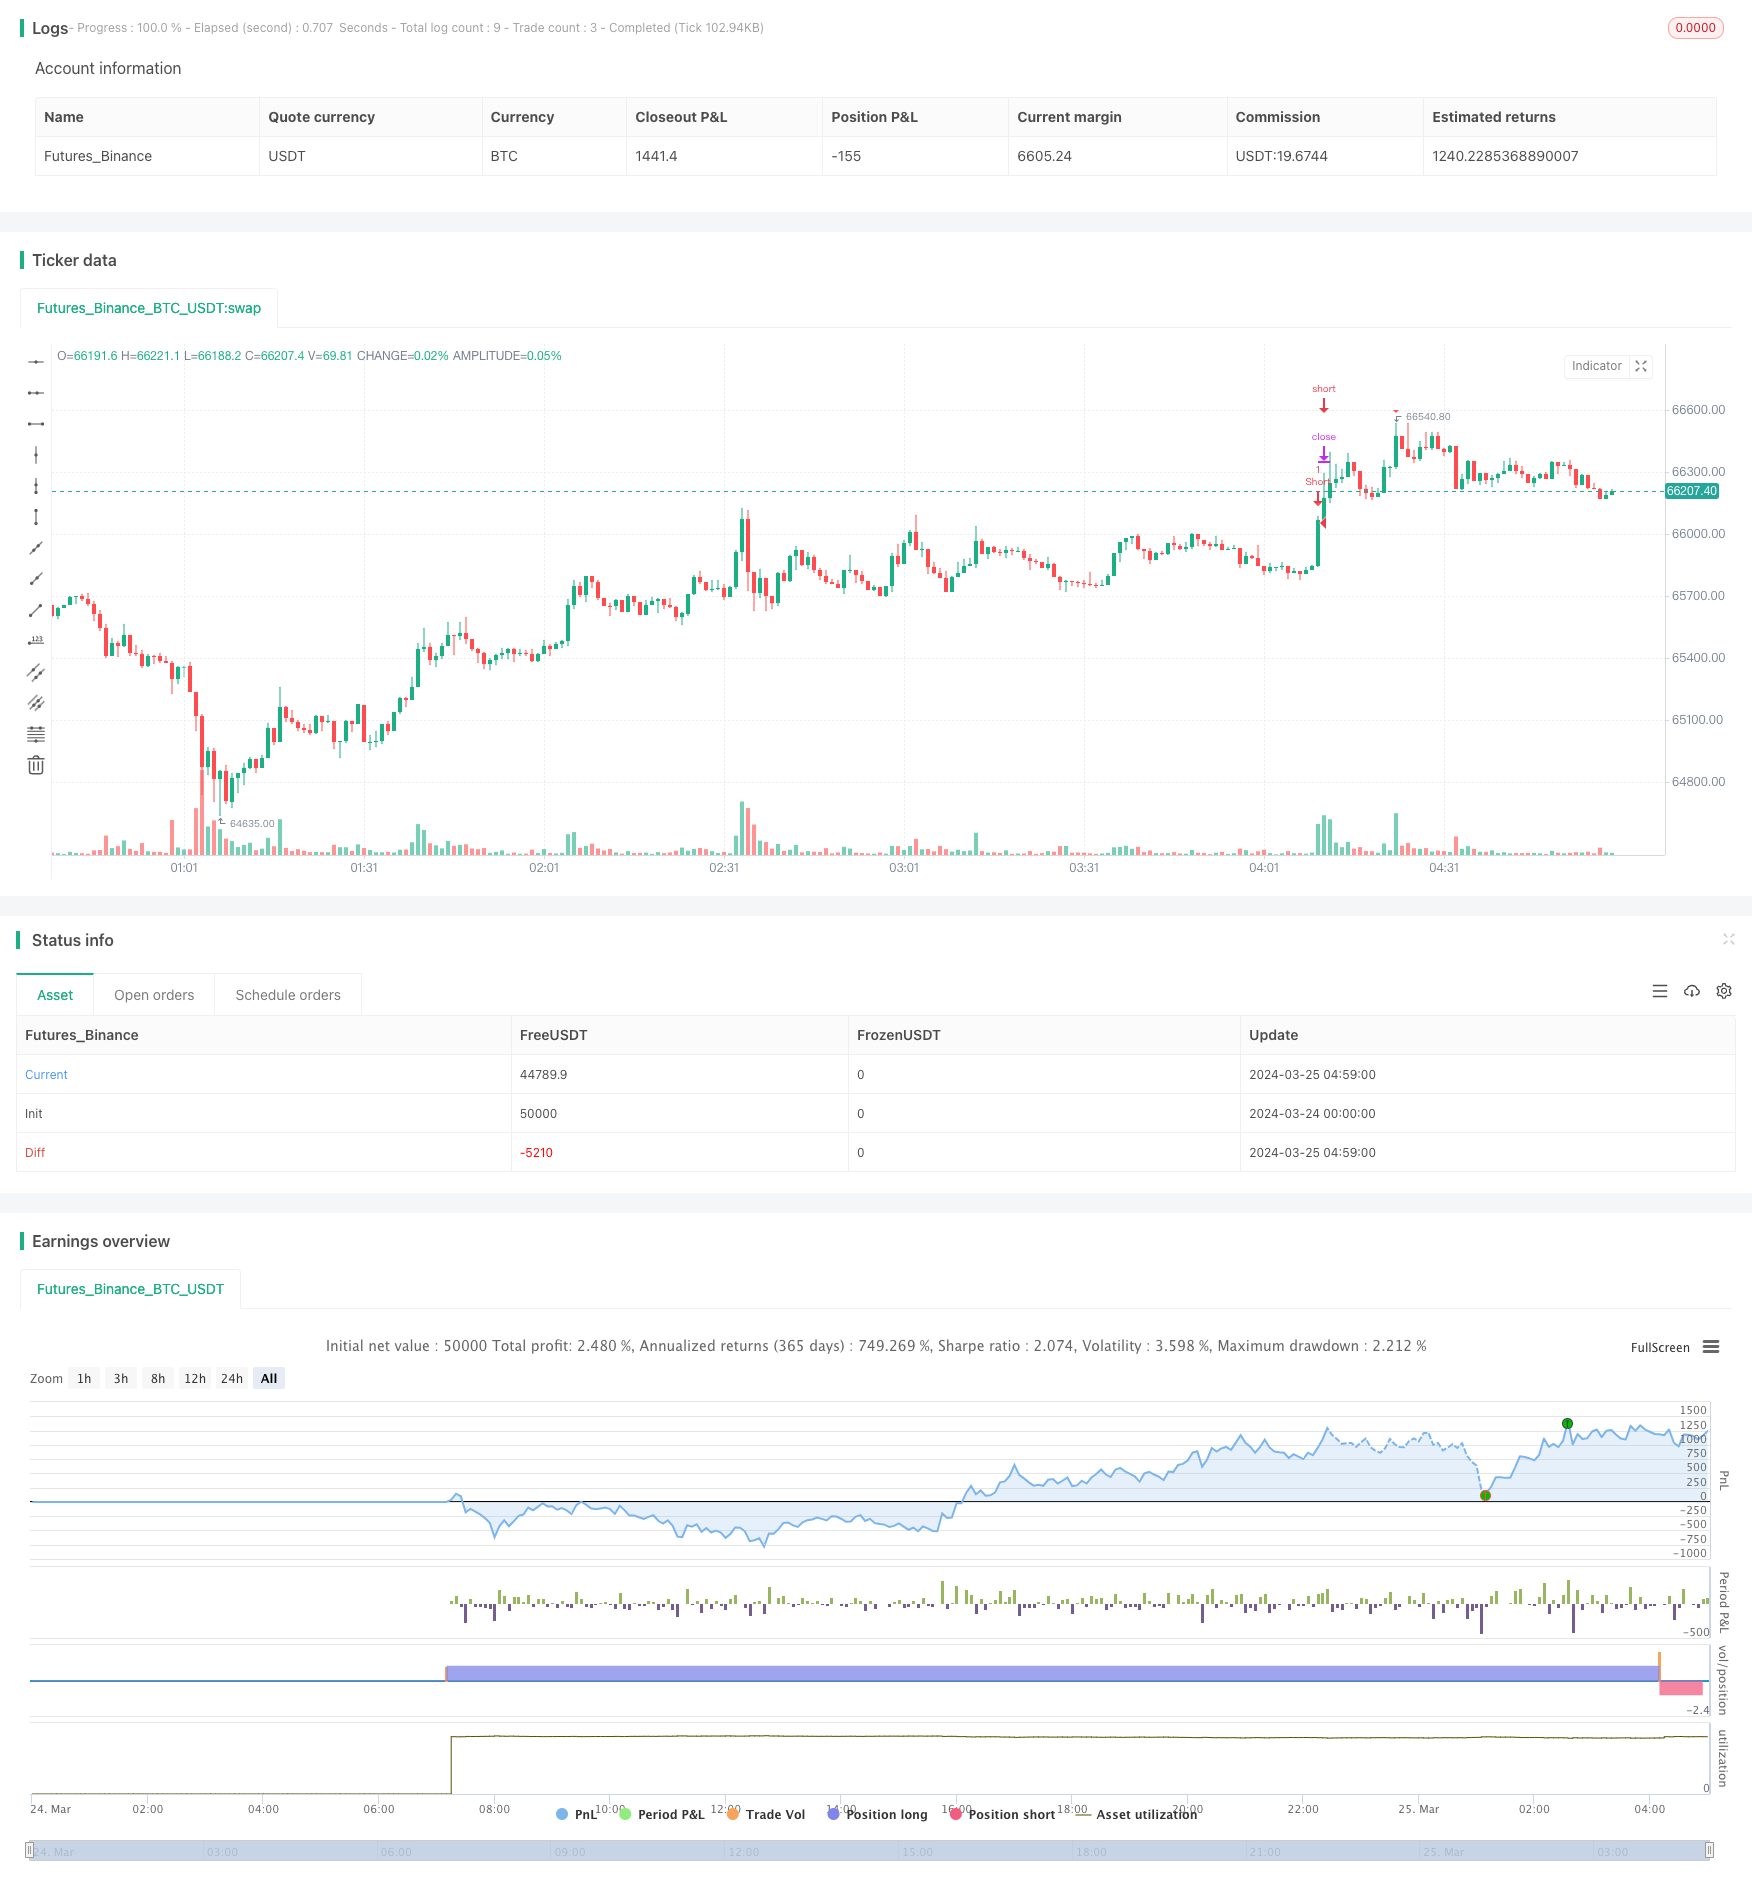
This strategy uses two moving averages (a fast moving average and a slow moving average) and the Relative Strength Index (RSI) to identify short-term market trends and overbought/oversold conditions. When the fast moving average crosses above the slow moving average and the RSI is below the oversold level, the strategy enters a long position. When the fast moving average crosses below the slow moving average and the RSI is above the overbought level, the strategy enters a short position. The strategy determines entry and exit points based on the crossover of the moving averages and RSI levels to capture short-term price trends.
Strategy Principles
- Calculate the fast moving average (default period of 5) and the slow moving average (default period of 10).
- Calculate the Relative Strength Index (RSI) with a default period of 7 and set the overbought and oversold levels (default values of 80 and 20, respectively).
- Enter a long position when the fast moving average crosses above the slow moving average and the RSI is below the oversold level.
- Enter a short position when the fast moving average crosses below the slow moving average and the RSI is above the overbought level.
- Close the position when the fast moving average crosses the slow moving average again or when the RSI exceeds the opposite overbought/oversold level.
Strategy Advantages
- Combines two indicators, moving averages and RSI, to improve signal reliability and accuracy.
- Suitable for short-term trading in volatile markets by capturing short-term trends.
- Adjustable parameters provide flexibility and adaptability to different market conditions and trading styles.
- Clear and easy-to-understand logic, making it simple to implement.
Strategy Risks
- In choppy markets, frequent crossover signals may lead to excessive trading and commission costs.
- The duration of short-term trends may be limited, resulting in limited profit potential.
- Weak ability to capture long-term trends, potentially missing out on profits from major trends.
- Improper parameter settings may lead to ineffective or false signals.
Strategy Optimization Directions
- Incorporate additional technical indicators or price action patterns, such as MACD or Bollinger Bands, to improve signal reliability and filtering.
- Optimize parameter selection based on different market characteristics and trading instruments, adjusting the periods of moving averages and RSI overbought/oversold levels accordingly.
- Implement stop-loss and take-profit mechanisms to control risk exposure and profit expectations for each trade.
- Combine multiple timeframe analysis, such as identifying the major trend on the daily timeframe and executing actual trades on hourly or minute timeframes, to improve trend-capturing accuracy.
- Consider incorporating position sizing and money management strategies, such as dynamically adjusting the position size for each trade based on market volatility and personal risk preferences.
Summary
This strategy combines dual moving averages and the RSI indicator to capture short-term price trends, making it suitable for short-term trading in volatile markets. The strategy logic is clear, parameters are flexible, and it is easy to implement and optimize. However, it may generate excessive trading signals in choppy markets and has a weak ability to capture long-term trends. Therefore, in practical applications, consider introducing additional indicators, optimizing parameter selection, implementing risk management measures, and other approaches to improve the strategy’s robustness and profitability.
/*backtest
start: 2024-03-24 00:00:00
end: 2024-03-25 05:00:00
period: 1m
basePeriod: 1m
exchanges: [{"eid":"Futures_Binance","currency":"BTC_USDT"}]
*/

//@version=5
strategy("Short-Term Scalp Trading Strategy", overlay=true)

// Define strategy parameters
fastMA_length = input(5, title="Fast MA Length")
slowMA_length = input(10, title="Slow MA Length")
rsi_length = input(7, title="RSI Length")
rsi_oversold = input(20, title="RSI Oversold Level")
rsi_overbought = input(80, title="RSI Overbought Level")

// Calculate Moving Averages
fastMA = ta.sma(close, fastMA_length)
slowMA = ta.sma(close, slowMA_length)

// Calculate RSI
rsi = ta.rsi(close, rsi_length)

// Define entry conditions
longCondition = ta.crossunder(fastMA, slowMA) and rsi < rsi_oversold
shortCondition = ta.crossover(fastMA, slowMA) and rsi > rsi_overbought

// Enter long position
strategy.entry("Long", strategy.long, when=longCondition)

// Enter short position
strategy.entry("Short", strategy.short, when=shortCondition)

// Define exit conditions
longExitCondition = ta.crossunder(fastMA, slowMA) or ta.crossover(rsi, rsi_overbought)
shortExitCondition = ta.crossover(fastMA, slowMA) or ta.crossunder(rsi, rsi_oversold)

// Exit long position
if (longExitCondition)
    strategy.close("Exit Long", "Long")

// Exit short position
if (shortExitCondition)
    strategy.close("Exit Short", "Short")

// Plot buy and sell signals
plotshape(series=longCondition, title="Buy Signal", location=location.belowbar, color=color.green, style=shape.triangleup, size=size.small)
plotshape(series=shortCondition, title="Sell Signal", location=location.abovebar, color=color.red, style=shape.triangledown, size=size.small)
- Ruda Momentum Trend Trading Strategy
- Dual Moving Average Crossover Strategy
- Modified Bollinger Bands Strategy
- Dynamic Threshold Price Change Breakout Strategy
- Dual Moving Average Lagging Breakout Strategy
- Momentum Trading with Dual Moving Average Crossover Strategy
- Multi-indicator BTC Trading Strategy
- TD Sequential Breakout and Retracement Buy/Sell Strategy
- SMA Crossover Compounding Strategy
- Volatility Trend Following Strategy
- Dual Range Filter Momentum Trading Strategy
- VWAP Moving Average Crossover with Dynamic ATR Stop Loss and Take Profit Strategy
- Time Series Adaptive Dynamic Threshold Strategy Based on Equity Data
- Asian Session High Low Breakout Strategy
- Marcus' Trend Trader with Arrows and Alerts Strategy
- EMA Dual Moving Average Crossover Trend Following Strategy
- Moving Average Crossover Strategy
- RSI Momentum Strategy with Manual TP and SL
- EMA RSI Trend-Following and Momentum Strategy
- Gaussian Channel Trend Following Strategy