Overview
The Technical Support and Resistance Indicator Precision Trading Strategy is a comprehensive trading approach designed for the TradingView platform. This strategy leverages key technical indicators to identify support and resistance levels, generate potential buy and sell signals, and incorporate Bollinger Bands for additional market context. The approach aims to provide traders with a data-driven, disciplined trading system to capitalize on well-defined trading opportunities in financial markets.
At its core, the strategy focuses on identifying key price levels and price action patterns in the market. By calculating the highest highs and lowest lows over a 20-period lookback, the strategy establishes potential support and resistance levels. Signals are generated when price breaks through these key levels. The inclusion of Bollinger Bands further enhances the strategy’s analytical depth, providing insights into market volatility and potential reversal points.
Strategy Principles
Support and Resistance Identification:
- Uses 20-period highest highs and lowest lows to determine key price levels.
- These levels are viewed as potential support (lows) and resistance (highs) points.
Signal Generation:
- Buy signal: Triggered when the closing price is above the opening price and breaks above the previous period’s high.
- Sell signal: Triggered when the closing price is below the opening price and breaks below the previous period’s low.
Bollinger Bands Analysis:
- Uses a 20-period Simple Moving Average (SMA) as the middle band.
- Upper and lower bands are set at two standard deviations above and below the middle band.
- Bollinger Bands provide additional information on market volatility and potential reversal points.
Trade Execution:
- The strategy enters a long position when a buy signal occurs.
- It enters a short position when a sell signal occurs.
Strategy Advantages
Multi-dimensional Analysis: Combines support/resistance, price action, and Bollinger Bands for a comprehensive market perspective.
Objectivity: Based on clear technical indicators and rules, reducing bias from subjective judgment.
Adaptability: Can be applied to various financial instruments and timeframes, offering wide applicability.
Risk Management: Helps set reasonable stop-loss levels by identifying key price levels.
Trend Following: Capable of capturing potential trend movements after price breakouts.
Volatility Consideration: The use of Bollinger Bands helps adjust the strategy under different market conditions.
Automation Potential: Clear strategy logic makes it easy to implement automated trading.
Strategy Risks
False Breakouts: The market may exhibit false breakouts, leading to incorrect trading signals. Solution: Consider adding confirmation indicators or delaying entry to validate breakout validity.
Overtrading: May generate too many trading signals in ranging markets. Solution: Introduce trend filters or set trading frequency limits.
Slippage Risk: In fast markets, actual execution prices may differ significantly from signal prices. Solution: Use limit orders instead of market orders and consider setting maximum acceptable slippage.
Parameter Sensitivity: Strategy performance may be highly sensitive to parameter choices (e.g., lookback period). Solution: Conduct extensive backtesting and parameter optimization, consider using adaptive parameters.
Changing Market Conditions: The strategy may underperform in certain market conditions. Solution: Develop market state recognition mechanisms to adjust strategy parameters or pause trading under different conditions.
Strategy Optimization Directions
Dynamic Support and Resistance: Consider using adaptive algorithms to dynamically adjust the calculation period for support and resistance levels to better adapt to different market conditions.
Quantitative Confirmation Indicators: Introduce additional technical indicators (such as RSI or MACD) to confirm trading signals and improve strategy accuracy.
Risk Management Optimization: Implement dynamic stop-loss and profit targets, adjusting based on market volatility and Bollinger Band width.
Market State Classification: Develop a market state recognition system to adjust strategy parameters in different market environments (e.g., trending, ranging, high volatility).
Time Filtering: Consider market timing factors to avoid trading during low volatility or unfavorable trading sessions.
Machine Learning Integration: Utilize machine learning algorithms to optimize parameter selection and signal generation processes, enhancing strategy adaptability.
Multi-timeframe Analysis: Integrate data from multiple timeframes to provide a more comprehensive market context and more reliable trading signals.
Conclusion
The Technical Support and Resistance Indicator Precision Trading Strategy offers a comprehensive and flexible trading framework suitable for various market environments. By combining support and resistance levels, price action analysis, and Bollinger Bands indicators, the strategy is capable of capturing potentially high-probability trading opportunities. However, like all trading strategies, it also faces inherent risks and challenges.
Successful implementation of the strategy requires careful parameter optimization, continuous market adaptability adjustments, and robust risk management measures. Through ongoing improvements and optimizations, such as introducing dynamic parameter adjustments, multiple confirmation mechanisms, and advanced market state analysis, the strategy has the potential to become a powerful trading tool.
Ultimately, traders should remember that there is no perfect strategy, and continuous learning, adaptation, and risk management are key to long-term success. The Technical Support and Resistance Indicator Precision Trading Strategy provides traders with a solid foundation, but its true value lies in how individual traders customize and apply it according to their specific needs and market insights.
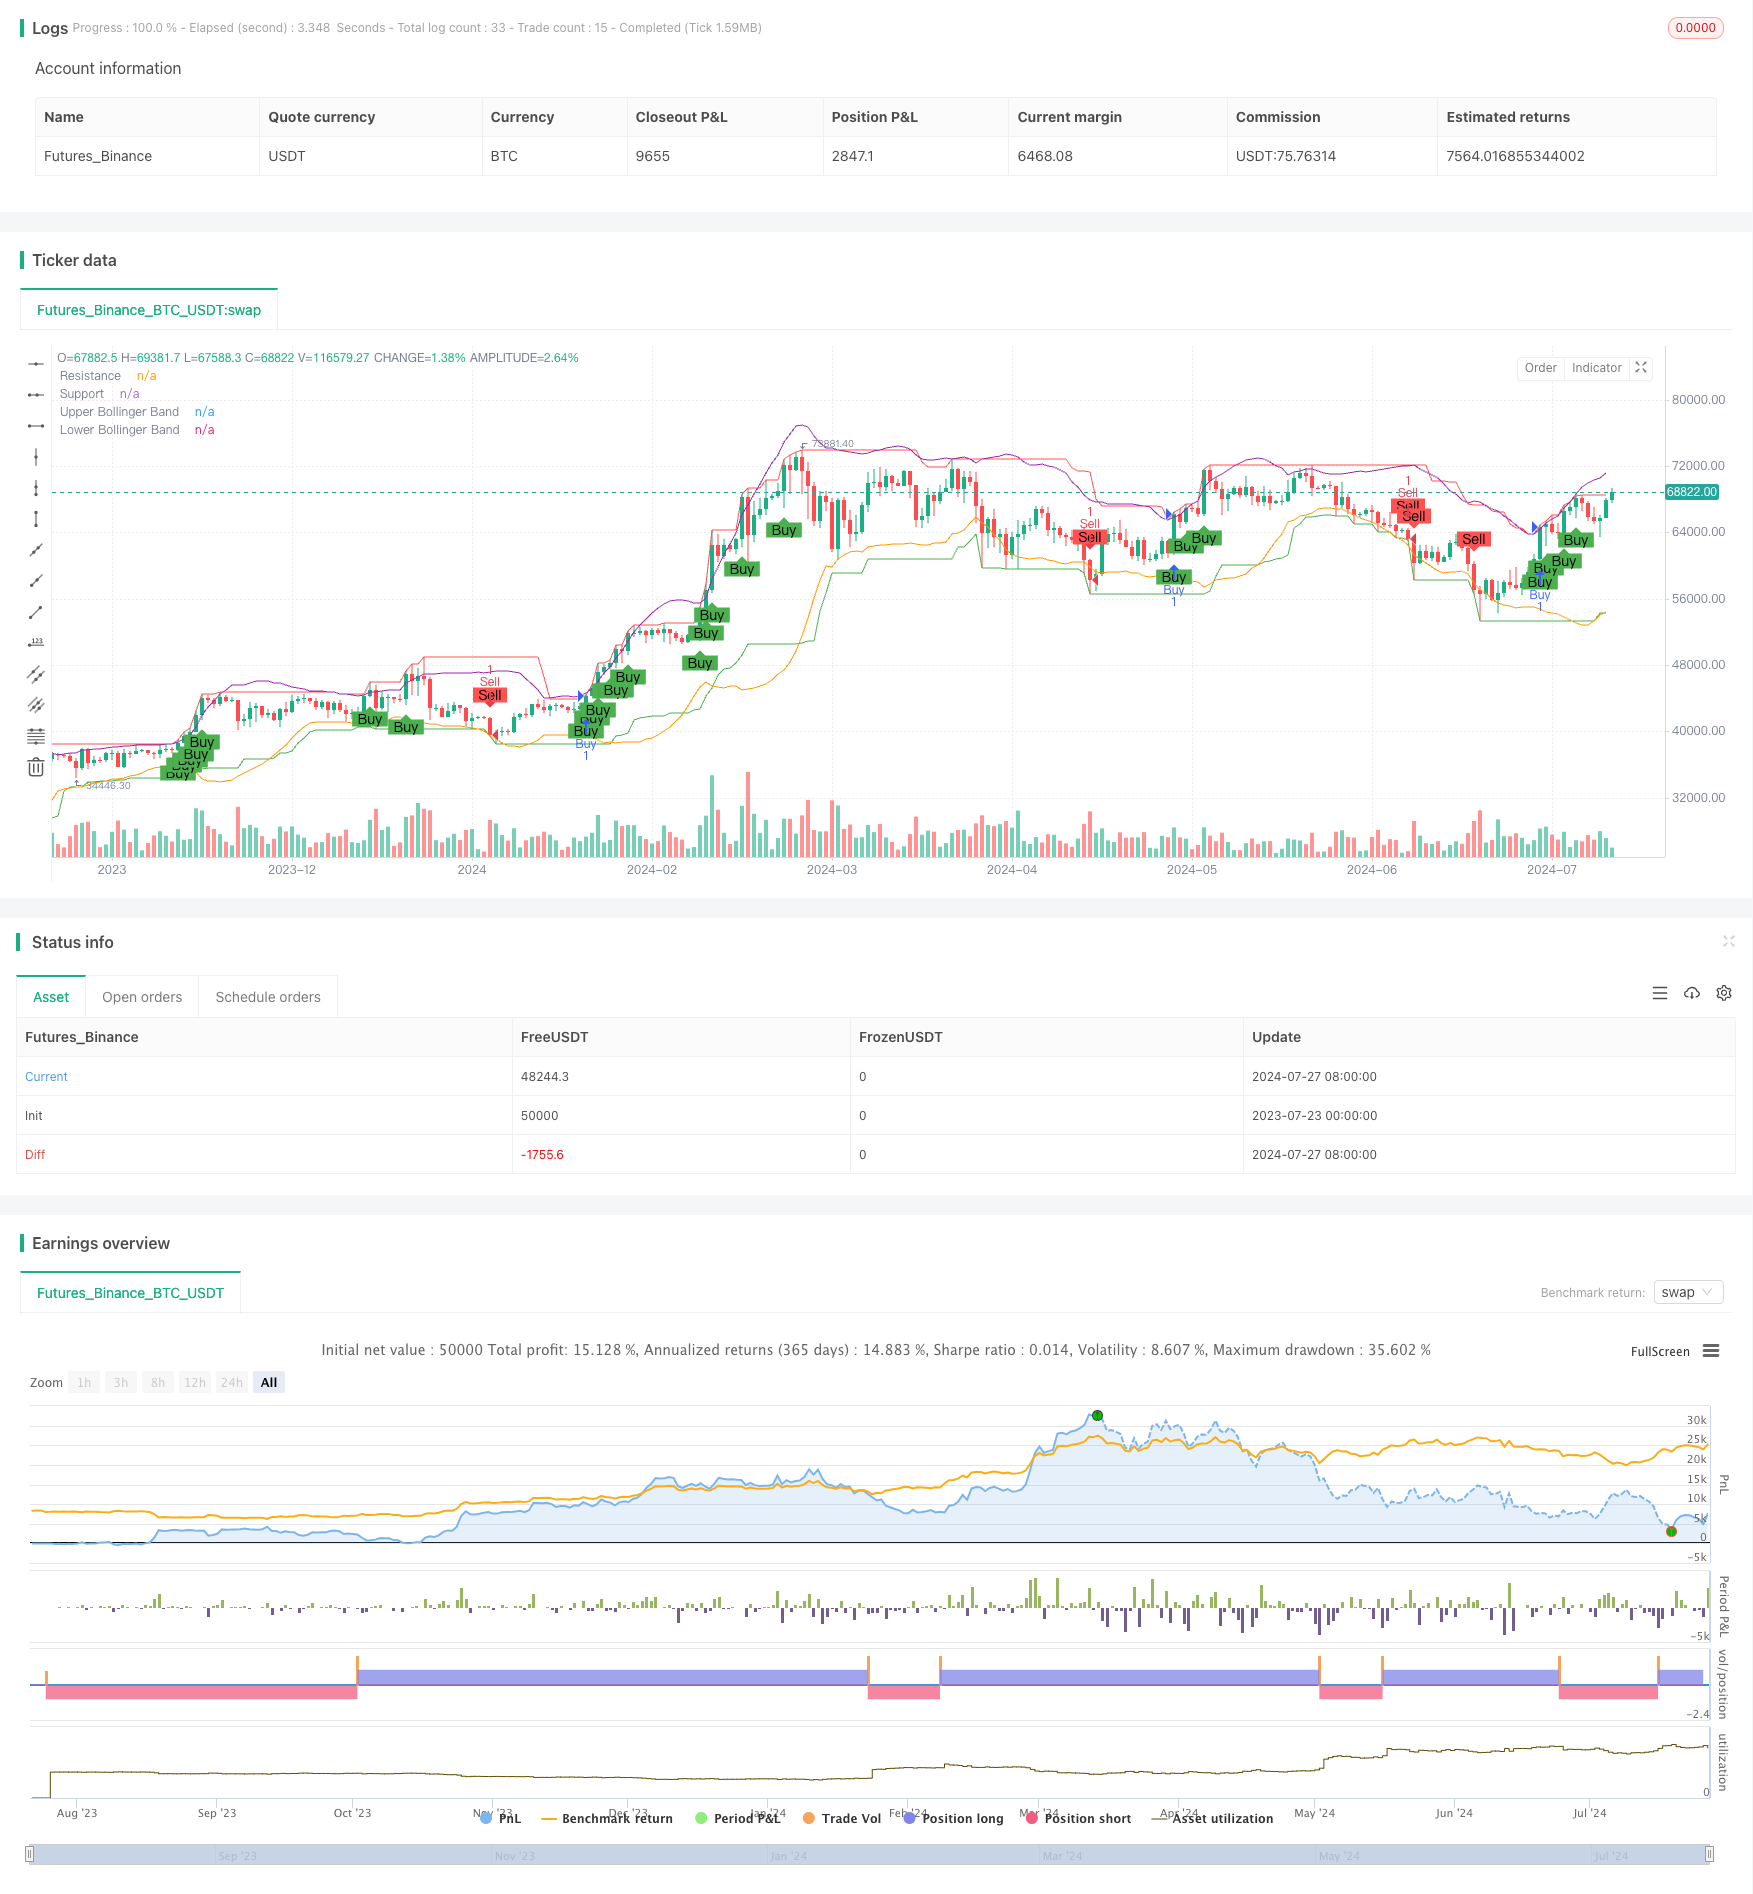
/*backtest
start: 2023-07-23 00:00:00
end: 2024-07-28 00:00:00
period: 1d
basePeriod: 1h
exchanges: [{"eid":"Futures_Binance","currency":"BTC_USDT"}]
*/

//@version=5
strategy("Mars Signals: Precision Trading", overlay=true)

// Calculate the highest highs and lowest lows for support and resistance points
float highMax = ta.highest(high, 20)
float lowMin = ta.lowest(low, 20)

// Draw support and resistance lines
plot(highMax, "Resistance", color=color.red)
plot(lowMin, "Support", color=color.green)

// Identify price action patterns for deciding on buying or selling
bool buySignal = close > open and close > highMax[1]
bool sellSignal = close < open and close < lowMin[1]

// Plot buy and sell signals
plotshape(series=buySignal, location=location.belowbar, color=color.green, style=shape.labelup, text="Buy")
plotshape(series=sellSignal, location=location.abovebar, color=color.red, style=shape.labeldown, text="Sell")

// Display Bollinger Bands for further analysis
float basis = ta.sma(close, 20)
float dev = ta.stdev(close, 20)
float upperBB = basis + 2 * dev
float lowerBB = basis - 2 * dev
plot(upperBB, "Upper Bollinger Band", color=color.purple)
plot(lowerBB, "Lower Bollinger Band", color=color.orange)

// Use strategy function for entering and exiting trades
if (buySignal)
    strategy.entry("Buy", strategy.long)
if (sellSignal)
    strategy.entry("Sell", strategy.short)