概述
这个策略是一个结合了多个技术指标的趋势跟踪系统,主要利用超级趋势指标(SuperTrend)和200周期指数移动平均线(EMA)来识别市场趋势并进行交易。该策略还incorporates了止损(SL)和止盈(TP)机制来管理风险和锁定利润。这是一个只做多的策略,旨在捕捉上升趋势并在下降趋势中保护资金。
策略原理
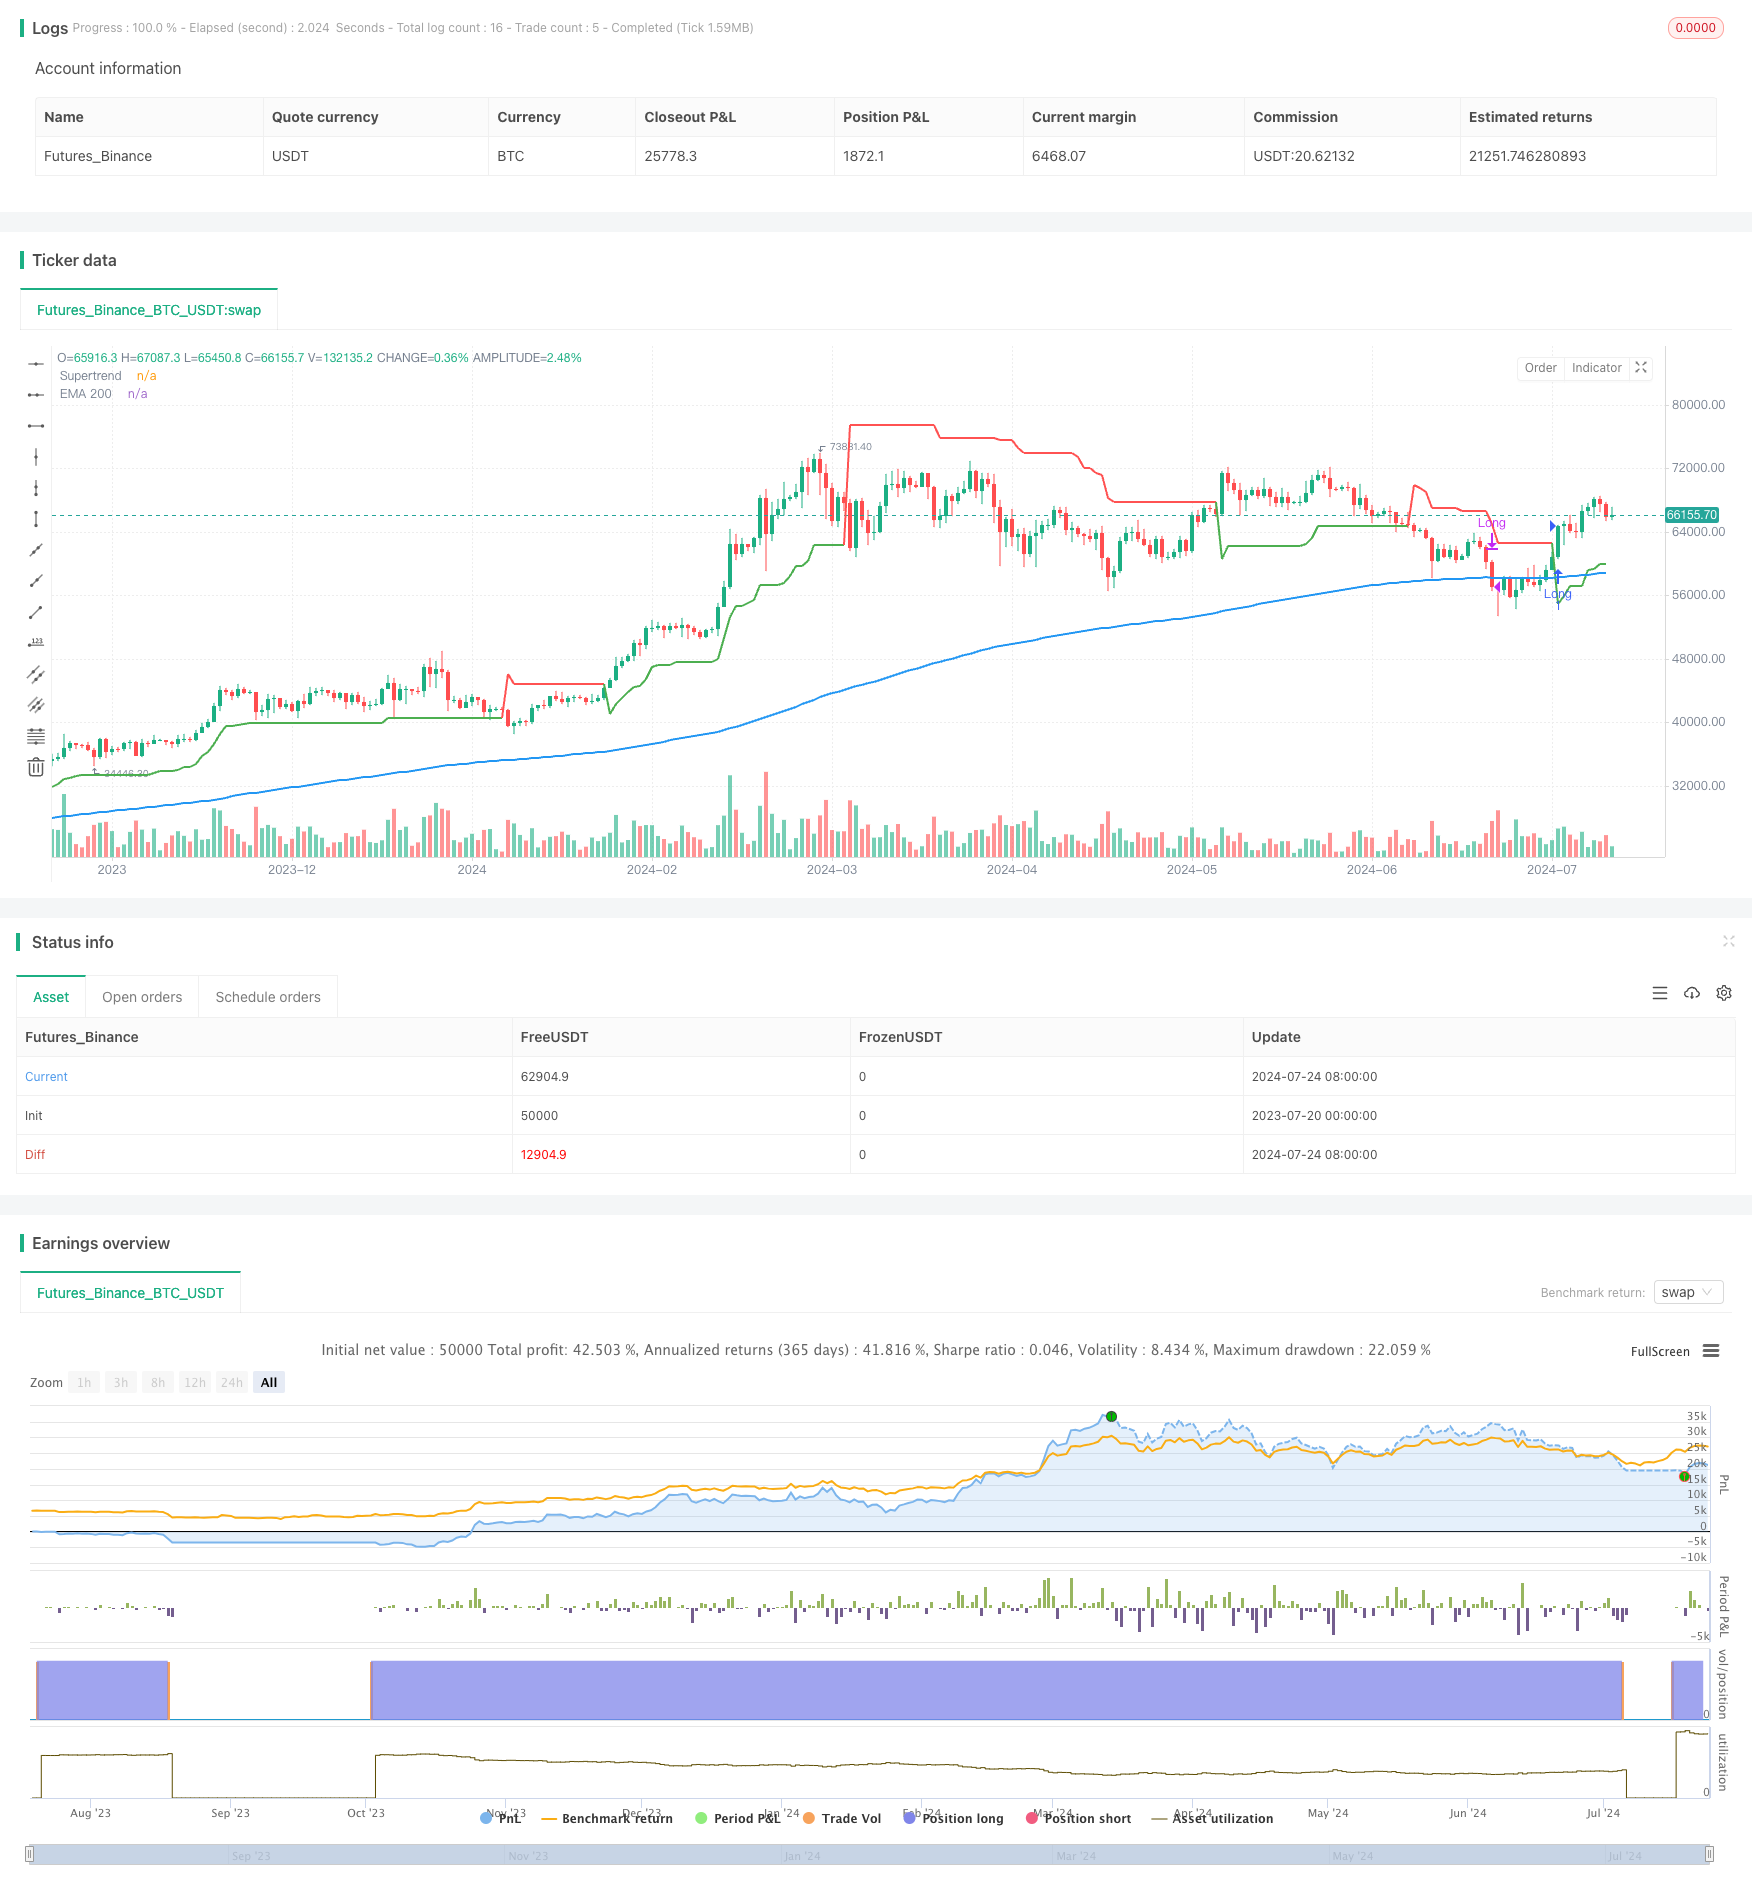
超级趋势指标: 使用ATR(平均真实范围)的10个周期和3.0的因子来计算。这个指标用于确定市场的总体趋势方向。
200周期EMA: 作为一个长期趋势指标,用于确认市场的整体方向。
入场条件: 当超级趋势指标转为上升(绿色)且价格在200EMA之上时,策略会开仓做多。
出场条件: 当超级趋势指标转为下降(红色)且价格跌破200EMA时,策略会平仓。
风险管理: 策略使用基于百分比的止损和止盈。止损设置为入场价格的1%下方,止盈设置为入场价格的5%上方。
策略优势
多重确认: 通过结合超级趋势和200EMA,策略能够更准确地识别强劲的上升趋势,减少假突破带来的损失。
趋势跟踪: 策略设计用于捕捉中长期趋势,有潜力获得大幅度的收益。
风险管理: 内置的止损和止盈机制有助于控制每笔交易的风险,并在市场逆转时保护利润。
只做多策略: 通过只在上升趋势中交易,策略避免了做空带来的额外风险和成本。
简单明了: 策略逻辑清晰,易于理解和实施,适合各级别的交易者。
策略风险
滞后性: EMA和超级趋势都是滞后指标,可能在趋势反转初期错过一些机会或遭受一些损失。
震荡市场: 在横盘或者震荡市场中,策略可能会频繁进出,导致过多的交易成本。
固定止损: 1%的固定止损可能在某些波动较大的市场中不够灵活,可能导致过早被触发。
只做多限制: 在熊市或长期下跌趋势中,策略可能会长期处于观望状态,错过潜在的做空机会。
参数敏感性: 策略的性能可能对超级趋势和EMA的参数设置较为敏感,需要仔细优化。
策略优化方向
动态止损: 可以考虑使用跟踪止损或基于ATR的动态止损,以更好地适应市场波动。
入场优化: 可以添加额外的过滤条件,如成交量确认或其他动量指标,以减少假突破。
参数优化: 对超级趋势的ATR周期和因子,以及EMA的周期进行回测和优化,以找到最佳组合。
增加时间框架分析: 考虑在多个时间框架上应用策略,以获得更全面的市场视角。
加入波动率调整: 根据市场波动率动态调整止损和止盈水平,以适应不同市场环境。
考虑做空: 在合适的市场条件下,可以增加做空逻辑,以充分利用下跌趋势。
资金管理: 实现更复杂的仓位管理系统,根据市场状况和账户规模动态调整交易量。
总结
这个结合超级趋势、EMA 200和风险管理的多重技术指标趋势跟踪策略为交易者提供了一个相对稳健的交易框架。通过利用多个指标的优势,该策略旨在捕捉强劲的上升趋势,同时在市场逆转时保护资金。内置的风险管理机制有助于控制每笔交易的风险,使其适合不同风险偏好的交易者。
然而,交易者应该意识到策略的局限性,如在震荡市场中的表现可能不佳,以及只做多策略在下跌市场中的局限性。通过持续的优化和调整,如实现动态止损、多时间框架分析和考虑做空等,可以进一步提高策略的鲁棒性和适应性。
总的来说,这个策略为技术分析和趋势跟踪提供了一个良好的起点,但成功的应用还需要交易者的持续监控、优化和市场洞察力。在实盘交易中使用之前,建议进行充分的回测和模拟交易,以确保策略符合个人的交易风格和风险承受能力。
/*backtest
start: 2023-07-20 00:00:00
end: 2024-07-25 00:00:00
period: 1d
basePeriod: 1h
exchanges: [{"eid":"Futures_Binance","currency":"BTC_USDT"}]
*/

//@version=5
strategy("Supertrend + EMA 200 Long Only Strategy with SL and TP", overlay=true)

// Inputs for Supertrend
atr_length = input.int(10, title="ATR Length")
factor = input.float(3.0, title="ATR Factor")

// Input for EMA
ema_length = input.int(200, title="EMA Length")

// Inputs for Stop Loss and Take Profit
stop_loss_perc = input.float(1.0, title="Stop Loss Percentage", step=0.1) / 100
take_profit_perc = input.float(5.0, title="Take Profit Percentage", step=0.1) / 100

// Calculate EMA 200
ema_200 = ta.ema(close, ema_length)

// Calculate Supertrend
atr = ta.atr(atr_length)
upperband = hl2 + (factor * atr)
lowerband = hl2 - (factor * atr)

var float supertrend = na
var int direction = na

// Initialize supertrend on first bar
if (na(supertrend[1]))
    supertrend := lowerband
    direction := 1
else
    // Update supertrend value
    if (direction == 1)
        supertrend := close < supertrend[1] ? upperband : math.max(supertrend[1], lowerband)
    else
        supertrend := close > supertrend[1] ? lowerband : math.min(supertrend[1], upperband)

    // Update direction
    direction := close > supertrend ? 1 : -1

// Buy condition: Supertrend is green and price is above EMA 200
longCondition = direction == 1 and close > ema_200

// Sell condition: Supertrend is red and price is below EMA 200
exitCondition = direction == -1 and close < ema_200

// Plot EMA 200
plot(ema_200, title="EMA 200", color=color.blue, linewidth=2)

// Plot Supertrend
plot(supertrend, title="Supertrend", color=direction == 1 ? color.green : color.red, linewidth=2)

// Calculate stop loss and take profit levels
long_stop_loss = close * (1 - stop_loss_perc)
long_take_profit = close * (1 + take_profit_perc)

// Strategy Entry and Exit
if (longCondition and not na(supertrend))
    strategy.entry("Long", strategy.long, stop=long_stop_loss, limit=long_take_profit)

if (strategy.position_size > 0 and exitCondition)
    strategy.close("Long")