Bollinger Bands Momentum Optimization Strategy
Author: ChaoZhang, Date: 2024-07-29 17:22:38Tags: BBSMAATROCA
Overview
The Bollinger Bands Momentum Optimization Strategy is a quantitative trading approach that combines the Bollinger Bands indicator with momentum concepts. This strategy utilizes the upper and lower bands of the Bollinger Bands as reference points for market volatility, while incorporating moving averages and the ATR indicator to optimize entry and exit timing. The method aims to capture short-term trend reversals and momentum shifts in the market, leveraging precise entry and exit signals to capitalize on potential trading opportunities.
Strategy Principles
Bollinger Bands Setup: The strategy employs a 20-period Simple Moving Average (SMA) as the middle band of the Bollinger Bands, with a standard deviation multiplier of 2.0. This setup can be adjusted for different markets and timeframes.
Entry Signals:
- Buy Signal: Triggered when the price crosses above the lower Bollinger Band from below.
- Sell Signal: Triggered when the price crosses below the upper Bollinger Band from above.
Risk Management:
- Utilizes OCA (One-Cancels-All) order groups to manage trades, ensuring only one active trade in a given direction.
- Entry orders use stop orders, with the lower band as the stop for buy entries and the upper band for sell entries.
Exit Strategy:
- Implements dynamic stop-loss and take-profit levels based on the ATR (Average True Range).
- ATR period is set to 14, used to calculate stop-loss and take-profit levels.
Position Management: The strategy opens positions when signals are triggered and closes them when reverse signals appear or stop-loss/take-profit levels are reached.
Strategy Advantages
Dynamic Adaptability: Bollinger Bands automatically adjust to market volatility, providing the strategy with good adaptability.
Trend Capture: Through Bollinger Band breakout signals, the strategy effectively captures the onset of short-term trends.
Risk Control: The use of OCA orders and ATR-based stops provides multi-layered risk management mechanisms.
Flexibility: Strategy parameters can be optimized and adjusted for different markets and timeframes.
Automation Potential: The strategy logic is clear and easily implementable on various trading platforms for automation.
Strategy Risks
False Breakouts: In ranging markets, frequent false breakout signals may lead to overtrading.
Slippage Risk: In fast-moving markets, stop orders may not execute at expected prices, potentially increasing actual losses.
Parameter Sensitivity: Strategy performance can be sensitive to changes in parameters such as SMA length and standard deviation multiplier.
Trend Dependency: The strategy may underperform in markets lacking clear trends.
Over-optimization: There’s a risk of overfitting to historical data, which may lead to poor future performance.
Strategy Optimization Directions
Introduce Trend Filters: Consider adding long-term moving averages or ADX indicators to ensure trading only in strong trend markets.
Optimize Entry Timing: Consider combining RSI or Stochastic indicators to further confirm momentum on Bollinger Band breakouts.
Dynamic Parameter Adjustment: Implement adaptive Bollinger Band parameters, such as dynamically adjusting the standard deviation multiplier based on market volatility.
Improve Exit Strategy: Consider using trailing stops or price action-based exit rules to better lock in profits.
Add Volume Filters: Avoid trading during low volume periods to reduce risks associated with false breakouts.
Multi-Timeframe Analysis: Incorporate market structure analysis from longer timeframes to improve trade success rates.
Conclusion
The Bollinger Bands Momentum Optimization Strategy is a quantitative trading method that combines technical analysis with statistical principles. Through the dynamic properties of Bollinger Bands and volatility measurement of ATR, this strategy aims to capture short-term market reversals and momentum shifts. While the strategy shows promising potential, traders need to closely monitor market conditions and continuously optimize parameters and rules based on actual trading performance. Through ongoing backtesting and forward validation, combined with strict risk management, this strategy has the potential to achieve stable performance across various market environments. However, traders should always remember that there is no perfect strategy, and continuous learning and adaptation are key to success in quantitative trading.
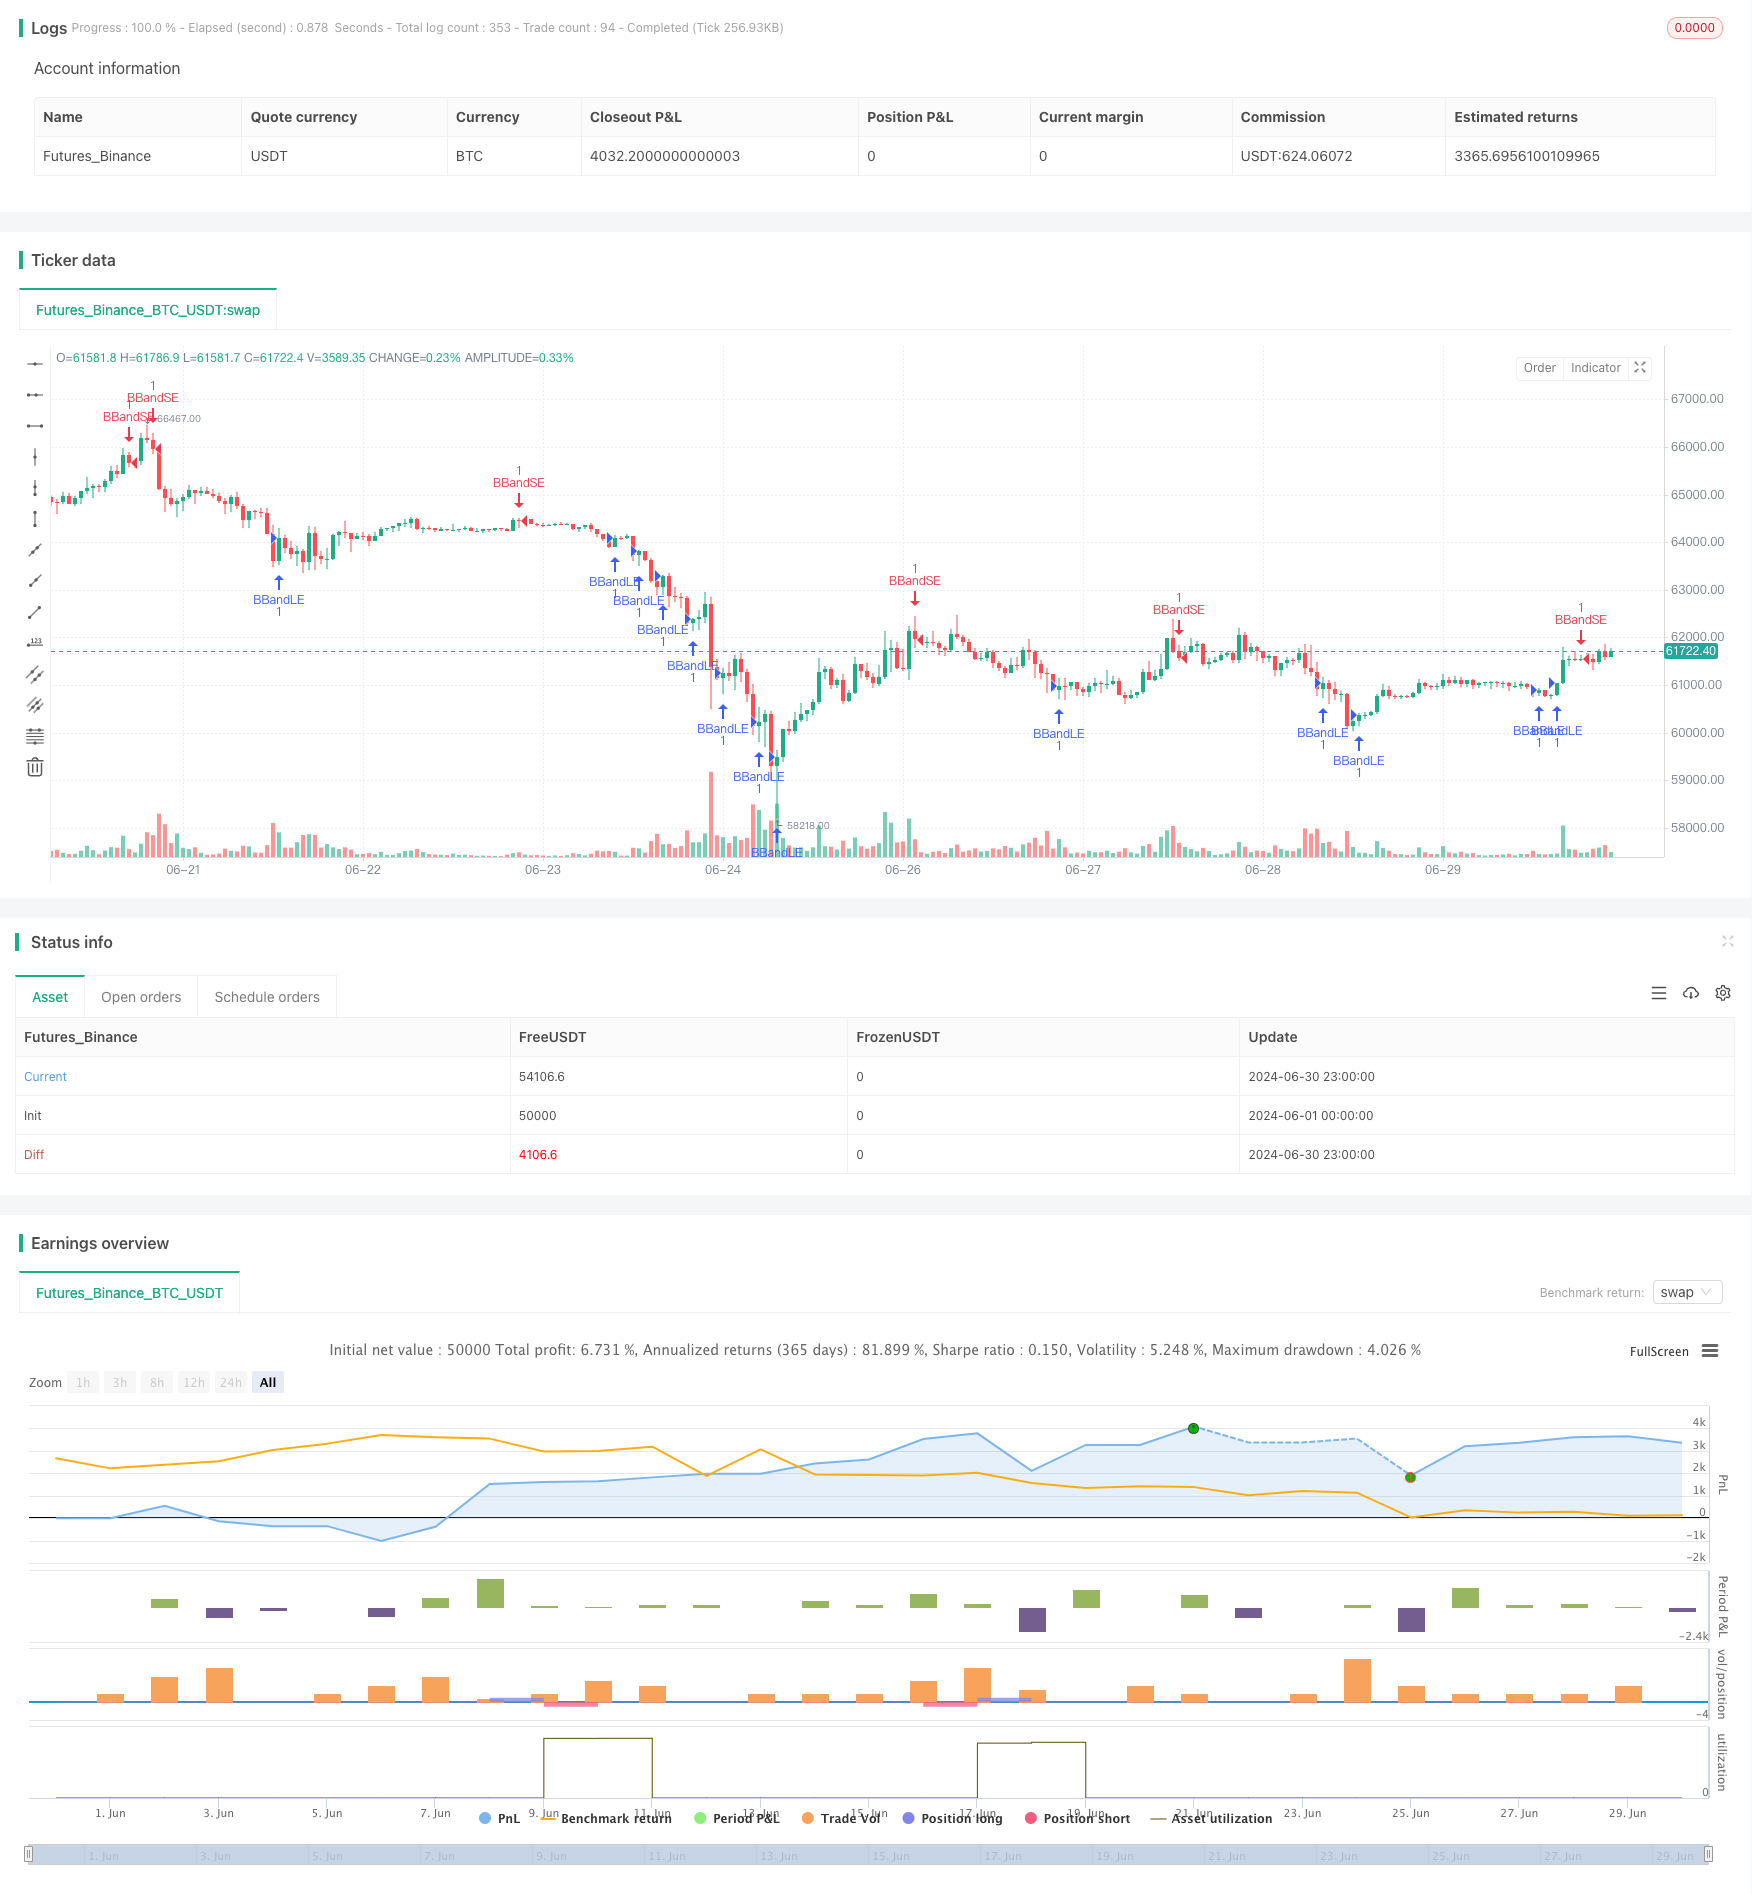
/*backtest
start: 2024-06-01 00:00:00
end: 2024-06-30 23:59:59
period: 1h
basePeriod: 15m
exchanges: [{"eid":"Futures_Binance","currency":"BTC_USDT"}]
*/

//@version=5
strategy("Optimized Bollinger Bands Strategy", overlay=true)

// Input parameters
source = close
length = input.int(20, minval=1, title="SMA Length")
mult = input.float(2.0, minval=0.001, maxval=50, title="Standard Deviation Multiplier")

// Calculate Bollinger Bands
basis = ta.sma(source, length)
dev = mult * ta.stdev(source, length)
upper = basis + dev
lower = basis - dev

// Entry conditions
buyEntry = ta.crossover(source, lower)
sellEntry = ta.crossunder(source, upper)

// Strategy entries with stops and OCA groups
if buyEntry
    strategy.entry("BBandLE", strategy.long, stop=lower, oca_name="BollingerBands", comment="BBandLE")

if sellEntry
    strategy.entry("BBandSE", strategy.short, stop=upper, oca_name="BollingerBands",  comment="BBandSE")

// Exit logic
// Implement exit conditions based on your risk management strategy
// Example: Use ATR-based stops and take profits
atrLength = input.int(14, minval=1, title="ATR Length")
atrStop = ta.atr(atrLength)
if strategy.opentrades > 0
    if strategy.position_size > 0
        strategy.exit("Take Profit/Stop Loss", "BBandLE", stop=close - atrStop, limit=close + atrStop)
    else if strategy.position_size < 0
        strategy.exit("Take Profit/Stop Loss", "BBandSE", stop=close + atrStop, limit=close - atrStop)

// Optional: Plot equity curve
// plot(strategy.equity, title="equity", color=color.red, linewidth=2, style=plot.style_area)
- Bollinger Band ATR Trend Following Strategy
- Multi-Period Bollinger Bands Touch Trend Reversal Quantitative Trading Strategy
- RSI and Bollinger Bands Cross-Regression Dual Strategy
- High-Precision RSI and Bollinger Bands Breakout Strategy with Optimized Risk-Reward Ratio
- Adaptive Fibonacci Bollinger Bands Strategy Analysis
- Intelligent Time-Based Long-Short Rotation Balanced Trading Strategy
- Dual Standard Deviation Bollinger Bands Momentum Breakout Strategy
- Enhanced Bollinger Mean Reversion Quantitative Strategy
- Dynamic Moving Average and Bollinger Bands Cross Strategy with Fixed Stop-Loss Optimization Model
- Triple Supertrend and Bollinger Bands Multi-Indicator Trend Following Strategy
- Enhanced Dual EMA Pullback Breakout Trading Strategy
- Multi-Timeframe Exponential Moving Average Crossover Strategy
- Multi-Period Dynamic Channel Crossover Strategy
- Comprehensive Price Gap Short-Term Trend Capture Strategy
- Multi-Stochastic Oscillation and Momentum Analysis System
- Multi-Timeframe Moving Average and RSI Trend Trading Strategy
- Multi-Period Moving Average Crossover Trend Following Strategy
- Three-Week High-Low Momentum Trading Strategy
- Adaptive Moving Average Crossover Strategy
- Technical Indicator Strategy, Risk Management Strategy, Adaptive Trend Following Strategy
- Multi-Level Dynamic Trend Following System
- Advanced Mean Reversion Trading Strategy: Dynamic Range Breakout System Based on Standard Deviation
- EMA Crossover with Bollinger Bands Double Entry Strategy: A Quantitative Trading System Combining Trend Following and Volatility Breakout
- Adaptive Trend-Following Trading Strategy: 200 EMA Breakout with Dynamic Risk Management System
- Multi-Timeframe Market Momentum Crossover Strategy
- Multi-Indicator Trend Following Strategy
- ChandelierExit-EMA Dynamic Stop-Loss Trend-Following Strategy
- Multi-Indicator Divergence Trading Strategy with Adaptive Take Profit and Stop Loss
- Breakout Zone Momentum Trading Strategy
- Precision Trading Strategy and Risk Management System Based on SuperTrend Indicator