概述
这个突破区间动量交易策略是一个结合了突破区间(Breaker Blocks)和动量指标的高级交易系统。该策略利用支撑和阻力区域来识别潜在的交易机会,同时使用移动平均线交叉来确认趋势方向和入场时机。这种方法旨在捕捉价格突破关键水平时的强劲动量,同时通过技术指标的配合来降低假突破的风险。
策略原理
该策略的核心是识别和利用突破区间,这些区域通常代表着市场中的重要支撑和阻力水平。策略使用一个可调整的回溯期(默认为20个周期)来计算这些区间:
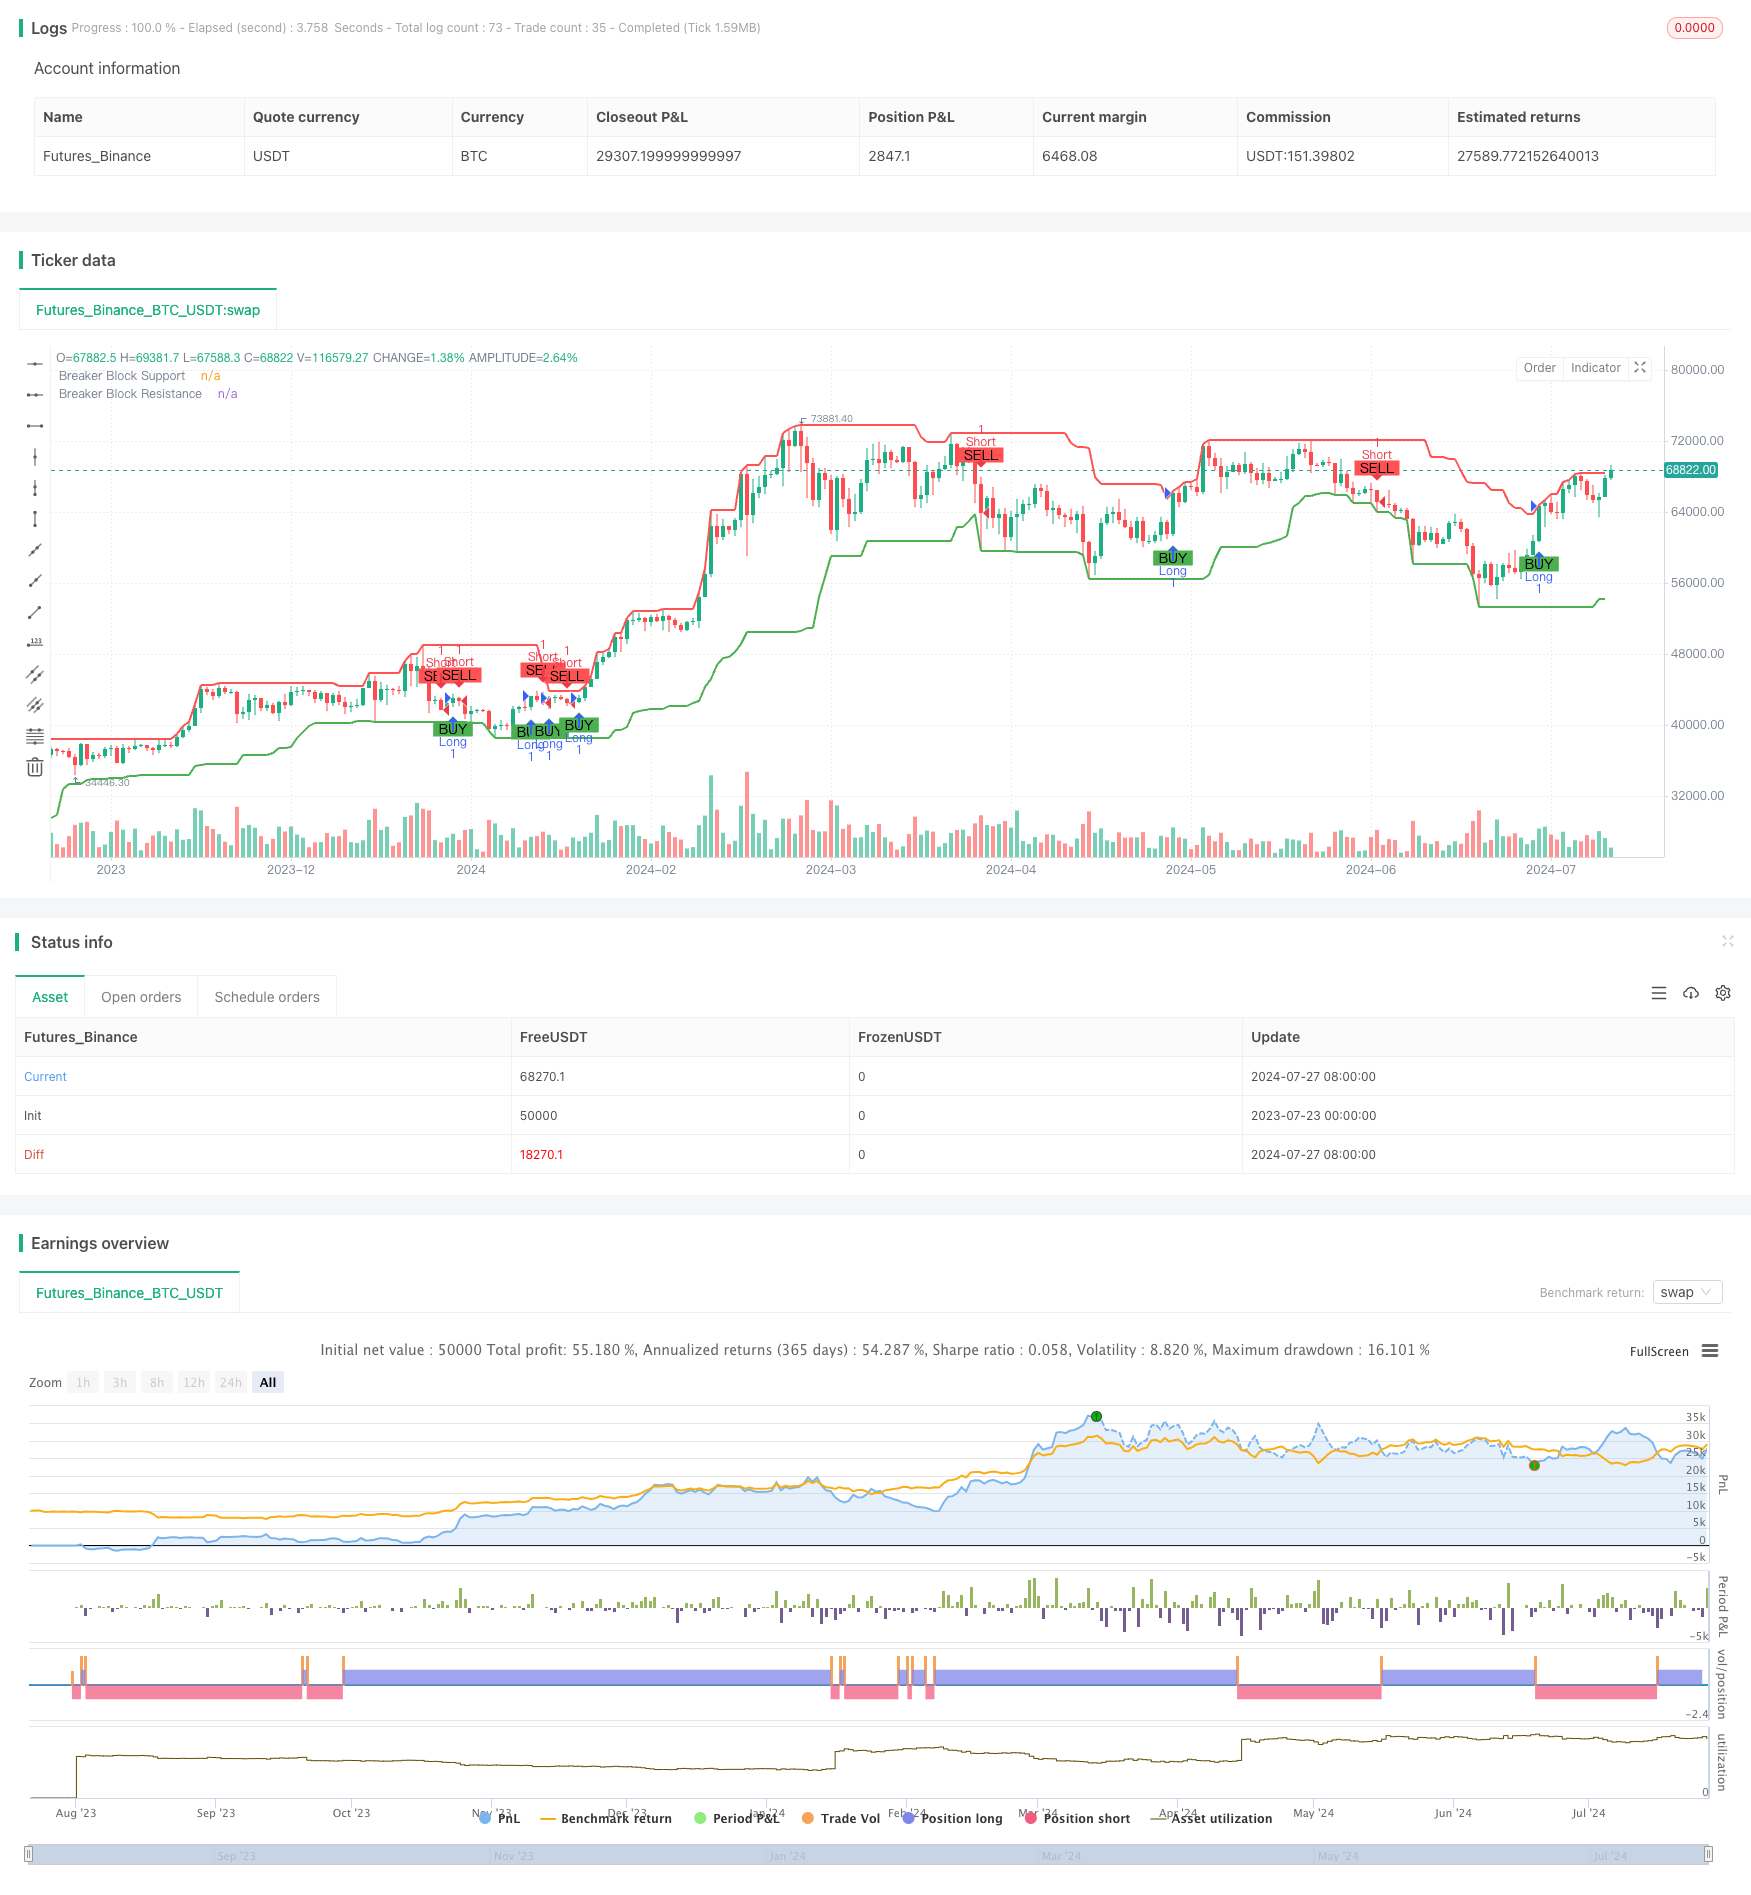
- 突破区间支撑线: 使用ta.lowest()函数计算指定回溯期内的最低价格。
- 突破区间阻力线: 使用ta.highest()函数计算指定回溯期内的最高价格。
为了确认交易信号,策略还整合了简单移动平均线(SMA)交叉策略:
- 买入信号: 当收盘价上穿50周期SMA时触发。
- 卖出信号: 当收盘价下穿50周期SMA时触发。
最终的交易决策是结合突破区间和SMA交叉信号:
- 多头入场: 当出现买入信号且收盘价高于突破区间支撑线时。
- 空头入场: 当出现卖出信号且收盘价低于突破区间阻力线时。
这种方法不仅考虑了价格动量,还结合了关键技术水平的突破,旨在提高交易的准确性和盈利潜力。
策略优势
多维度分析: 结合突破区间和移动平均线交叉,提供了更全面的市场视角,有助于减少假信号。
适应性强: 通过可调整的回溯期参数,策略可以适应不同的市场条件和交易品种。
视觉化辅助: 策略在图表上绘制了突破区间和交易信号,帮助交易者直观地理解市场结构和潜在机会。
趋势跟踪: 利用SMA交叉确认趋势方向,有助于捕捉大趋势中的交易机会。
风险管理: 通过结合多个技术指标,降低了单一指标可能带来的风险。
自动化潜力: 策略代码可以直接用于自动化交易系统,减少人为干预和情绪影响。
策略风险
过度依赖历史数据: 突破区间基于历史数据计算,在快速变化的市场中可能不够及时。
假突破风险: 尽管结合了多个指标,但仍然存在误判突破的可能性,特别是在波动性较大的市场中。
滞后性: 使用SMA作为确认信号可能导致入场时机略有滞后,在快速市场中可能错过部分利润。
参数敏感性: 策略性能可能对回溯期和SMA周期的选择高度敏感,需要仔细优化和回测。
缺乏止损机制: 当前策略没有明确的止损策略,可能导致在市场反转时承受过大损失。
市场条件依赖: 策略在趋势明确的市场中表现可能更好,但在区间震荡市场中可能频繁产生错误信号。
策略优化方向
引入动态参数: 可以考虑使用自适应参数,如基于市场波动性调整突破区间的回溯期,以提高策略的适应性。
整合量化指标: 加入成交量分析或其他动量指标(如RSI或MACD)来进一步确认突破的有效性,减少假突破风险。
优化入场时机: 考虑使用更敏感的短期均线或指数移动平均线(EMA)来代替SMA,以改善信号的及时性。
实现止损和止盈: 加入基于ATR(平均真实范围)的动态止损策略,并设置合理的利润目标,以优化风险收益比。
增加市场状态过滤器: 开发一个市场状态识别机制,在不同的市场环境(趋势、震荡)下使用不同的交易逻辑。
优化交易频率: 通过调整信号确认条件或增加时间过滤器,减少过度交易,提高每笔交易的质量。
实现仓位管理: 根据市场波动性和当前趋势强度动态调整仓位大小,以优化资金利用效率和控制风险。
加入基本面过滤: 在适用的情况下,考虑结合基本面数据(如经济日历事件)来过滤潜在的高风险交易时期。
总结
突破区间动量交易策略是一个结合了技术分析和趋势跟踪的高级交易系统。通过识别关键的支撑和阻力区域,并结合移动平均线交叉来确认趋势,该策略旨在捕捉市场中的高概率交易机会。虽然策略展现了潜力,但仍存在一些风险和优化空间。
交易者在使用此策略时应当注意市场条件的变化,并考虑引入额外的风险管理措施。通过持续的回测和优化,结合本文提出的改进建议,可以进一步提升策略的稳健性和盈利能力。最终,成功的交易不仅依赖于策略本身,还需要交易者的经验、纪律和对市场的深入理解。
/*backtest
start: 2023-07-23 00:00:00
end: 2024-07-28 00:00:00
period: 1d
basePeriod: 1h
exchanges: [{"eid":"Futures_Binance","currency":"BTC_USDT"}]
*/

//@version=5
strategy("Breaker Blocks with Buy and Sell Signals", overlay=true)

// Define the lookback period for breaker blocks
breakerPeriod = input.int(20, title="Breaker Block Lookback Period")

// Calculate breaker blocks
breakerBlockSupport = ta.lowest(low, breakerPeriod)
breakerBlockResistance = ta.highest(high, breakerPeriod)

// Buy and Sell Signals
buySignal = ta.crossover(close, ta.sma(close, 50))  // Example buy signal using SMA crossover
sellSignal = ta.crossunder(close, ta.sma(close, 50))  // Example sell signal using SMA crossunder

// Define the conditions for the strategy
longCondition = buySignal and close > breakerBlockSupport
shortCondition = sellSignal and close < breakerBlockResistance

// Plot breaker blocks
plot(breakerBlockSupport, title="Breaker Block Support", color=color.green, linewidth=2)
plot(breakerBlockResistance, title="Breaker Block Resistance", color=color.red, linewidth=2)

// Plot buy and sell signals on the chart
plotshape(series=longCondition, location=location.belowbar, color=color.green, style=shape.labelup, text="BUY")
plotshape(series=shortCondition, location=location.abovebar, color=color.red, style=shape.labeldown, text="SELL")

// Strategy execution
if (longCondition)
    strategy.entry("Long", strategy.long)
if (shortCondition)
    strategy.entry("Short", strategy.short)