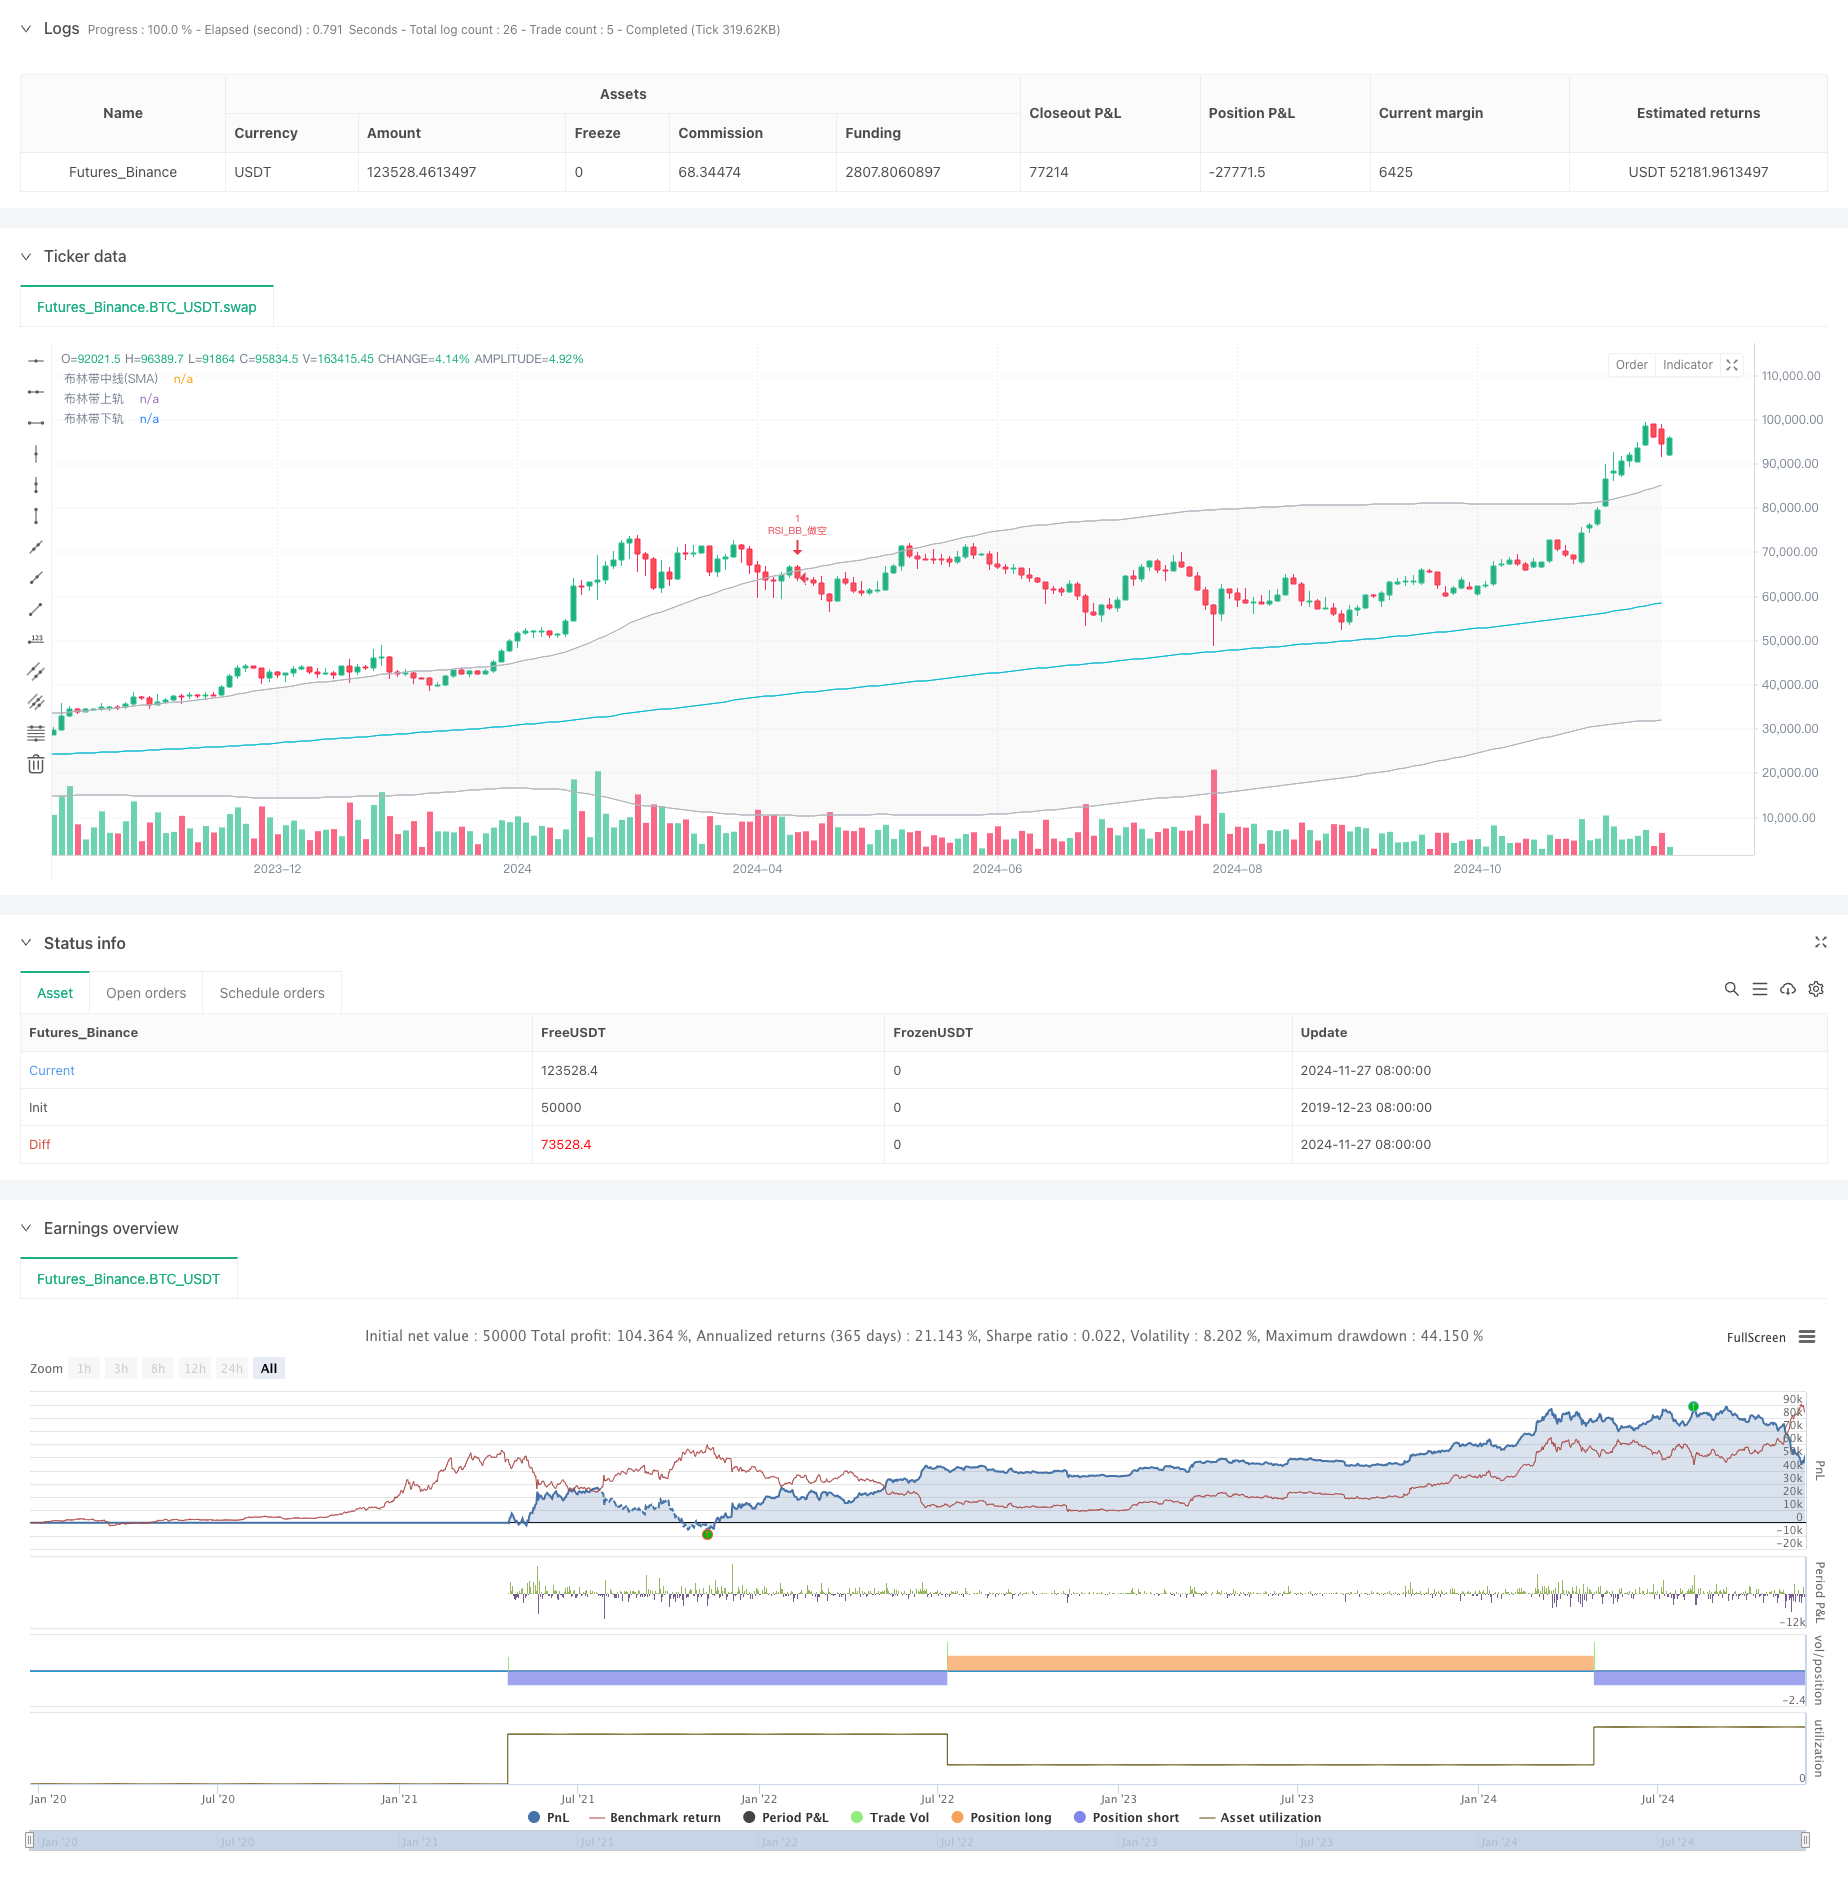
RSI and Bollinger Bands Cross-Regression Dual Strategy
Author: ChaoZhang, Date: 2024-11-29 16:42:35Tags: RSIBBSMAOCA

Overview
This strategy is a dual technical analysis trading system based on the Relative Strength Index (RSI) and Bollinger Bands. The strategy combines RSI’s overbought/oversold signals with Bollinger Bands’ price channel breakout signals to construct a complete trading decision framework. It is particularly suitable for markets with high volatility, achieving risk-controlled trading through strict entry and exit conditions.
Strategy Principle
The core logic is built on the synergy of two main technical indicators:
- RSI uses a 6-period calculation cycle with 50 as the overbought/oversold threshold.
- Bollinger Bands use a 200-period moving average as the middle band with a 2.0 standard deviation multiplier.
- Long condition: Triggered when RSI breaks above the oversold level (50) while price breaks above the lower Bollinger Band.
- Short condition: Triggered when RSI breaks below the overbought level (50) while price breaks below the upper Bollinger Band.
- Strategy employs OCA (One-Cancels-All) order management to ensure only one active trade at a time.
Strategy Advantages
- Dual confirmation mechanism reduces false signals through RSI and Bollinger Bands confirmation.
- Robust risk control using Bollinger Bands as stop-loss levels.
- Strong adaptability with Bollinger Bands automatically adjusting to market volatility.
- Optimized order management through OCA mechanism improves capital efficiency.
- High parameter adaptability allows optimization for different market characteristics.
Strategy Risks
- Sideways market risk: Frequent false breakouts in range-bound markets.
- Lag risk: Some inherent delay due to moving average calculations.
- Parameter sensitivity: Strategy performance heavily depends on RSI and Bollinger Bands parameters.
- Market environment dependence: Better performance in trending markets, potential underperformance in ranging markets.
Optimization Directions
- Dynamic parameter adjustment: Adapt RSI thresholds based on market volatility.
- Market environment filtering: Add trend indicators for different parameter sets in various market conditions.
- Take-profit optimization: Implement dynamic ATR-based take-profit mechanisms.
- Position management optimization: Adjust position size based on signal strength and market volatility.
- Time filtering: Add trading time window restrictions to avoid unfavorable periods.
Summary
This strategy builds a relatively complete trading system through the synergy of RSI and Bollinger Bands. Its main advantages lie in the dual confirmation mechanism and comprehensive risk control, while attention must be paid to market environment impacts. The proposed optimization directions can further enhance strategy stability and profitability.
/*backtest
start: 2019-12-23 08:00:00
end: 2024-11-28 00:00:00
period: 2d
basePeriod: 2d
exchanges: [{"eid":"Futures_Binance","currency":"BTC_USDT"}]
*/

//@version=5
strategy("RSI与布林带双重策略 (by ChartArt) v2.2", shorttitle="CA_RSI_布林带策略_2.2", overlay=true)

// ChartArt的RSI + 布林带双重策略 - 精简版
//
// 中文版本 3, BY Henry
// 原创意来自ChartArt,2015年1月18日
// 更新至Pine Script v5版本,删除了背景色、K线颜色和策略收益绘制功能
//
// 策略说明:
// 该策略结合使用RSI指标和布林带。
// 当价格高于上轨且RSI超买时卖出,
// 当价格低于下轨且RSI超卖时买入。
//
// 本策略仅在RSI和布林带同时
// 处于超买或超卖状态时触发。

// === 输入参数 ===

// RSI参数
RSIlength = input.int(6, title="RSI周期长度", minval=1)
RSIoverSold = input.int(50, title="RSI超卖阈值", minval=0, maxval=100)
RSIoverBought = input.int(50, title="RSI超买阈值", minval=0, maxval=100)

// 布林带参数
BBlength = input.int(200, title="布林带周期长度", minval=1)
BBmult = input.float(2.0, title="布林带标准差倍数", minval=0.001, maxval=50)

// === 计算 ===

price = close
vrsi = ta.rsi(price, RSIlength)

// 布林带计算
BBbasis = ta.sma(price, BBlength)
BBdev = BBmult * ta.stdev(price, BBlength)
BBupper = BBbasis + BBdev
BBlower = BBbasis - BBdev

// === 绘图 ===

plot(BBbasis, color=color.new(color.aqua, 0), title="布林带中线(SMA)")
p1 = plot(BBupper, color=color.new(color.silver, 0), title="布林带上轨")
p2 = plot(BBlower, color=color.new(color.silver, 0), title="布林带下轨")
fill(p1, p2, color=color.new(color.silver, 90))

// === 策略逻辑 ===

if (not na(vrsi))
    longCondition = ta.crossover(vrsi, RSIoverSold) and ta.crossover(price, BBlower)
    if (longCondition)
        strategy.entry("RSI_BB_做多", strategy.long, stop=BBlower, oca_name="RSI_BB",  comment="RSI_BB_做多")
    else
        strategy.cancel("RSI_BB_做多")

    shortCondition = ta.crossunder(vrsi, RSIoverBought) and ta.crossunder(price, BBupper)
    if (shortCondition)
        strategy.entry("RSI_BB_做空", strategy.short, stop=BBupper, oca_name="RSI_BB", comment="RSI_BB_做空")
    else
        strategy.cancel("RSI_BB_做空")
- Bollinger Bands RSI Trading Strategy
- Bollinger Bands and RSI Crossover Trading Strategy
- Bollinger Bands and RSI Combined Trading Strategy
- Bollinger Bands and RSI Combined Dynamic Trading Strategy
- Adaptive Bollinger Bands Dynamic Position Management Strategy
- High-Precision RSI and Bollinger Bands Breakout Strategy with Optimized Risk-Reward Ratio
- Bollinger Bands Momentum Optimization Strategy
- MACD-RSI Crossover Trend Following Strategy with Bollinger Bands Optimization System
- RSI and Bollinger Bands Double Strategy
- Enhanced Mean Reversion Strategy with Bollinger Bands and RSI Integration
- Multi-Technical Indicator Trend Following Trading Strategy
- Multi-Exponential Moving Average Crossover Strategy with Volume-Based ATR Dynamic Stop-Loss Optimization
- Dual Chain Hybrid Momentum EMA Tracking Trading System
- Dynamic Signal Line Trend Following and Volatility Filtering Strategy
- Multi-Timeframe Bollinger Momentum Breakout Strategy with Hull Moving Average
- Multi-Step Volatility-Adjusted Dynamic SuperTrend Strategy
- Triple EMA Trend Following Quantitative Trading Strategy
- Dual Hull Moving Average Crossover Quantitative Strategy
- Statistical Deviation-Based Market Extreme Drawdown Strategy
- Four-Period SMA Breakthrough Trading Strategy with Dynamic Profit/Loss Management System
- Multi-Wave Trend Following Price Analysis Strategy
- Smoothed Heikin-Ashi with SMA Crossover Trend Following Strategy
- Reflected EMA Trend Determination Strategy Based on Hull Moving Averages
- Dual EMA Indicator Smart Crossing Trading System with Dynamic Stop-Loss and Take-Profit Strategy
- OBV-SMA Crossover with RSI Filter Multi-Dimensional Momentum Trading Strategy
- Dynamic Volatility Trading Strategy Based on Bollinger Bands and Candlestick Patterns
- Advanced Fair Value Gap Detection Strategy with Dynamic Risk Management and Fixed Take Profit
- Dynamic RSI Oversold Rebound Trading Strategy with Stop-Loss Optimization Model
- Dynamic ATR Stop-Loss RSI Oversold Rebound Quantitative Strategy
- Advanced Dual EMA Strategy with ATR Volatility Filter System