Overview
This strategy is a comprehensive trading system that combines three major technical indicators: Bollinger Bands, MACD, and RSI. It generates trading signals by analyzing price volatility, trend strength, and overbought/oversold conditions. The core idea of this strategy is to initiate trades when extreme market volatility occurs and is confirmed by trend and momentum indicators.
Strategy Principles
Bollinger Bands: Uses a 20-period Simple Moving Average (SMA) as the middle band, with upper and lower bands set at 2 standard deviations. It measures price volatility and identifies potential breakout points.
MACD: Employs 12 and 26 periods for fast and slow lines, with a 9-period signal line. MACD confirms price trends and momentum.
RSI: Utilizes a 14-period Relative Strength Index, with 70 set as the overbought level and 30 as the oversold level. RSI identifies potential market reversal points.
Trading Logic:
- Buy Signal: When price is below the lower Bollinger Band, MACD line crosses above the signal line, and RSI is below 30.
- Sell Signal: When price is above the upper Bollinger Band, MACD line crosses below the signal line, and RSI is above 70.
Visualization: The strategy plots Bollinger Bands, MACD, and RSI indicators on the chart, with background colors highlighting RSI overbought/oversold zones. Buy and sell signals are visually displayed through labels.
Strategy Advantages
Multi-dimensional Analysis: Combines trend, momentum, and volatility analysis for a more comprehensive market insight.
Risk Management: Effectively controls entry risk through Bollinger Bands and RSI extreme value settings.
Trend Confirmation: The use of MACD helps filter out false breakouts, improving trade reliability.
Visual Intuitiveness: Clearly displays all indicators and signals on the chart, allowing traders to quickly assess market conditions.
Flexibility: Key parameters can be customized to adapt to different markets and trading styles.
Market Adaptability: Applicable to various time frames and trading instruments, offering a wide range of application scenarios.
Strategy Risks
Lagging Nature: Technical indicators are inherently lagging, which may lead to false signals near trend reversal points.
Over-trading: May generate frequent trading signals in range-bound markets, increasing transaction costs.
False Breakouts: Despite multiple confirmations, false signals may still occur in highly volatile markets.
Parameter Sensitivity: Strategy performance highly depends on parameter settings, which may require frequent adjustments for different markets.
Neglect of Fundamentals: Pure technical analysis may overlook important fundamental factors, affecting long-term performance.
Strategy Optimization Directions
Dynamic Parameter Adjustment: Introduce adaptive mechanisms to dynamically adjust Bollinger Bands and RSI parameters based on market volatility.
Incorporate Volume Analysis: Integrate volume indicators such as OBV or CMF to enhance signal reliability.
Time Filtering: Add trading time window restrictions to avoid high volatility or low liquidity periods.
Stop-loss and Take-profit Optimization: Implement dynamic stop-loss and take-profit mechanisms, such as trailing stops or ATR-based stop settings.
Market Regime Recognition: Add logic to identify market states (trending/ranging) and apply different trading strategies accordingly.
Multi-timeframe Analysis: Integrate signals from multiple time frames to improve the robustness of trading decisions.
Conclusion
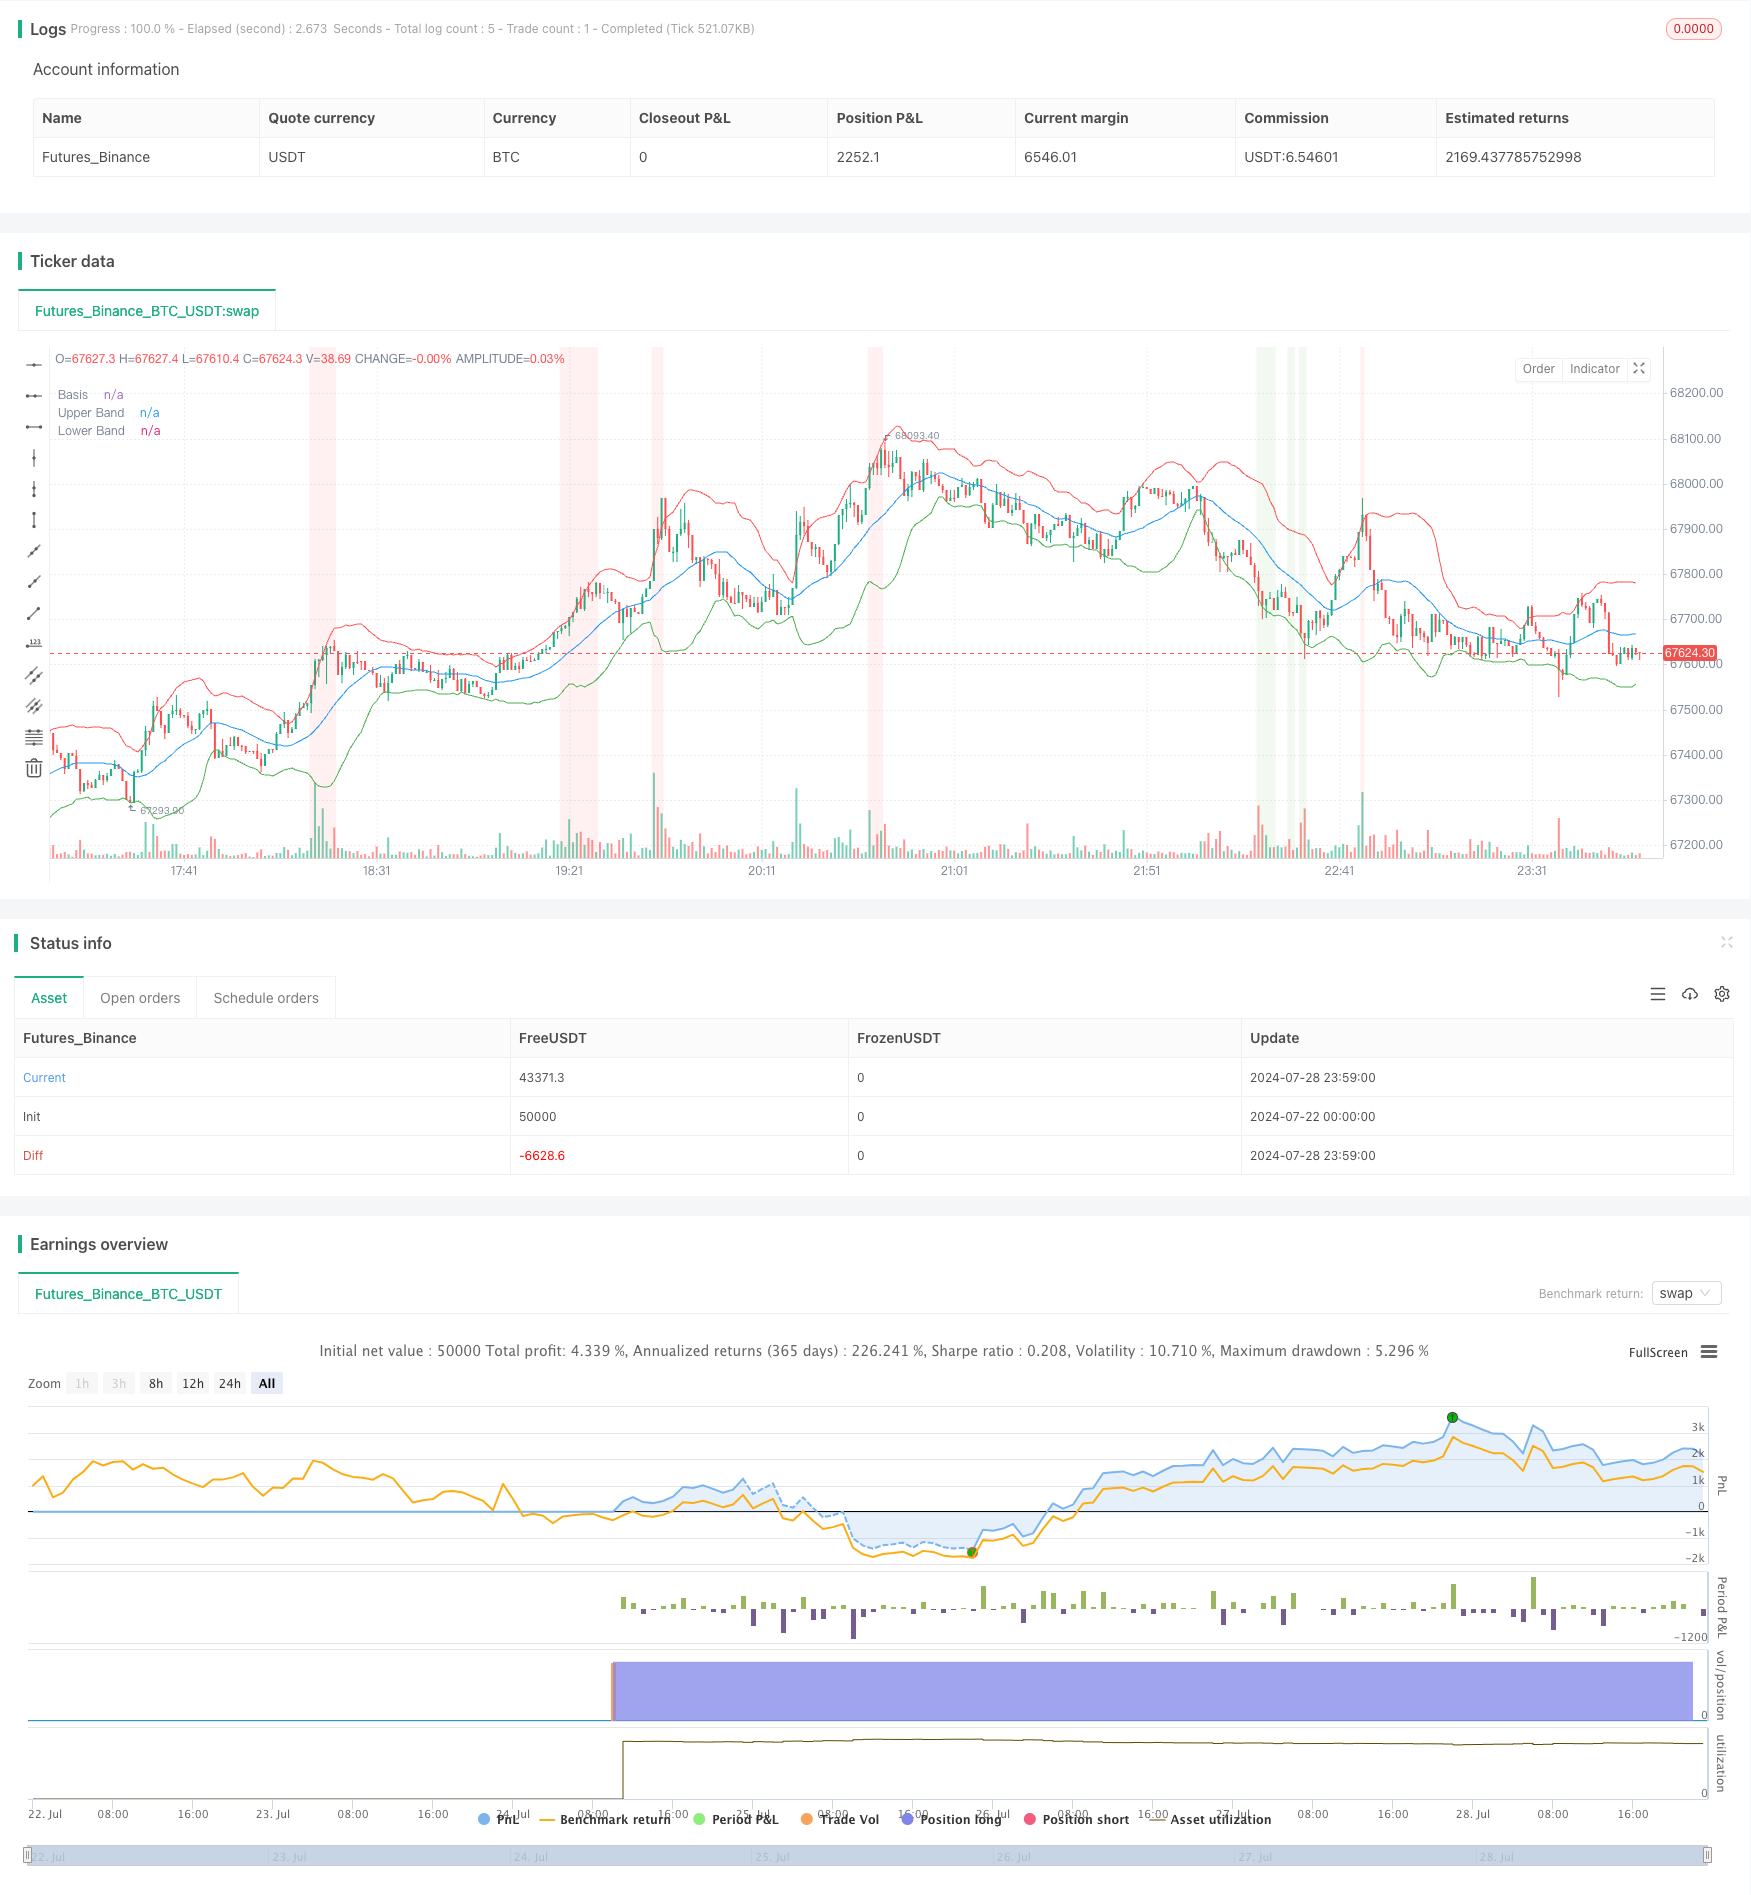
The Multi-Indicator Dynamic Volatility Alert Trading System is a sophisticated strategy combining Bollinger Bands, MACD, and RSI. It analyzes the market from multiple dimensions to capture potential trading opportunities during extreme volatility. The strategy’s strengths lie in its comprehensive market insights and flexible parameter settings, but it also faces risks inherent to technical indicators, such as lag and potential over-trading. Performance and stability can be further enhanced through dynamic parameter adjustments, volume analysis integration, and optimized stop-loss and take-profit mechanisms. This strategy framework is worth considering for traders seeking to capitalize on opportunities in volatile markets. However, users should remember that no trading system is perfect, and continuous backtesting, optimization, and risk management are crucial for long-term success.
/*backtest
start: 2024-07-22 00:00:00
end: 2024-07-29 00:00:00
period: 1m
basePeriod: 1m
exchanges: [{"eid":"Futures_Binance","currency":"BTC_USDT"}]
*/

//@version=5
strategy("Bollinger Bands with MACD and RSI Strategy", overlay=true)

// Bollinger Bands parameters
length = input(20, title="Bollinger Bands Length")
src = input(close, title="Source")
mult = input(2.0, title="Bollinger Bands Multiplier")

// MACD parameters
macdFastLength = input(12, title="MACD Fast Length")
macdSlowLength = input(26, title="MACD Slow Length")
macdSignalSmoothing = input(9, title="MACD Signal Smoothing")

// RSI parameters
rsiLength = input(14, title="RSI Length")
rsiOverbought = input(70, title="RSI Overbought Level")
rsiOversold = input(30, title="RSI Oversold Level")

// Bollinger Bands calculation
basis = ta.sma(src, length)
dev = mult * ta.stdev(src, length)
upper = basis + dev
lower = basis - dev

plot(basis, color=color.blue, linewidth=1, title="Basis")
plot(upper, color=color.red, linewidth=1, title="Upper Band")
plot(lower, color=color.green, linewidth=1, title="Lower Band")

// MACD calculation
[macdLine, signalLine, _] = ta.macd(src, macdFastLength, macdSlowLength, macdSignalSmoothing)
macdHist = macdLine - signalLine

// RSI calculation
rsi = ta.rsi(src, rsiLength)

// Buy/Sell signals based on Bollinger Bands, MACD, and RSI
buySignal = (src < lower) and (macdLine > signalLine) and (rsi < rsiOversold)
sellSignal = (src > upper) and (macdLine < signalLine) and (rsi > rsiOverbought)

plotshape(series=buySignal, location=location.belowbar, color=color.green, style=shape.labelup, text="BUY")
plotshape(series=sellSignal, location=location.abovebar, color=color.red, style=shape.labeldown, text="SELL")

// Plotting the MACD and RSI on the chart
// hline(0, "Zero Line", color=color.gray)
// plot(macdLine, title="MACD Line", color=color.blue, linewidth=1)
// plot(signalLine, title="Signal Line", color=color.orange, linewidth=1)
// plot(macdHist, title="MACD Histogram", color=color.red, style=plot.style_histogram, histbase=0)
// hline(rsiOverbought, "Overbought", color=color.red, linestyle=hline.style_dotted)
// hline(rsiOversold, "Oversold", color=color.green, linestyle=hline.style_dotted)
// plot(rsi, title="RSI", color=color.orange, linewidth=1)

// Background color for RSI levels
bgcolor(rsi > rsiOverbought ? color.new(color.red, 90) : na)
bgcolor(rsi < rsiOversold ? color.new(color.green, 90) : na)

// Strategy logic
if (buySignal)
    strategy.entry("Buy", strategy.long)
if (sellSignal)
    strategy.entry("Sell", strategy.short)