Adaptive Standard Deviation Breakout Trading Strategy: Multi-Period Optimization System Based on Dynamic Volatility
Author: ChaoZhang, Date: 2024-07-30 16:09:04Tags: MASMASTDSLTP
Overview
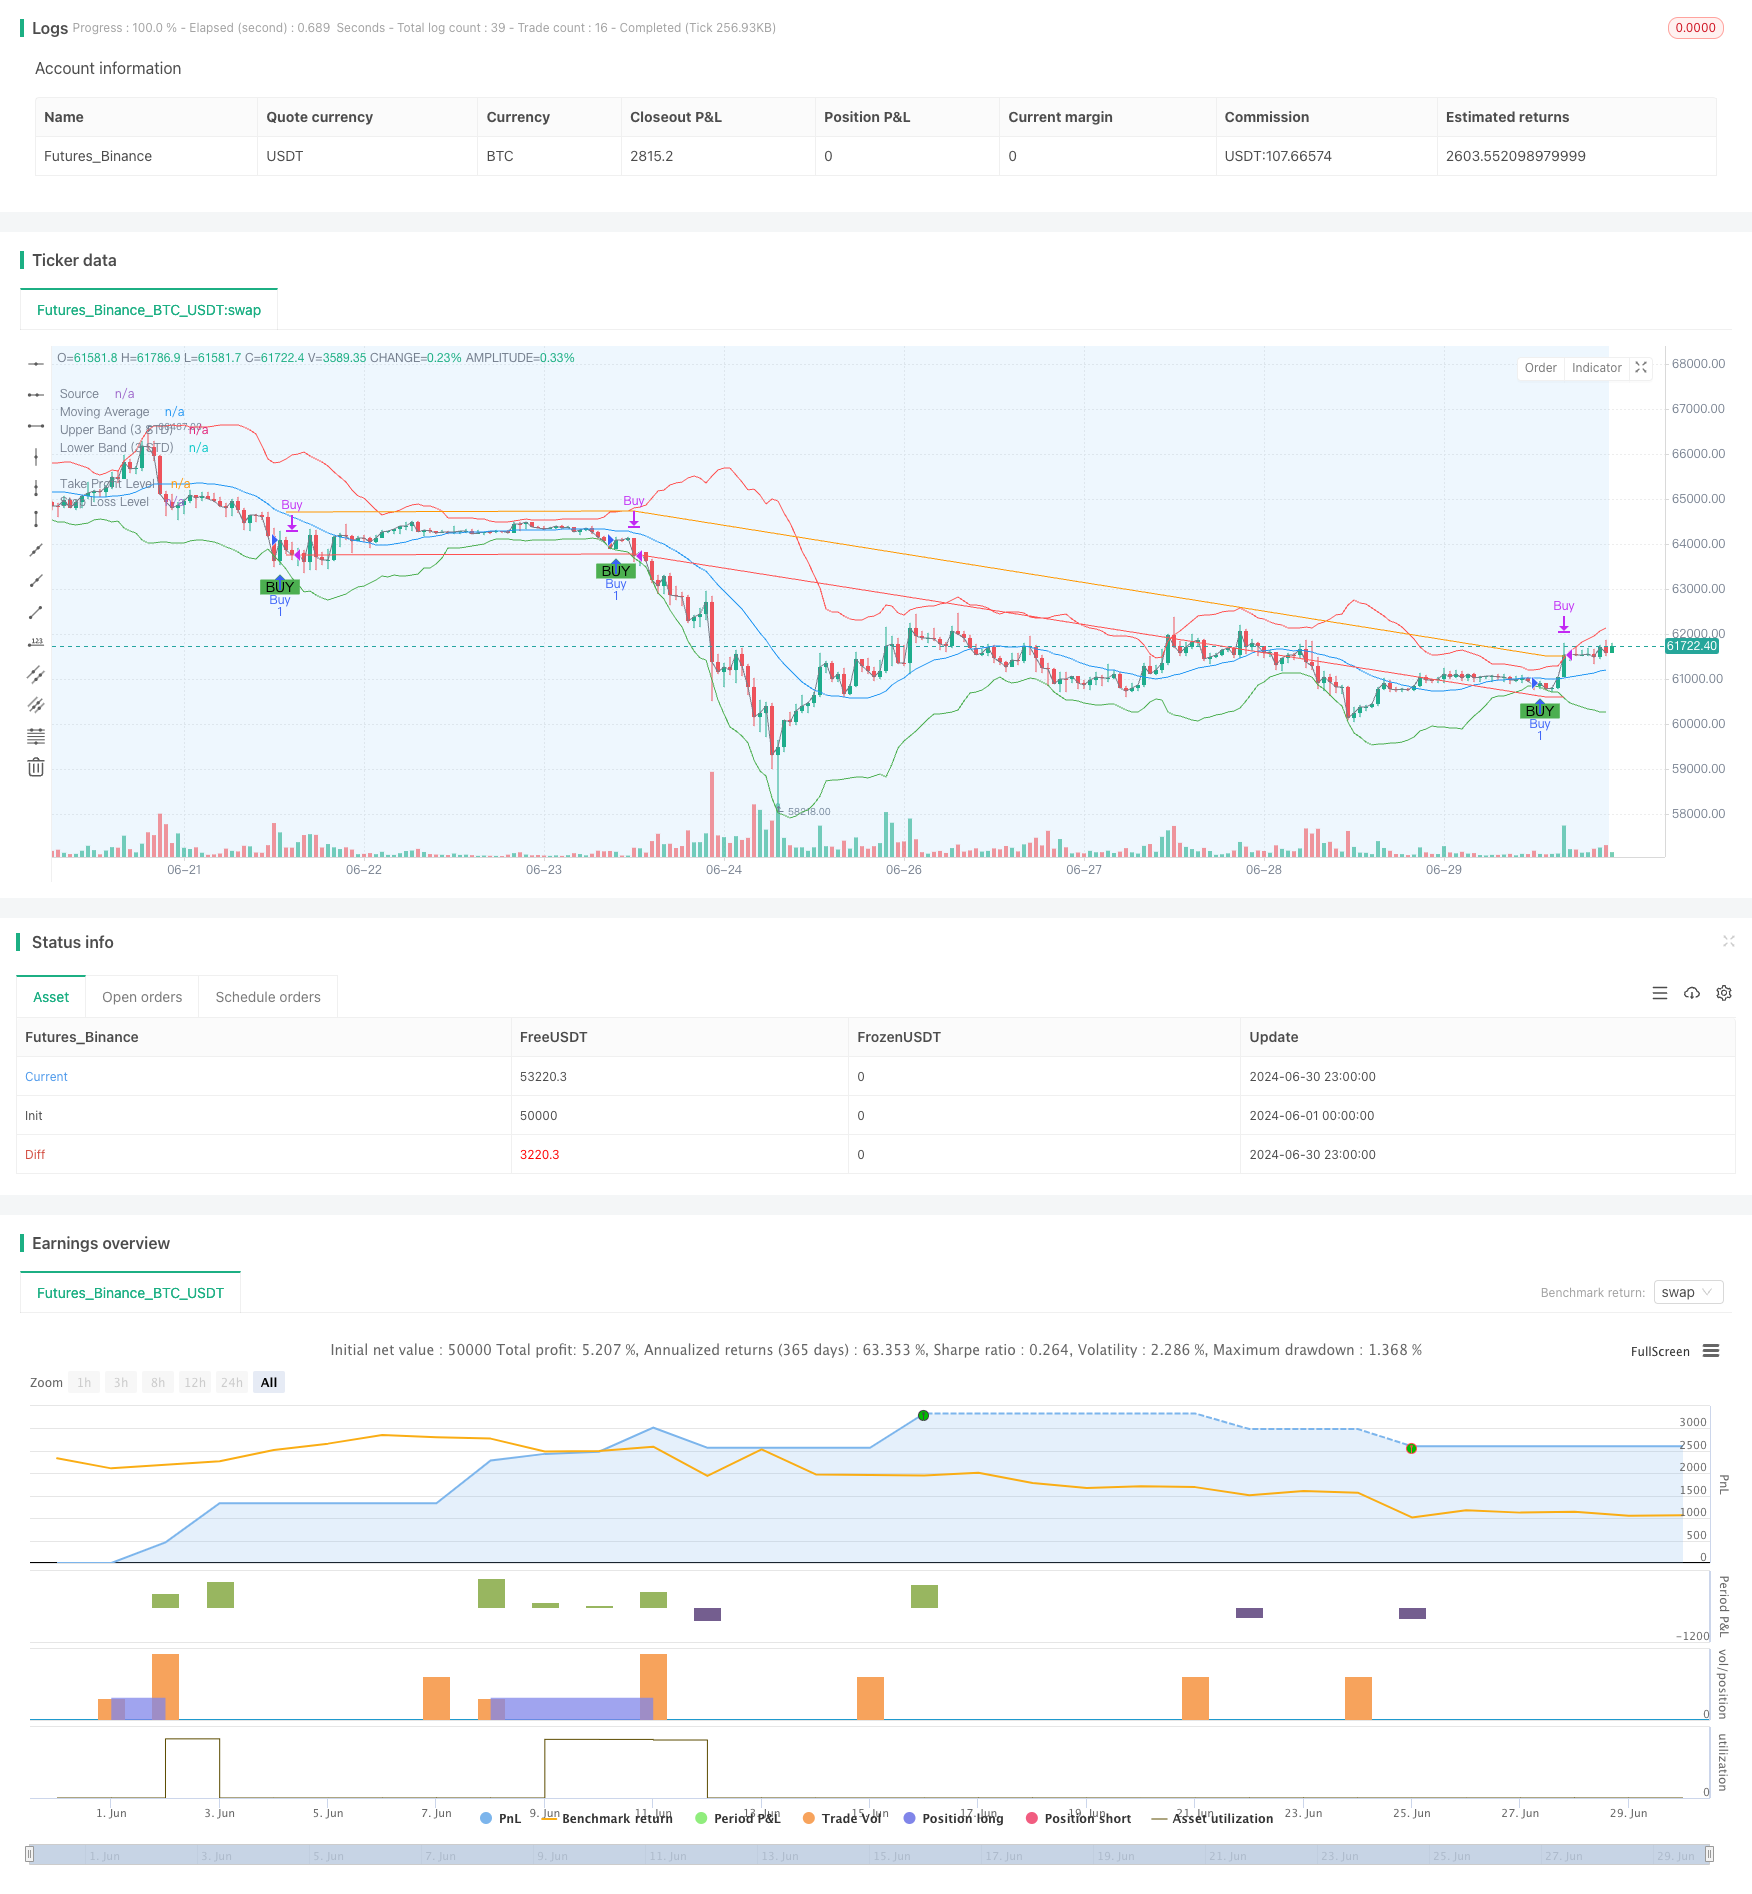
This trading strategy is a system based on standard deviation breakouts, utilizing the relationship between price and moving averages, as well as standard deviation, to identify potential buying opportunities. The strategy primarily focuses on buy signals when the price breaks through the lower band, and manages risk through setting take-profit and stop-loss levels. The core idea of the strategy is to trade during periods of abnormal price volatility while using moving averages and standard deviation to filter out potential false signals.
Strategy Principles
Calculate Moving Average (MA): Use Simple Moving Average (SMA) to calculate the average line for a specified period.
Calculate Standard Deviation: Compute the standard deviation of prices based on the same period.
Construct Upper and Lower Bands:
- Upper Band = MA + (Standard Deviation * Multiplier)
- Lower Band = MA - (Standard Deviation * Multiplier)
Generate Buy Signals: Trigger a buy signal when the price crosses above the lower band from below.
Risk Management:
- Set Take Profit Price: Entry Price * (1 + Take Profit Percentage)
- Set Stop Loss Price: Entry Price * (1 - Stop Loss Percentage)
Backtesting Time Range: The strategy allows users to set specific start and end times for backtesting, executing trades only within the specified time range.
Strategy Advantages
High Adaptability: By using standard deviation, the strategy can automatically adjust trading ranges according to market volatility, adapting to different market environments.
Comprehensive Risk Control: Integrates take-profit and stop-loss mechanisms, effectively controlling risk for each trade.
High Flexibility: Allows users to customize multiple parameters such as standard deviation period, multiplier, take-profit and stop-loss percentages, which can be adjusted according to different markets and personal risk preferences.
Good Visualization: The strategy plots moving averages, upper and lower bands, and buy signals on the chart, facilitating intuitive understanding and analysis.
Powerful Backtesting Function: Users can precisely set the backtesting time range, which is beneficial for evaluating strategy performance under specific market conditions.
Strategy Risks
False Breakout Risk: In sideways or low volatility markets, frequent false breakouts may occur, leading to excessive trading and unnecessary transaction fee losses.
Trend Following Delay: As the strategy is based on moving averages and standard deviation, it may miss some early entry opportunities in strongly trending markets.
Parameter Sensitivity: The strategy’s performance is highly dependent on parameter settings. Different parameter combinations may lead to drastically different results, requiring extensive backtesting and optimization.
One-directional Trading Limitation: The strategy currently only implements long logic, which may miss opportunities or incur significant losses in downtrending markets.
Market Environment Dependency: The strategy may perform better in highly volatile and low-volume cryptocurrency markets, but its effectiveness in other market environments may vary.
Strategy Optimization Directions
Introduce Short-selling Mechanism: Add short-selling logic when the price breaks through the upper band, allowing the strategy to profit in bi-directional markets.
Dynamic Parameter Adjustment: Implement functionality to automatically adjust parameters such as standard deviation multiplier and take-profit/stop-loss ratios based on market conditions, improving the strategy’s adaptability.
Multi-timeframe Analysis: Incorporate data from longer and shorter time periods to improve signal reliability and entry timing accuracy.
Add Volume Filtering: Introduce volume indicators to filter out false breakout signals during low-volume periods, improving trade quality.
Optimize Take-profit and Stop-loss Mechanisms: Implement dynamic take-profit and stop-loss, such as introducing trailing stops or ATR-based stop-loss settings, to better adapt to market volatility.
Increase Filtering Conditions: Combine other technical indicators or fundamental data to set additional trading conditions, reducing false signals.
Implement Money Management: Add position sizing logic to dynamically adjust the proportion of funds for each trade based on account size and market volatility.
Summary
The Adaptive Standard Deviation Breakout Trading Strategy is a quantitative trading system based on statistical principles, capturing trading opportunities brought by market anomalies through dynamically adjusted price channels. The core advantages of this strategy lie in its adaptability and risk management capabilities, allowing it to maintain relatively stable performance in different market environments. However, the strategy also faces challenges such as false breakouts and parameter sensitivity, requiring traders to use it cautiously and continuously optimize.
By introducing short-selling mechanisms, dynamic parameter adjustments, multi-timeframe analysis, and other optimization measures, this strategy has the potential to further enhance its stability and profitability. For experienced quantitative traders, this strategy provides an excellent basic framework that can be deeply customized and optimized to adapt to different trading styles and market environments.
Overall, this Adaptive Standard Deviation Breakout Trading Strategy demonstrates the essence of quantitative trading - capturing market opportunities through mathematical models and statistical methods while strictly controlling risk. It is not only applicable to highly volatile cryptocurrency markets but can also be applied to other financial markets with appropriate adjustments, providing traders with a powerful and flexible trading tool.
/*backtest
start: 2024-06-01 00:00:00
end: 2024-06-30 23:59:59
period: 1h
basePeriod: 15m
exchanges: [{"eid":"Futures_Binance","currency":"BTC_USDT"}]
*/

//@version=5
strategy("MikEy Scali 3 STD Dev Buy Strategy with TP and SL", overlay=true)

// Input parameters for the strategy
length = input.int(20, title="Standard Deviation Length", minval=1)
src = input(close, title="Source")
mult = input.float(3.0, title="Standard Deviation Multiplier", step=0.1)

// Input for the take profit and stop loss percentages
takeProfitPerc = input.float(1.0, title="Take Profit Percentage", step=0.1) / 100
stopLossPerc = input.float(0.5, title="Stop Loss Percentage", step=0.1) / 100

// Input parameters for the backtesting range
testStartYear = input.int(2023, title="Backtest Start Year", minval=2000)
testStartMonth = input.int(1, title="Backtest Start Month", minval=1, maxval=12)
testStartDay = input.int(1, title="Backtest Start Day", minval=1, maxval=31)

testEndYear = input.int(2024, title="Backtest End Year", minval=2000)
testEndMonth = input.int(12, title="Backtest End Month", minval=1, maxval=12)
testEndDay = input.int(31, title="Backtest End Day", minval=1, maxval=31)

// Define the backtesting range
testStartTime = timestamp(testStartYear, testStartMonth, testStartDay, 00, 00)
testEndTime = timestamp(testEndYear, testEndMonth, testEndDay, 23, 59)

// Determine if the current bar is within the backtesting range
inBacktestRange = (time >= testStartTime) and (time <= testEndTime)

// Calculate the moving average and standard deviation
ma = ta.sma(src, length)
std_dev = ta.stdev(src, length)

// Calculate upper and lower bands
upper_band = ma + (std_dev * mult)
lower_band = ma - (std_dev * mult)

// Buy condition within the backtesting range
buyCondition = inBacktestRange and ta.crossover(src, lower_band)

// Plot the buy signal on the chart
plotshape(series=buyCondition, location=location.belowbar, color=color.green, style=shape.labelup, text="BUY")

// Execute buy orders based on the condition within the backtesting range
if (buyCondition)
    strategy.entry("Buy", strategy.long)

// Calculate the take profit and stop loss prices when a position is opened
entryPrice = na(strategy.opentrades.entry_price(0)) ? src : strategy.opentrades.entry_price(0)
takeProfitPrice = entryPrice * (1 + takeProfitPerc)
stopLossPrice = entryPrice * (1 - stopLossPerc)

// Take profit condition
takeProfitCondition = strategy.position_size > 0 and close >= takeProfitPrice

// Stop loss condition
stopLossCondition = strategy.position_size > 0 and close <= stopLossPrice

// Execute sell order when take profit condition is met within the backtesting range
if (takeProfitCondition and inBacktestRange)
    strategy.close("Buy", "Take Profit")

// Execute sell order when stop loss condition is met within the backtesting range
if (stopLossCondition and inBacktestRange)
    strategy.close("Buy", "Stop Loss")

// Plot the moving average and the bands
plot(ma, color=color.blue, title="Moving Average")
plot(upper_band, color=color.red, title="Upper Band (3 STD)")
plot(lower_band, color=color.green, title="Lower Band (3 STD)")

// Optional: Plot the source
plot(src, color=color.gray, title="Source")

// Add labels for clarity
bgcolor(buyCondition ? color.new(color.green, 90) : na, offset=-1, title="Buy Signal Background")

// Optional: Highlight the backtesting range on the chart
bgcolor(inBacktestRange ? color.new(color.blue, 90) : na, title="Backtest Range Background")

// Plot the take profit and stop loss levels if a position is open
plot(strategy.position_size > 0 ? takeProfitPrice : na, color=color.orange, title="Take Profit Level")
plot(strategy.position_size > 0 ? stopLossPrice : na, color=color.red, title="Stop Loss Level")
- Dynamic Moving Average Crossover Trend Following Strategy with Adaptive Risk Management
- Four-Period SMA Breakthrough Trading Strategy with Dynamic Profit/Loss Management System
- Intelligent Moving Average Crossover Strategy with Dynamic Profit/Loss Management System
- Dual Moving Average Crossover Strategy with Adaptive Stop-Loss and Take-Profit
- Trend Breakout Trading System with Moving Average (TBMA Strategy)
- Adaptive Quantitative Trading Strategy with Dual Moving Average Crossover and Take Profit/Stop Loss
- Dynamic Trailing Stop Dual Target Moving Average Crossover Strategy
- Risk-Reward Ratio Optimized Strategy Based on Moving Average Crossover
- Dual Moving Average Crossover Strategy with Dynamic Risk Management
- Trend Following RSI and Moving Average Combined Quantitative Trading Strategy
- Multi-EMA Crossover with Time Interval Integration Strategy
- Dual Moving Average Crossover Confirmation Strategy with Volume-Price Integration Optimization Model
- Dual Dynamic Indicator Optimization Strategy
- VWAP Crossover Dynamic Profit Target Trading Strategy
- Bollinger Bands Breakout Quantitative Trading Strategy
- Fibonacci Extension and Retracement Channel Breakout Strategy
- Multi-Dimensional Order Flow Analysis and Trading Strategy
- Multi-Moving Average Trend Following and Reversal Pattern Recognition Strategy
- Advanced Composite Moving Average and Market Momentum Trend Capture Strategy
- Advanced Fibonacci Retracement and Volume-Weighted Price Action Trading Strategy
- Dynamic Position Dual Moving Average Crossover Strategy
- Dynamic Signal Line Trend Following Strategy Combining ATR and Volume
- Multi-Indicator Dynamic Volatility Alert Trading System
- Dynamic Trend-Following Trading Strategy Based on Gann Angles
- VWAP-ATR Trend Following and Price Reversal Strategy
- Bollinger Bands RSI Neutral Market Quantitative Trading Strategy
- Multi-Level Oversold Oscillator Buy Strategy
- Adaptive Trend Following Strategy Combining AlphaTrend and KAMA with Risk Management
- Dual Indicator Cross-Confirmation Momentum Volume Quantitative Trading Strategy
- Dynamic Trend Following Strategy - Multi-Indicator Integrated Momentum Analysis System