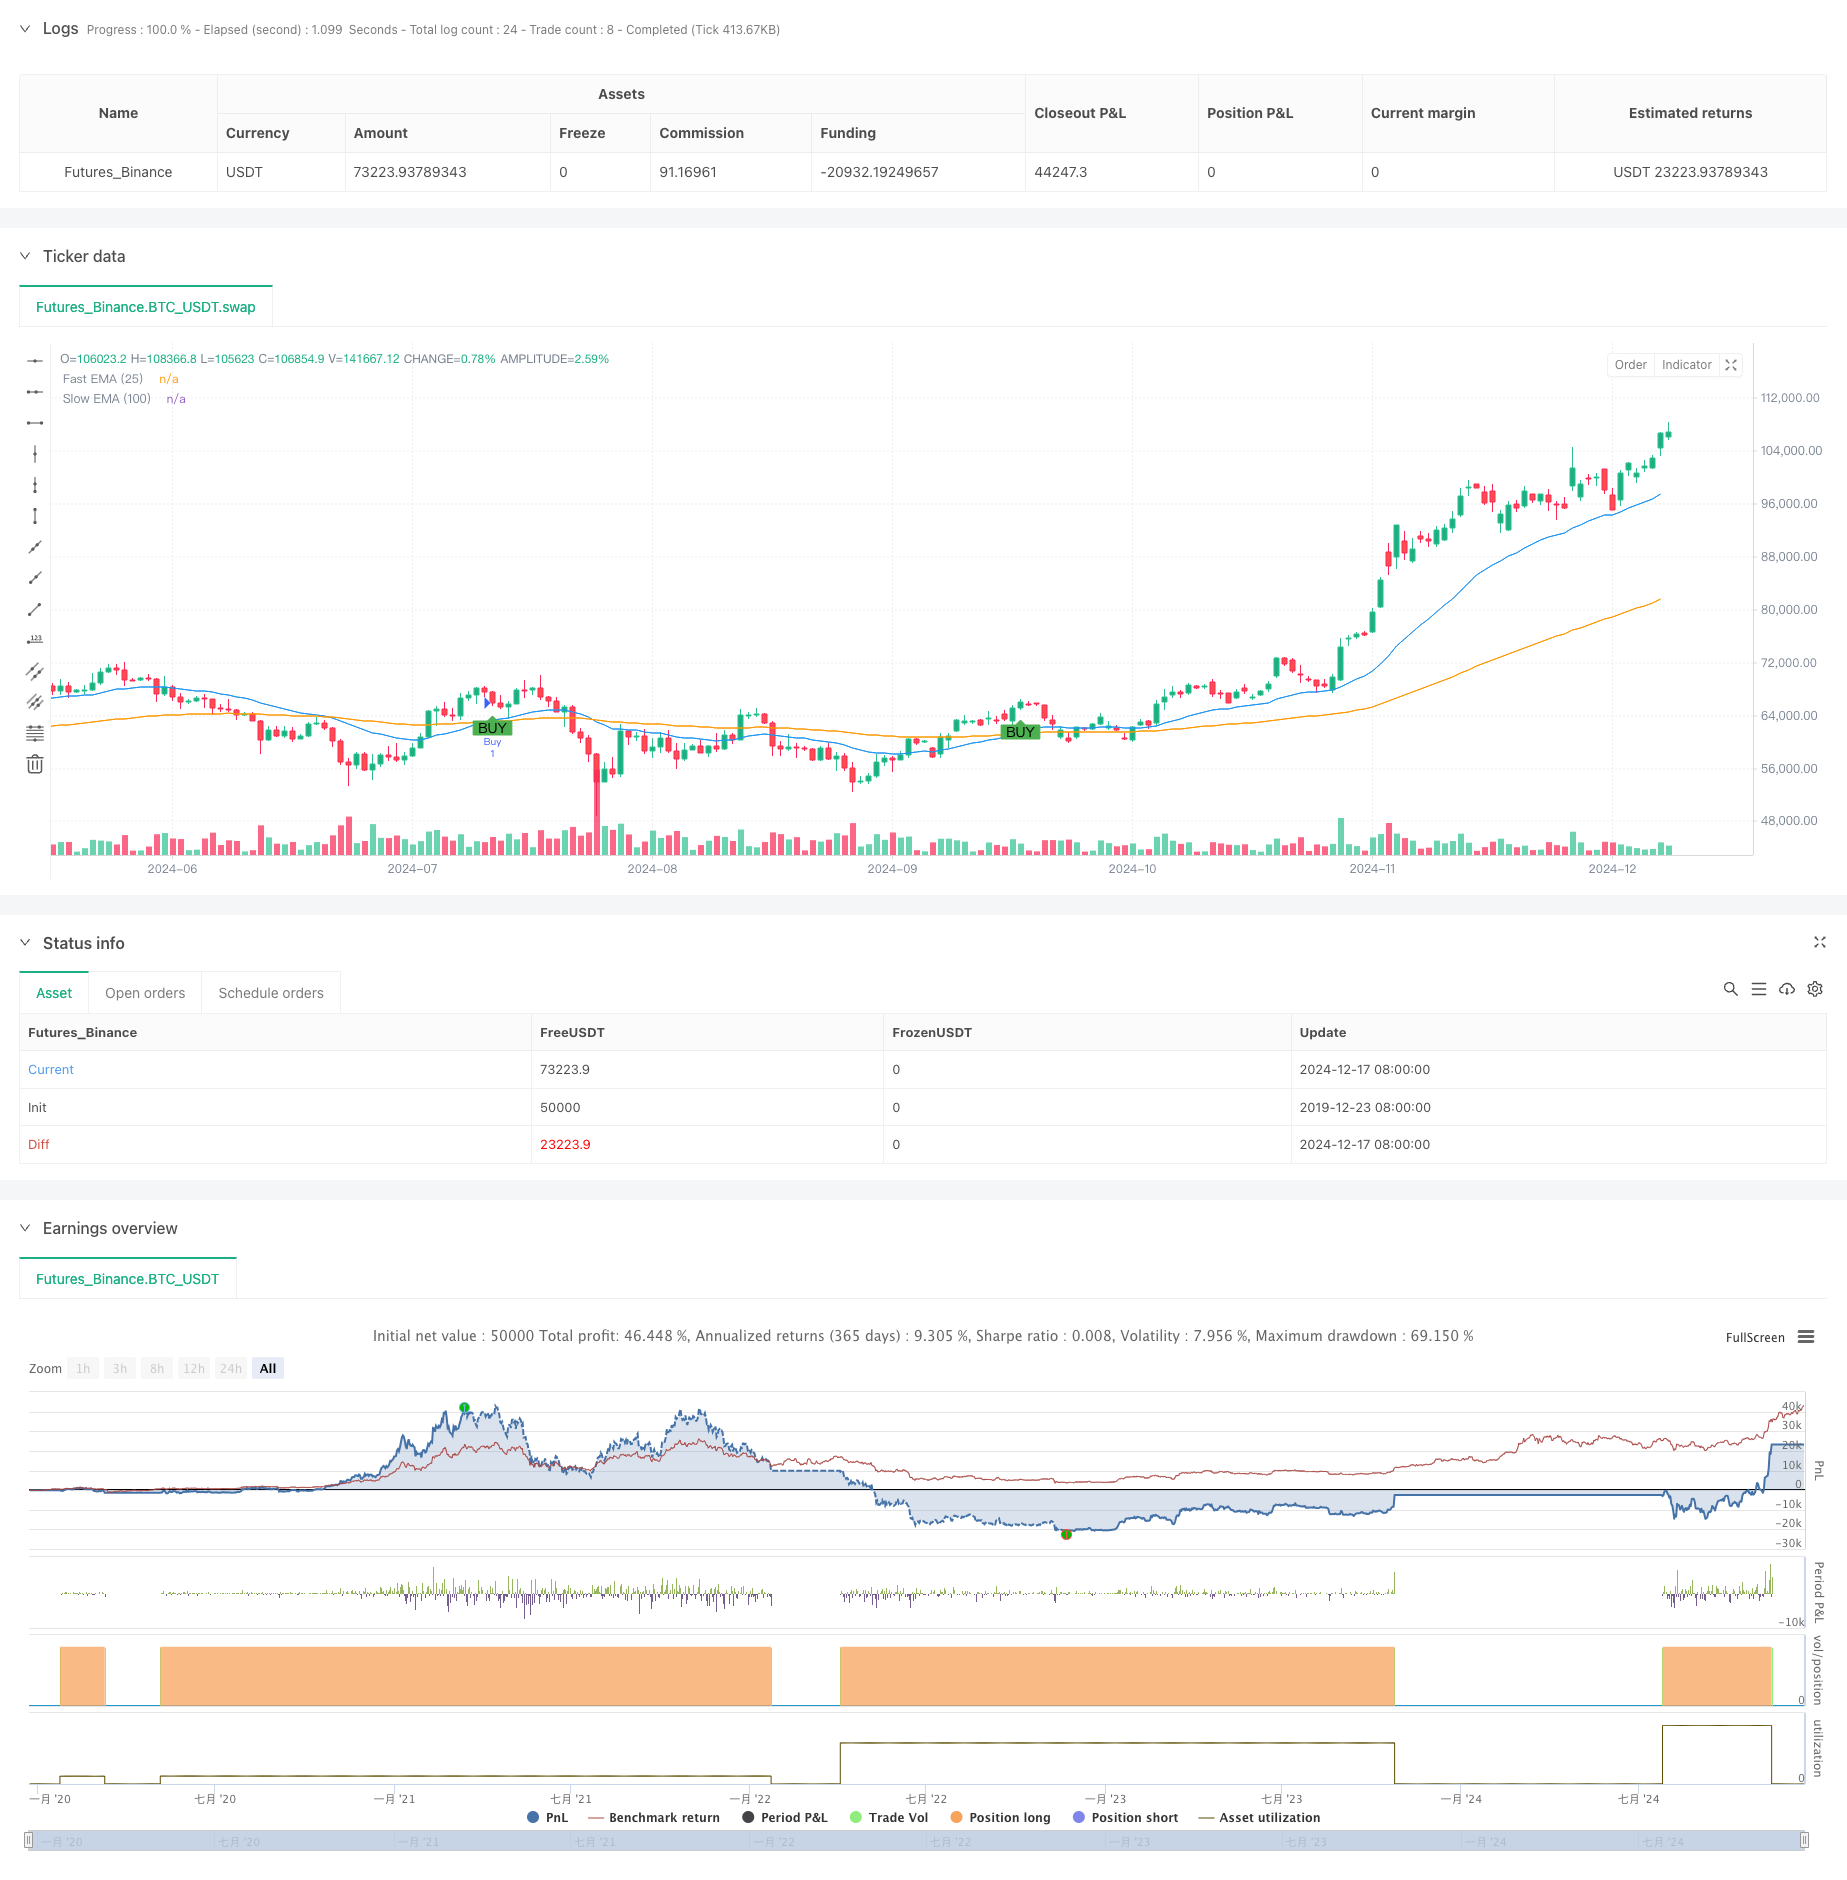
Adaptive EMA Dynamic Position Break-out Trading Strategy
Author: ChaoZhang, Date: 2024-12-20 16:33:20Tags: EMATPROI

Overview
This strategy is an adaptive trading system based on a dual moving average system, which identifies buy signals through the crossover of fast moving average (EMA25) and slow moving average (EMA100), combined with dynamic stop-loss and profit targets to optimize trading performance. The strategy adopts a breakout trading approach, focusing on risk control while ensuring returns, suitable for medium to long-term trend trading.
Strategy Principle
The core logic of the strategy includes three key components: 1. Signal System: Using EMA25 crossing above EMA100 to generate long signals, which typically indicates the beginning of an uptrend. 2. Risk Control: Using the lowest point of the most recent red candle below EMA100 as the stop-loss point, effectively preventing losses from false breakouts. 3. Profit Management: Adopting a 1:3 risk-reward ratio for profit targets, and automatically adjusting the stop-loss to breakeven when reaching 2% profit, achieving risk-free position holding.
Strategy Advantages
- High Signal Reliability: Using slow EMA for trend confirmation effectively filters false signals.
- Comprehensive Risk Control: Dynamic stop-loss settings and breakout confirmation mechanism reduce trading risks.
- Stable Return Characteristics: Reasonable risk-reward ratio setting improves strategy’s expected returns.
- High Automation Level: Includes complete signal generation, stop-loss/take-profit, and position management logic.
- Strong Adaptability: Parameters can be adjusted according to different market conditions.
Strategy Risks
- Oscillating Market Risk: May trigger frequent stop-losses in sideways markets.
- Slippage Risk: May face execution slippage during high volatility periods.
- False Breakout Risk: Moving average crossover signals may produce false breakouts.
- Parameter Sensitivity: Moving average period settings significantly impact strategy performance.
Strategy Optimization Directions
- Incorporate Volume Confirmation: Add volume indicators to the signal system to improve breakout reliability.
- Optimize Stop-Loss Mechanism: Consider introducing ATR dynamic stop-loss for better adaptability.
- Add Trend Strength Filtering: Include trend strength indicators like ADX to optimize entry timing.
- Perfect Position Management: Dynamically adjust position size based on volatility.
- Include Market Environment Assessment: Introduce market regime identification mechanism to adopt different parameter settings in different market environments.
Summary
The strategy captures trend initiation points through moving average crossovers, coupled with dynamic stop-loss and profit management mechanisms, achieving favorable risk-reward characteristics. The strategy design fully considers practical requirements and demonstrates strong practicality. Through the suggested optimization directions, the strategy’s stability and adaptability can be further enhanced. It is suitable for traders with strong risk tolerance who pursue medium to long-term stable returns.
/*backtest
start: 2019-12-23 08:00:00
end: 2024-12-18 08:00:00
period: 1d
basePeriod: 1d
exchanges: [{"eid":"Futures_Binance","currency":"BTC_USDT"}]
*/

//@version=5
strategy("EMA Crossover with TP and SL (Buy only) and Break-even", overlay=true)

// EMA sozlamalari
emaFastLength = input.int(25, title="Fast EMA Length")
emaSlowLength = input.int(100, title="Slow EMA Length")

// Hisoblash
emaFast = ta.ema(close, emaFastLength)
emaSlow = ta.ema(close, emaSlowLength)

// Kesishishni aniqlash
bullishCross = ta.crossover(emaFast, emaSlow) // EMA 25 EMA 100 ni yuqoriga kesib o'tganda

// EMA 100 tagidagi oxirgi qizil shamning tagini olish
lastRedCandleLow = ta.valuewhen(close < open and close < emaSlow, low, 0) // EMA 100 pastidagi qizil shamning tagi

// TP va SL darajalarini hisoblash
longSL = lastRedCandleLow
longTP = close + 3 * (close - longSL) // TP SL ga nisbatan 1:2 masofada

// Savdoni ochish va 2% foyda bo'lganda SLni break-even ga o‘zgartirish
if (bullishCross)
    strategy.entry("Buy", strategy.long)  // Buy pozitsiyasini ochish
    strategy.exit("Exit Buy", "Buy", stop=longSL, limit=longTP)  // SL va TP qo'yish

    // 2% foyda bo'lganda SLni break-even ga o'zgartirish
    if (strategy.position_size > 0)
        profitPercentage = (close - strategy.position_avg_price) / strategy.position_avg_price * 100
        if (profitPercentage >= 2)
            strategy.exit("Exit Buy BE", "Buy", stop=strategy.position_avg_price) // SLni break-even ga o'zgartirish

// Signalni ko'rsatish
plotshape(bullishCross, title="Buy Signal", location=location.belowbar, color=color.green, style=shape.labelup, text="BUY")

// // TP va SL chizish
// if (bullishCross)
//     line.new(x1=bar_index, y1=longSL, x2=bar_index+1, y2=longSL, color=color.red, width=1, extend=extend.none)
//     line.new(x1=bar_index, y1=longTP, x2=bar_index+1, y2=longTP, color=color.green, width=1, extend=extend.none)
//     label.new(bar_index, longSL, text="SL: " + str.tostring(longSL), style=label.style_label_down, color=color.red, textcolor=color.white, size=size.small)
//     label.new(bar_index, longTP, text="TP: " + str.tostring(longTP), style=label.style_label_up, color=color.green, textcolor=color.white, size=size.small)

// EMA chizish
plot(emaFast, color=color.blue, title="Fast EMA (25)")
plot(emaSlow, color=color.orange, title="Slow EMA (100)")

// Alert qo'shish
alertcondition(bullishCross, title="Buy Signal Alert", message="EMA 25 crossed above EMA 100! Buy Signal!")
- EMA Trend with Round Number Breakout Trading Strategy
- Dual EMA Trend-Following Strategy with Limit Buy Entry
- EMA Crossover Trading Strategy with Dynamic Take Profit and Stop Loss
- Williams %R Dynamic TP/SL Adjustment Strategy
- EMA Crossover with Dual Take Profit and Stop Loss Strategy
- Adaptive Trend-Following Trading Strategy: 200 EMA Breakout with Dynamic Risk Management System
- Dynamic ATR-Adjusted EMA Crossover Strategy
- Advanced EMA Crossover Strategy: Adaptive Trading System with Dynamic Stop-Loss and Take-Profit Targets
- Multi-Timeframe Exponential Moving Average Crossover Strategy
- Automated Quantitative Trading System with Dual EMA Crossover and Risk Management
- AI-Powered Volatility Price System Divergence Trading Strategy
- Multi-EMA Trend-Following Swing Trading Strategy with ATR-Based Risk Management
- Enhanced Mean Reversion Strategy with Bollinger Bands and RSI Integration
- Multi-Period RSI Divergence with Support/Resistance Quantitative Trading Strategy
- Adaptive Trend Following Strategy with Dynamic Drawdown Control System
- Multi-EMA Golden Cross Strategy with Tiered Take-Profit
- Multi-Technical Indicator Cross-Trend Tracking Strategy: RSI and Stochastic RSI Synergy Trading System
- Dynamic Buy Entry Strategy Combining EMA Crossing and Candle Body Penetration
- Intelligent Wave-Trend Dollar Cost Averaging Cyclical Trading Strategy
- MACD-RSI Crossover Trend Following Strategy with Bollinger Bands Optimization System
- Multi-Indicator Dynamic Trading Optimization Strategy
- Multi-SMA Zone Breakout with Dynamic Profit Lock Quantitative Trading Strategy
- Dynamic Wave-Trend Tracking Strategy
- Break of Structure with Volume Confirmation Multi-Condition Intelligent Trading Strategy
- Multi-Indicator Dynamic Stop-Loss Momentum Trend Trading Strategy
- Multi-Condition Trend Following Quantitative Trading Strategy Based on Fibonacci Retracement Levels
- Multi-Moving Average Trend Following Trading Strategy
- Multi-Filter Trend Breakthrough Smart Moving Average Trading Strategy
- Dynamic EMA Breakthrough and Reversal Strategy
- Dynamic Trend Momentum Optimization Strategy with G-Channel Indicator