Adaptive Multi-State EMA-RSI Momentum Strategy with Choppiness Index Filter System
Author: ChaoZhang, Date: 2024-12-27 14:05:32Tags: CIRSIEMAATR

Overview
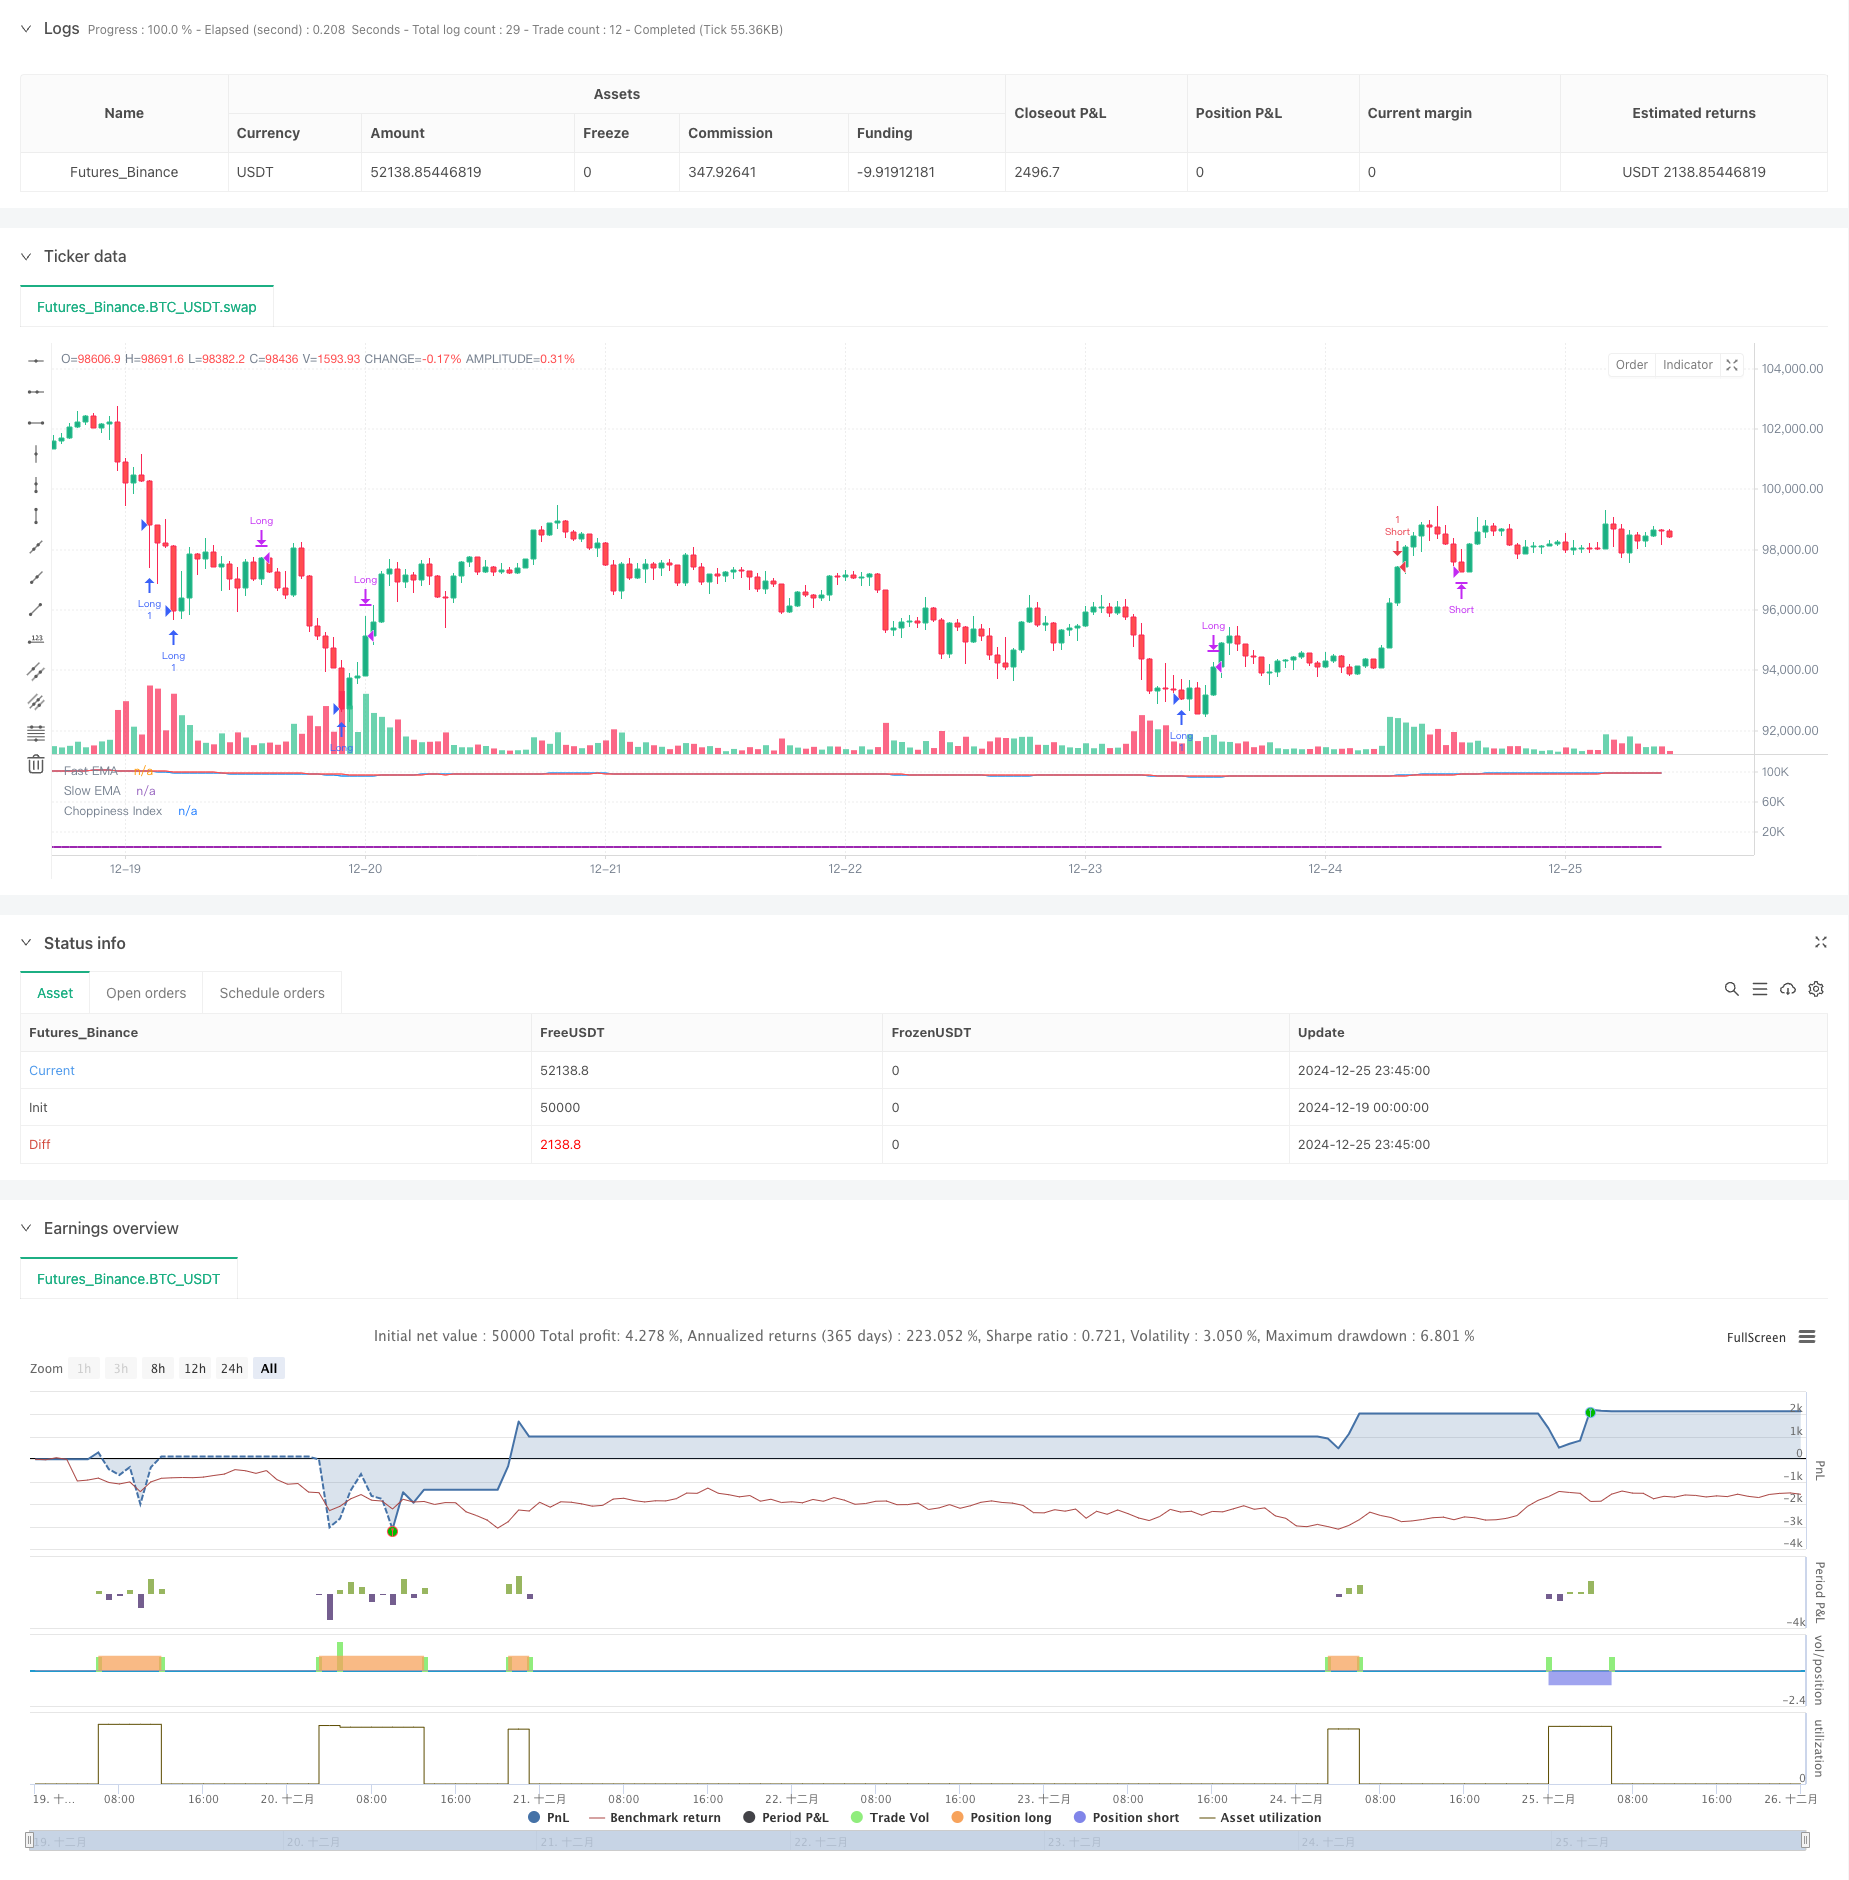
This strategy is an adaptive system combining trend following and range trading, using the Choppiness Index (CI) to determine market conditions and applying corresponding trading logic. In trending markets, the strategy utilizes EMA crossovers and RSI overbought/oversold signals for trading; in ranging markets, it primarily relies on RSI extreme values. The strategy also includes stop-loss and take-profit mechanisms to control risk and lock in profits.
Strategy Principles
The core of the strategy lies in using the Choppiness Index (CI) to classify the market into trending (CI<38.2) and ranging (CI>61.8) states. In trending markets, long positions are opened when the fast EMA (9-period) crosses above the slow EMA (21-period) and RSI is below 70, while short positions are opened when the slow EMA crosses above the fast EMA and RSI is above 30. In ranging markets, long positions are opened when RSI is below 30, and short positions when RSI is above 70. The strategy includes corresponding exit conditions with 2% stop-loss and 4% take-profit levels.
Strategy Advantages
- High market adaptability: Identifies market states through CI indicator, enabling flexible strategy switching in different market environments
- Multiple signal confirmation: Combines moving averages, momentum indicators, and volatility index for improved signal reliability
- Comprehensive risk management: Includes stop-loss and take-profit mechanisms for effective risk control
- Clear trading logic: Distinguishes between trending and ranging market states with explicit trading rules
- High win rate: Demonstrates 70-80% win rate on 15-minute timeframe
Strategy Risks
- Parameter sensitivity: Multiple technical indicators require complex parameter optimization
- False breakout risk: Potential false signals during market state transitions
- Slippage impact: Possible significant slippage in low liquidity market conditions
- Overtrading: Frequent market state transitions may lead to excessive trading
- Market dependency: Strategy performance may be heavily influenced by specific market conditions
Strategy Optimization Directions
- Dynamic parameter optimization: Adjust indicator parameters based on different market environments
- Additional filters: Add volume and volatility filters to improve signal quality
- Stop-loss optimization: Consider dynamic stop-loss mechanisms like ATR stops or trailing stops
- State identification improvement: Refine market state classification, add neutral market handling logic
- Signal confirmation system development: Implement additional signal confirmation mechanisms to reduce false signals
Summary
This strategy builds an adaptive trading system by combining multiple technical indicators, maintaining stable performance across different market environments. Its core advantages lie in market adaptability and comprehensive risk management mechanisms, while attention must be paid to parameter optimization and market condition dependencies. Through continuous optimization and improvement, the strategy shows promise for achieving better trading results across various market conditions.
/*backtest
start: 2024-12-19 00:00:00
end: 2024-12-26 00:00:00
period: 45m
basePeriod: 45m
exchanges: [{"eid":"Futures_Binance","currency":"BTC_USDT"}]
*/

// This Pine Script™ code is subject to the terms of the Mozilla Public License 2.0 at https://mozilla.org/MPL/2.0/
// © nopology

//@version=6

strategy("CI, EMA, RSI", overlay=false)

// Input parameters
lengthCI = input(14, title="CI Length")
lengthRSI = input(14, title="RSI Length")
fastLength = input(9, title="Fast EMA Length")
slowLength = input(21, title="Slow EMA Length")

// Calculate CI
atr = ta.atr(lengthCI)
highLowRange = math.log10(math.max(high[lengthCI], high) - math.min(low[lengthCI], low))
sumATR = math.sum(atr, lengthCI)
ci = 100 * (math.log10(sumATR / highLowRange) / math.log10(lengthCI))

// Calculate RSI
rsi = ta.rsi(close, lengthRSI)

// Calculate EMAs
fastEMA = ta.ema(close, fastLength)
slowEMA = ta.ema(close, slowLength)

// Define conditions
trendingMarket = ci < 38.2
rangingMarket = ci > 61.8
bullishSignal = ta.crossover(fastEMA, slowEMA) and rsi < 70
bearishSignal = ta.crossover(slowEMA, fastEMA) and rsi > 30

// Plot indicators for visualization
plot(ci, title="Choppiness Index", color=color.purple, linewidth=2)
plot(fastEMA, title="Fast EMA", color=color.blue)
plot(slowEMA, title="Slow EMA", color=color.red)

// Strategy Execution
if (trendingMarket)
    if (bullishSignal)
        strategy.entry("Long", strategy.long)
    if (bearishSignal)
        strategy.entry("Short", strategy.short)
else if (rangingMarket)
    if (rsi < 30)
        strategy.entry("Long", strategy.long)
    if (rsi > 70)
        strategy.entry("Short", strategy.short)

// Close positions when conditions no longer met or reverse
if (trendingMarket and not bullishSignal)
    strategy.close("Long")
if (trendingMarket and not bearishSignal)
    strategy.close("Short")
if (rangingMarket and rsi > 40)
    strategy.close("Long")
if (rangingMarket and rsi < 60)
    strategy.close("Short")

// Optional: Add stop loss and take profit
stopLossPerc = input.float(2, title="Stop Loss (%)", minval=0.1, step=0.1) / 100
takeProfitPerc = input.float(4, title="Take Profit (%)", minval=0.1, step=0.1) / 100

strategy.exit("Exit Long", "Long", stop=close*(1-stopLossPerc), limit=close*(1+takeProfitPerc))
strategy.exit("Exit Short", "Short", stop=close*(1+stopLossPerc), limit=close*(1-takeProfitPerc))
- EMA RSI Crossover Strategy
- Han Yue - Trend Following Trading Strategy Based on Multiple EMAs, ATR and RSI
- 4-Hour Timeframe Engulfing Pattern Trading Strategy with Dynamic Take Profit and Stop Loss Optimization
- Gold Trend Channel Reversal Momentum Strategy
- ATR-RSI Enhanced Trend Following Trading System
- RSI50_EMA Long Only Strategy
- Dynamic Stop-Loss Multi-Period RSI Trend Following Strategy
- Multi-Indicator Intelligent Pyramiding Strategy
- Multi-Timeframe Exponential Moving Average Crossover Strategy with Risk-Reward Optimization
- AlphaTradingBot Trading Strategy
- Multi-SMA and Stochastic Combined Trend Following Trading Strategy
- Adaptive Dynamic Trading Strategy Based on Standardized Logarithmic Returns
- Multi-Indicator Cross-Trend Following Trading Strategy: Quantitative Analysis Based on Stochastic RSI and Moving Average System
- Multi-Indicator Trend Crossing Strategy: Bull Market Support Band Trading System
- Multi-Level Dynamic MACD Trend Following Strategy with 52-Week High/Low Extension Analysis System
- Dual EMA RSI Momentum Trend Reversal Trading System - A Momentum Breakthrough Strategy Based on EMA and RSI Crossover
- Multi-Indicator High-Frequency Range Trading Strategy
- Dynamic Trendline Breakout Reversal Trading Strategy
- Multi-Indicator Dynamic Trend Following Strategy Based on EMA and SMA
- Enhanced Fibonacci Trend Following and Risk Management Strategy
- Intelligent Exponential Moving Average Trading Strategy Optimization System
- AI-Powered Volatility Price System Divergence Trading Strategy
- Multi-EMA Trend-Following Swing Trading Strategy with ATR-Based Risk Management
- Enhanced Mean Reversion Strategy with Bollinger Bands and RSI Integration
- Multi-Period RSI Divergence with Support/Resistance Quantitative Trading Strategy
- Adaptive Trend Following Strategy with Dynamic Drawdown Control System
- Multi-EMA Golden Cross Strategy with Tiered Take-Profit
- Multi-Technical Indicator Cross-Trend Tracking Strategy: RSI and Stochastic RSI Synergy Trading System
- Dynamic Buy Entry Strategy Combining EMA Crossing and Candle Body Penetration
- Intelligent Wave-Trend Dollar Cost Averaging Cyclical Trading Strategy