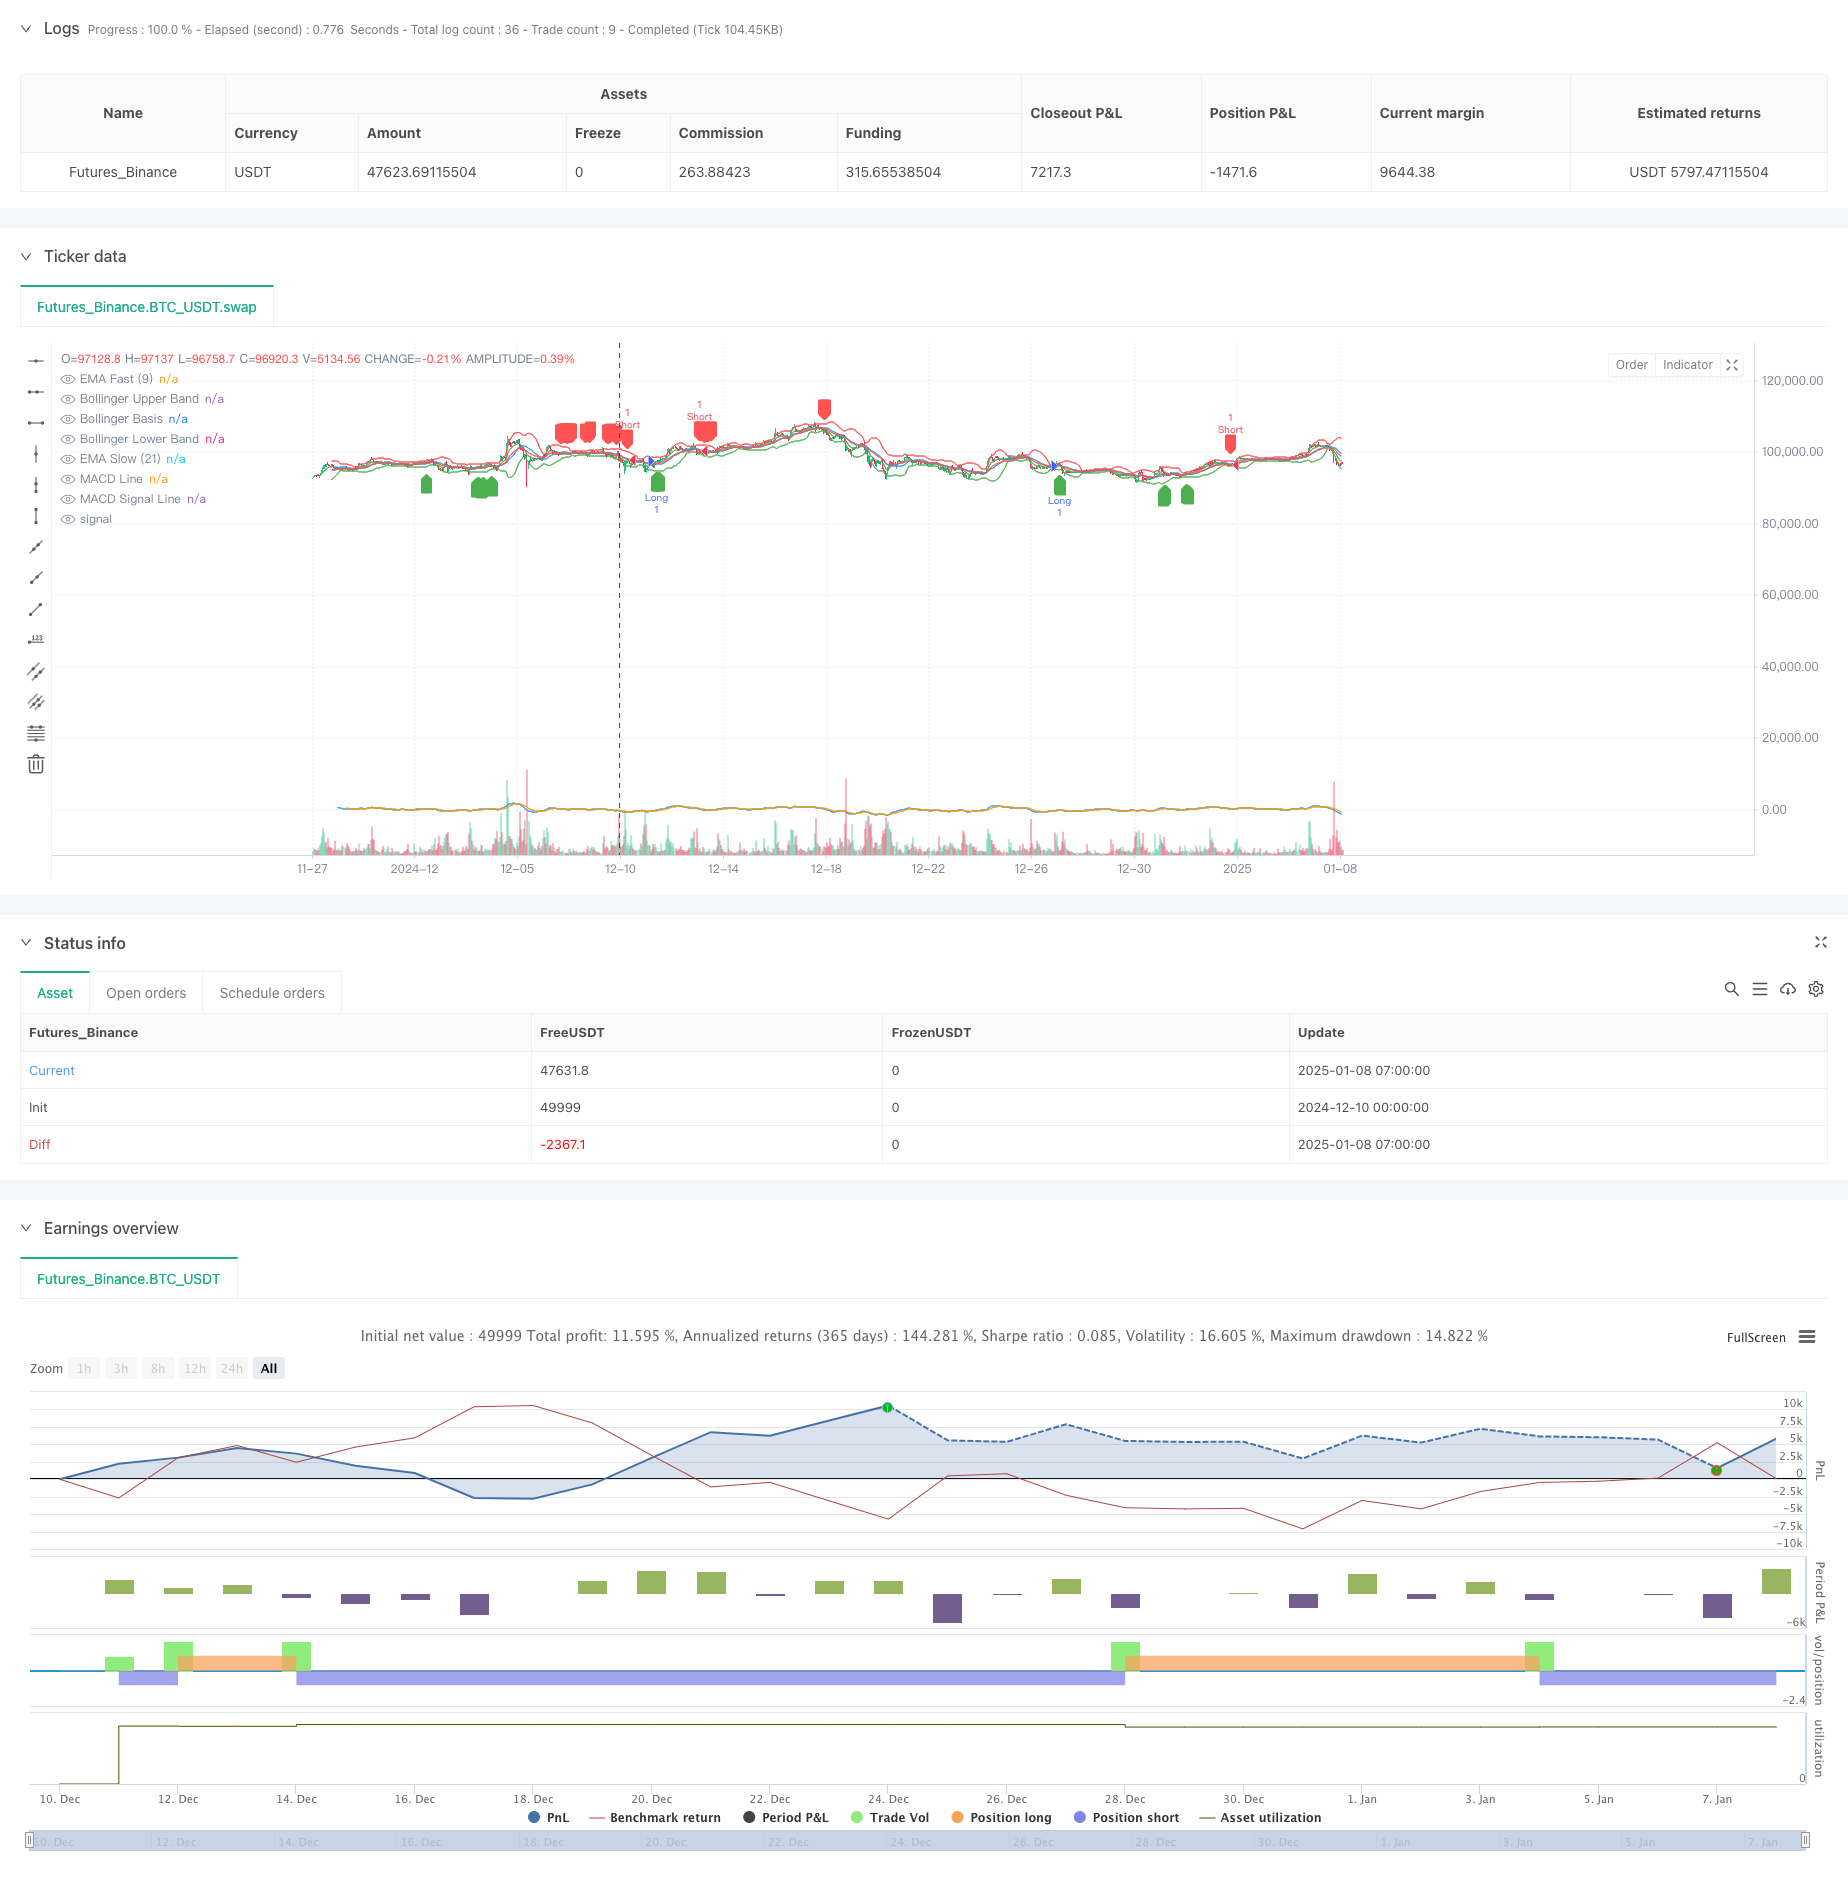
Multi-Indicator Trend Momentum Trading Strategy: An Optimized Quantitative Trading System Based on Bollinger Bands, Fibonacci and ATR
Author: ChaoZhang, Date: 2025-01-10 16:22:55Tags: MACDRSIEMABBATRFIBOSMAMSD

Overview
This strategy is a multi-dimensional technical analysis trading system that combines momentum indicators (RSI, MACD), trend indicators (EMA), volatility indicators (Bollinger Bands, ATR), and price structure indicators (Fibonacci retracements) to capture market opportunities through multi-dimensional signal coordination. The strategy is optimized for 15-minute timeframes and employs ATR-based dynamic stop-loss and take-profit levels, demonstrating strong risk control capabilities.
Strategy Principles
The core logic includes the following dimensions: 1. Trend Confirmation: Using 9⁄21 period EMA crossovers to determine trend direction 2. Momentum Verification: Combining RSI overbought/oversold (55⁄45) and MACD histogram for momentum validation 3. Volatility Reference: Using Bollinger Bands (20 periods, 2 standard deviations) to measure price volatility 4. Support/Resistance: Fibonacci 0.382⁄0.618⁄0.786 levels calculated from 100-period high/low 5. Risk Management: 1.5x ATR stop-loss and 3x ATR take-profit based on 14-period ATR
Trading occurs only when multiple dimensional signals align, improving trading accuracy.
Strategy Advantages
- Multi-dimensional signal cross-validation reduces false signals
- Dynamic ATR-based stop-loss and take-profit adapts to different market conditions
- Integration of classic technical indicators makes it easy to understand and maintain
- Precise entry timing improves win rate
- Risk-reward ratio of 1:2 meets professional trading standards
- Suitable for highly volatile market environments
Strategy Risks
- Parameter optimization may lead to overfitting
- Multiple signal conditions might miss some market moves
- Fixed multiplier stops may fail in extreme market conditions
- High computational resource requirements
- Trading costs may impact strategy performance
Strategy Optimization Directions
- Introduce volume factors to verify signal strength
- Dynamically adjust RSI thresholds for different markets
- Add trend strength filters
- Optimize stop-loss and take-profit multipliers
- Add time filters to avoid ranging markets
- Consider implementing machine learning for dynamic parameter optimization
Summary
This strategy builds a robust trading system through the coordination of multi-dimensional technical indicators. Its core advantages lie in signal cross-validation and dynamic risk control, but attention must be paid to parameter optimization and market environment adaptability. Future optimization should focus on dynamic parameter adjustment and signal quality improvement.
/*backtest
start: 2024-12-10 00:00:00
end: 2025-01-08 08:00:00
period: 1h
basePeriod: 1h
exchanges: [{"eid":"Futures_Binance","currency":"BTC_USDT","balance":49999}]
*/

//@version=5
strategy("Optimized Advanced Strategy", overlay=true)

// Bollinger Bandı
length = input(20, title="Bollinger Band Length")
src = close
mult = input.float(2.0, title="Bollinger Band Multiplier")
basis = ta.sma(src, length)
dev = mult * ta.stdev(src, length)
upper = basis + dev
lower = basis - dev

// RSI
rsi = ta.rsi(close, 14)

// MACD
[macdLine, signalLine, _] = ta.macd(close, 12, 26, 9)

// EMA
emaFast = ta.ema(close, 9)
emaSlow = ta.ema(close, 21)

// ATR
atr = ta.atr(14)

// Fibonacci Seviyeleri
lookback = input(100, title="Fibonacci Lookback Period")
highPrice = ta.highest(high, lookback)
lowPrice = ta.lowest(low, lookback)
fiboLevel618 = lowPrice + (highPrice - lowPrice) * 0.618
fiboLevel382 = lowPrice + (highPrice - lowPrice) * 0.382
fiboLevel786 = lowPrice + (highPrice - lowPrice) * 0.786

// Kullanıcı Ayarlı Stop-Loss ve Take-Profit
stopLossATR = atr * 1.5
takeProfitATR = atr * 3

// İşlem Koşulları
longCondition = (rsi < 55) and (macdLine > signalLine) and (emaFast > emaSlow) and (close >= fiboLevel382 and close <= fiboLevel618)
shortCondition = (rsi > 45) and (macdLine < signalLine) and (emaFast < emaSlow) and (close >= fiboLevel618 and close <= fiboLevel786)

// İşlem Girişleri
if (longCondition)
    strategy.entry("Long", strategy.long, stop=close - stopLossATR, limit=close + takeProfitATR, comment="LONG SIGNAL")

if (shortCondition)
    strategy.entry("Short", strategy.short, stop=close + stopLossATR, limit=close - takeProfitATR, comment="SHORT SIGNAL")

// Bollinger Bandını Çizdir
plot(upper, color=color.red, title="Bollinger Upper Band")
plot(basis, color=color.blue, title="Bollinger Basis")
plot(lower, color=color.green, title="Bollinger Lower Band")

// Fibonacci Seviyelerini Çizdir
// line.new(x1=bar_index[1], y1=fiboLevel382, x2=bar_index, y2=fiboLevel382, color=color.blue, width=1, style=line.style_dotted)
// line.new(x1=bar_index[1], y1=fiboLevel618, x2=bar_index, y2=fiboLevel618, color=color.orange, width=1, style=line.style_dotted)
// line.new(x1=bar_index[1], y1=fiboLevel786, x2=bar_index, y2=fiboLevel786, color=color.purple, width=1, style=line.style_dotted)

// Göstergeleri Görselleştir
plot(macdLine, color=color.blue, title="MACD Line")
plot(signalLine, color=color.orange, title="MACD Signal Line")
plot(emaFast, color=color.green, title="EMA Fast (9)")
plot(emaSlow, color=color.red, title="EMA Slow (21)")

// İşlem İşaretleri
plotshape(series=longCondition, location=location.belowbar, color=color.green, style=shape.labelup, title="Long Entry")
plotshape(series=shortCondition, location=location.abovebar, color=color.red, style=shape.labeldown, title="Short Entry")
- No Upper Wick Bullish Candle Breakout Strategy
- Multi-Indicator Dynamic Stop-Loss Momentum Trend Trading Strategy
- Multi-Indicator Comprehensive Trading Strategy: Perfect Combination of Momentum, Overbought/Oversold, and Volatility
- Multi-Period Exponential Moving Average Crossover Strategy with Options Trading Suggestion System
- Golden Momentum Capture Strategy: Multi-Timeframe Exponential Moving Average Crossover System
- Multi-Technical Indicator Trend Following Strategy with RSI Momentum Filter
- Multi-EMA Trend Following Strategy with Dynamic ATR Targets
- Short-term Short Selling Strategy for High-liquidity Currency Pairs
- Multi-Technical Indicator Synergistic Trading System
- Multi-Technical Indicator Dynamic Adaptive Trading Strategy (MTDAT)
- Multi-EMA Crossover Trend Following Quantitative Trading Strategy
- Multi-level Indicator Overlapping RSI Trading Strategy
- Bollinger Bands and Fibonacci Intraday Trend Following Strategy
- Dynamic Trend Following Dual Moving Average Channel Strategy with Risk Management System
- Multi-Mode Take Profit/Stop Loss Trend Following Strategy Based on EMA, Madrid Ribbon and Donchian Channel
- Dynamic RSI-Price Divergence Detection and Adaptive Trading Strategy System
- Multi-Dimensional Trend Following Pyramid Trading Strategy
- Triple Bottom Rebound Momentum Breakthrough Strategy
- Dual Timeframe Trend Reversal Candlestick Pattern Quantitative Trading Strategy
- High-Frequency Price-Volume Trend Following with Volume Analysis Adaptive Strategy
- Enhanced Price-Volume Trend Momentum Strategy
- Intelligent Moving Average Crossover Strategy with Dynamic Profit/Loss Management System
- Adaptive Multi-MA Momentum Breakthrough Trading Strategy
- Adaptive Momentum Mean-Reversion Crossover Strategy
- Adaptive Dual-Direction EMA Trend Trading System with Reverse Trade Optimization Strategy