概述
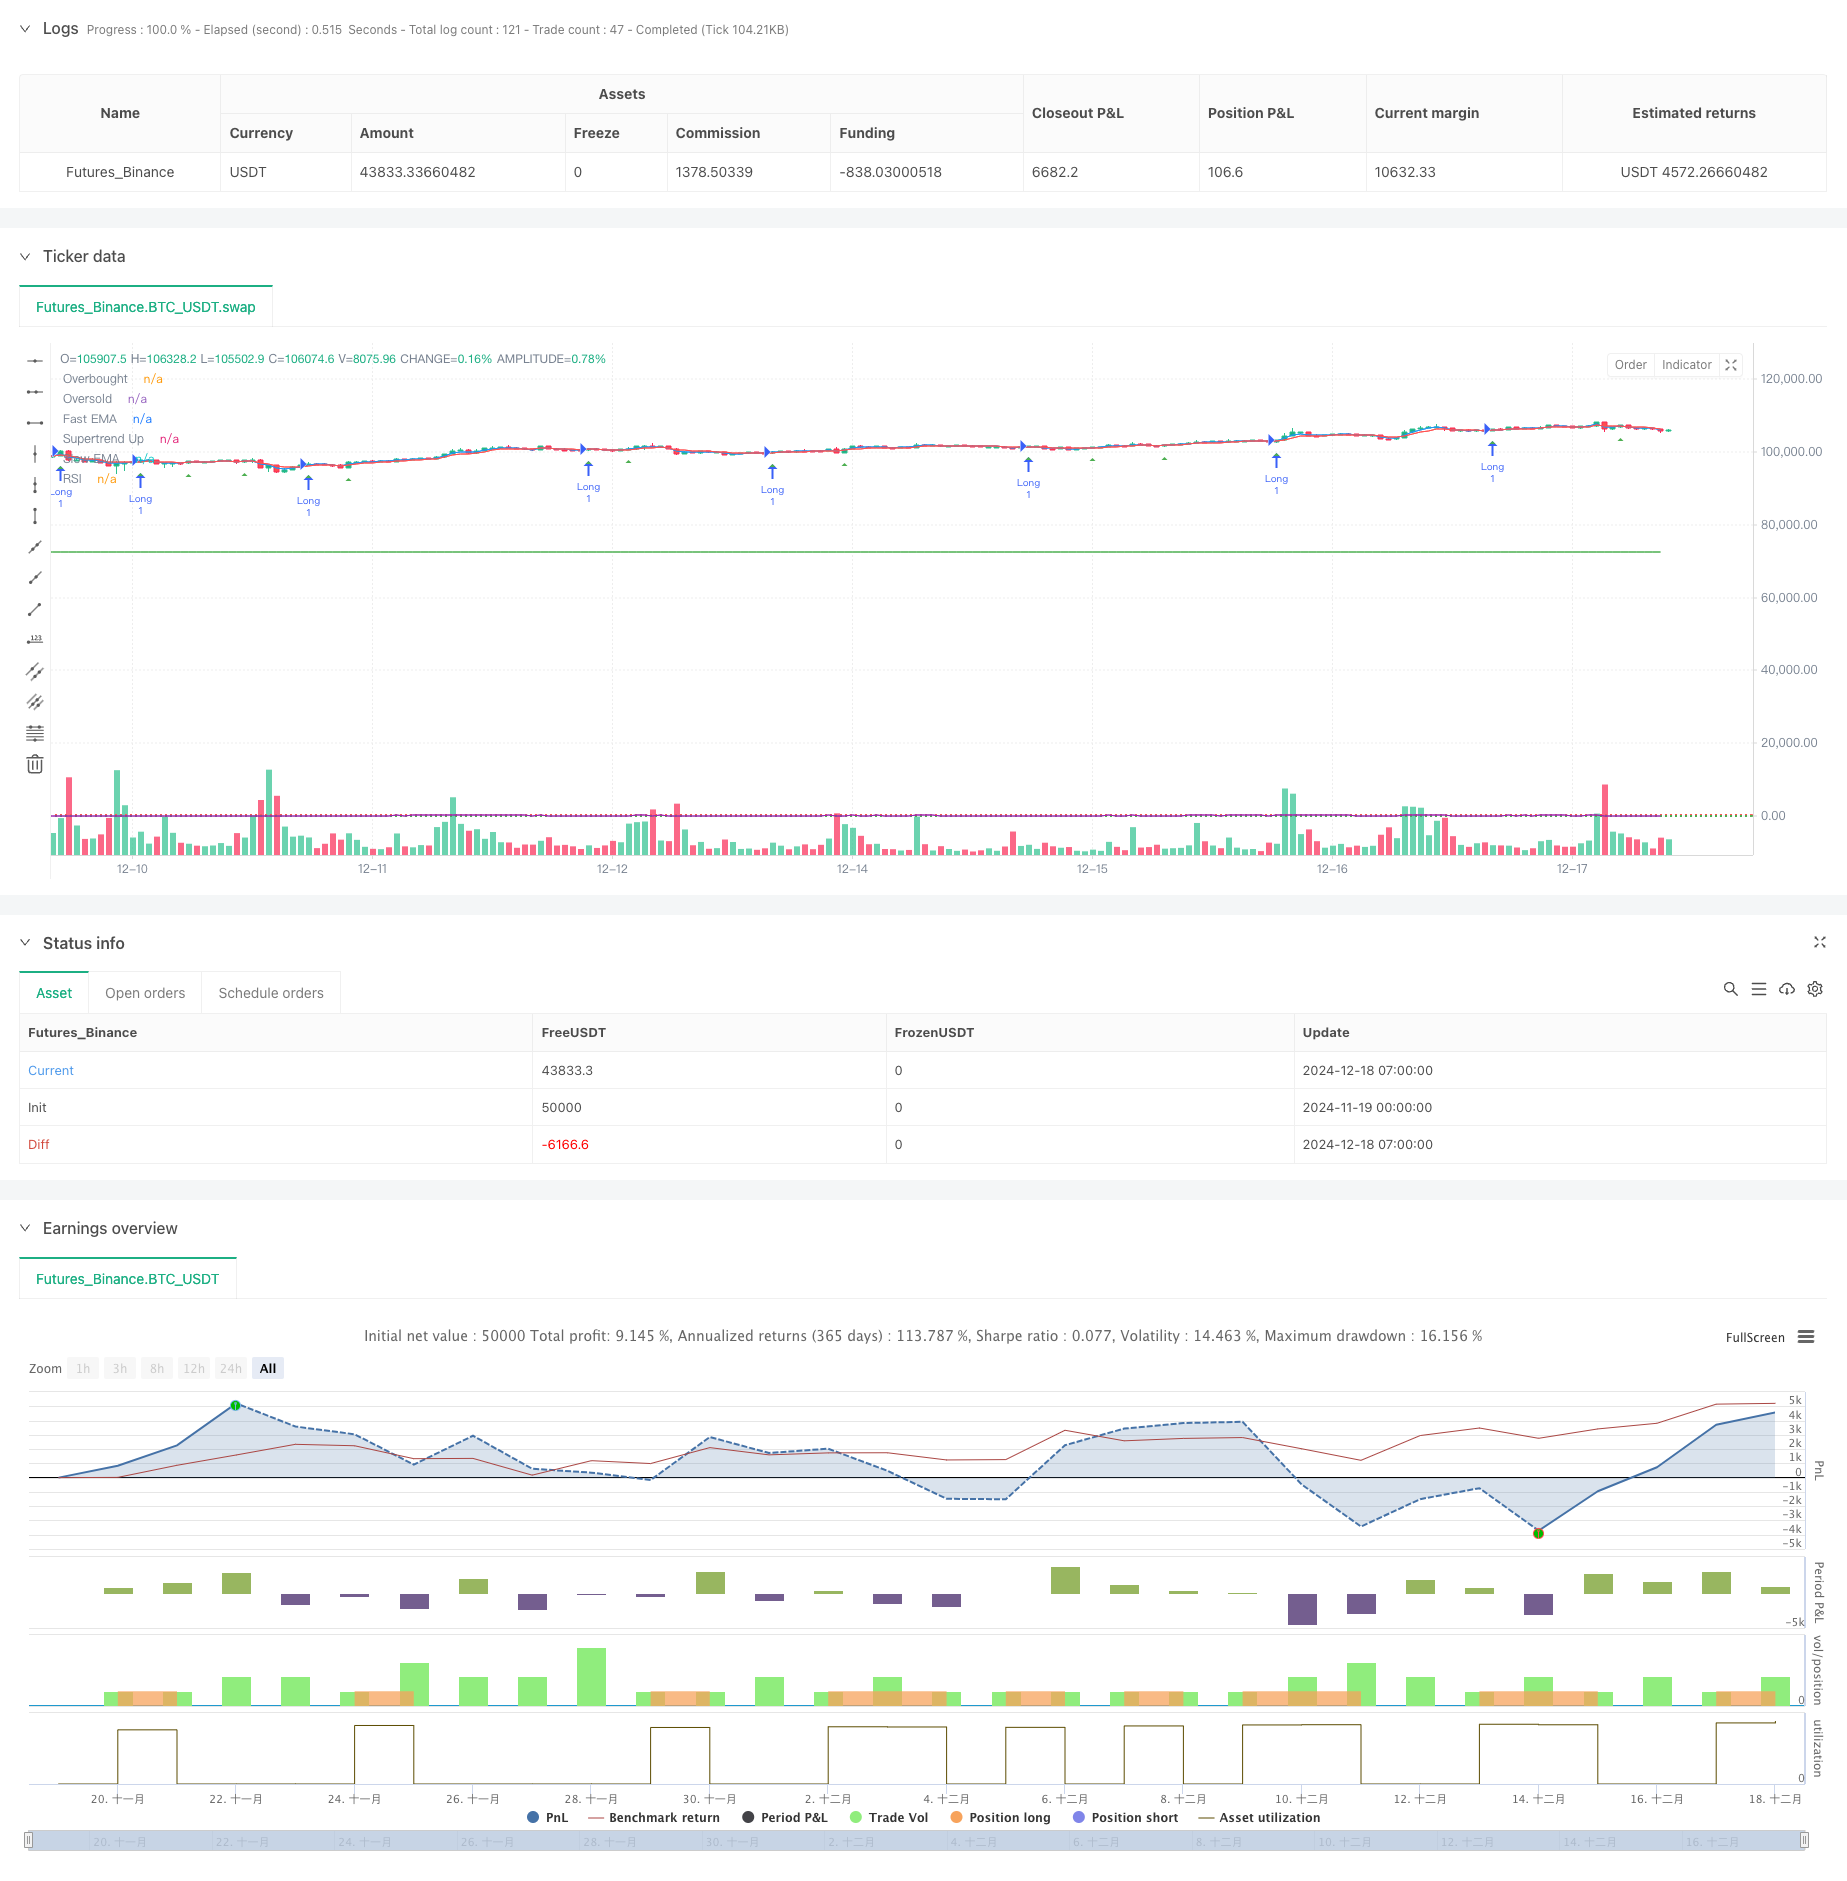
这是一个结合了多个技术指标的趋势跟踪策略,主要使用了快慢指数移动平均线(EMA)交叉、Supertrend趋势指标以及相对强弱指标(RSI)来识别交易机会。该策略通过指标的有机结合,在趋势跟踪的基础上增加了动量过滤,同时利用ATR动态调整止损止盈位置,实现了一个完整的交易系统。
策略原理
策略采用了三重过滤机制来确定交易信号: 1. EMA交叉系统用于捕捉短期趋势变化,当快速EMA上穿慢速EMA时产生做多信号,下穿时产生做空信号。 2. Supertrend指标基于ATR计算动态支撑/阻力线,用于确认整体趋势方向。只有当价格位于Supertrend线上方时才允许做多,位于线下方时才允许做空。 3. RSI指标用于过滤过度买入或卖出的市场状态。在RSI未达到超买区域时才允许做多,未达到超卖区域时才允许做空。
策略还包含了基于ATR的动态止损止盈系统,可以根据市场波动性自动调整风险管理参数。同时通过时间过滤器限制交易时间段,以避免低流动性期间的交易。
策略优势
- 多重技术指标的结合提供了更可靠的交易信号,避免了单一指标可能带来的虚假信号。
- 动态的止损止盈设置能够适应不同的市场波动状况,在波动性较大时给予交易更大的呼吸空间。
- RSI过滤机制有效降低了在市场极端状态下入场的风险。
- 时间过滤功能允许交易者专注于特定的交易时段,避免低效率时段的交易。
策略风险
- 多重过滤条件可能导致错过一些潜在的交易机会。
- 在快速波动的市场中,止损位可能被轻易触及。
- 参数优化过度可能导致过拟合问题。
- 高频交易可能带来较高的交易成本。
策略优化方向
- 可以考虑增加成交量指标作为辅助确认。
- 引入自适应的参数调整机制,使策略能够更好地适应不同市场环境。
- 加入趋势强度过滤器,以避免在弱趋势市场中过度交易。
- 开发更智能的仓位管理系统,根据市场状况动态调整持仓比例。
总结
该策略通过结合多个技术指标和过滤条件,构建了一个相对完整的交易系统。其核心优势在于多重确认机制和动态风险管理,但同时也需要注意参数优化和交易成本等问题。通过持续优化和改进,该策略有望在不同市场环境下保持稳定的表现。
策略源码
/*backtest
start: 2024-11-19 00:00:00
end: 2024-12-18 08:00:00
period: 1h
basePeriod: 1h
exchanges: [{"eid":"Futures_Binance","currency":"BTC_USDT"}]
*/

//@version=5
strategy(title="Supertrend + EMA Crossover with RSI Filter", shorttitle="ST_EMA_RSI", overlay=true)

// Input parameters for EMA
fastEMA          = input.int(3,  title="Fast EMA Period", minval=1)
slowEMA          = input.int(6,  title="Slow EMA Period", minval=1)
atrLength        = input.int(3,  title="ATR Length", minval=1)

// Using a fixed multiplier for Supertrend calculation
stMultiplier = 1

// Stop loss and take profit multipliers
stopLossATR      = input.float(2.5, title="Stop Loss ATR Multiplier", minval=0.1, step=0.1)
takeProfitATR    = input.float(4,   title="Take Profit ATR Multiplier", minval=0.1, step=0.1)

// RSI inputs
rsiLength      = input.int(10, title="RSI Length", minval=1)
rsiOverbought  = input.float(65, title="RSI Overbought Level", minval=50.0, maxval=100.0)
rsiOversold    = input.float(30.0, title="RSI Oversold Level",   minval=0.0, maxval=50.0)

// Declare the RSI plot toggle input as a global variable
bool rsiPlotEnabled = input.bool(true, title="Show RSI in separate panel")

// Time filter inputs
i_startTime = input(title="Start Filter", defval=timestamp("01 Jan 2023 13:30 +0000"), group="Time Filter", tooltip="Start date & time to begin searching for setups")
i_endTime   = input(title="End Filter",   defval=timestamp("28 Apr 2099 19:30 +0000"), group="Time Filter", tooltip="End date & time to stop searching for setups")

// Date/time filtering logic
inDateRange = true

// Calculate EMAs
fastEMALine = ta.ema(close, fastEMA)
slowEMALine = ta.ema(close, slowEMA)

// Calculate ATR
atr = ta.atr(atrLength)

// Calculate Supertrend using fixed multiplier
up = high - (stMultiplier * atr)
dn = low +  (stMultiplier * atr)

var float trendUp = na
var float trendDown = na
var int trend = na

trendUp   := na(trendUp[1])   ? up : (close[1] > trendUp[1]   ? math.min(up, trendUp[1])   : up)
trendDown := na(trendDown[1]) ? dn : (close[1] < trendDown[1] ? math.max(dn, trendDown[1]) : dn)

trend := close > nz(trendUp[1]) ? 1 : close < nz(trendDown[1]) ? -1 : nz(trend[1], 1)
supertrend = trend == 1 ? trendUp : trendDown

// Calculate RSI
myRSI = ta.rsi(close, rsiLength)

// Entry conditions with RSI filter
longEntryCondition  = ta.crossover(fastEMALine, slowEMALine) and (trend == 1) and (myRSI < rsiOverbought)
shortEntryCondition = ta.crossunder(fastEMALine, slowEMALine) and (trend == -1) and (myRSI > rsiOversold)

// Strategy entries
if inDateRange and longEntryCondition and strategy.position_size <= 0
    strategy.entry("Long", strategy.long)

if inDateRange and shortEntryCondition and strategy.position_size >= 0
    strategy.entry("Short", strategy.short)

// Stops and targets
if strategy.position_size > 0
    longStopLoss   = strategy.position_avg_price - stopLossATR * atr
    longTakeProfit = strategy.position_avg_price + takeProfitATR * atr
    strategy.exit("Long SL/TP", "Long", stop=longStopLoss, limit=longTakeProfit)

if strategy.position_size < 0
    shortStopLoss   = strategy.position_avg_price + stopLossATR * atr
    shortTakeProfit = strategy.position_avg_price - takeProfitATR * atr
    strategy.exit("Short SL/TP", "Short", stop=shortStopLoss, limit=shortTakeProfit)

// Plot EMAs and Supertrend
plot(fastEMALine, title="Fast EMA", color=color.new(color.blue, 0))
plot(slowEMALine, title="Slow EMA", color=color.new(color.red, 0))
plot(trend == 1 ? supertrend : na, title="Supertrend Up", color=color.green, style=plot.style_linebr)
plot(trend == -1 ? supertrend : na, title="Supertrend Down", color=color.red, style=plot.style_linebr)

// Plot RSI and hlines
plot(rsiPlotEnabled ? myRSI : na, title="RSI", color=color.new(color.purple, 0))
hline(rsiOverbought, "Overbought", color=color.red, linestyle=hline.style_dotted)
hline(rsiOversold,   "Oversold",   color=color.green, linestyle=hline.style_dotted)

// Plot entry signals
plotshape(longEntryCondition, title="Long Entry Signal", style=shape.triangleup, location=location.belowbar, size=size.tiny, color=color.new(color.green, 0))
plotshape(shortEntryCondition, title="Short Entry Signal", style=shape.triangledown, location=location.abovebar, size=size.tiny, color=color.new(color.red, 0))
相关推荐