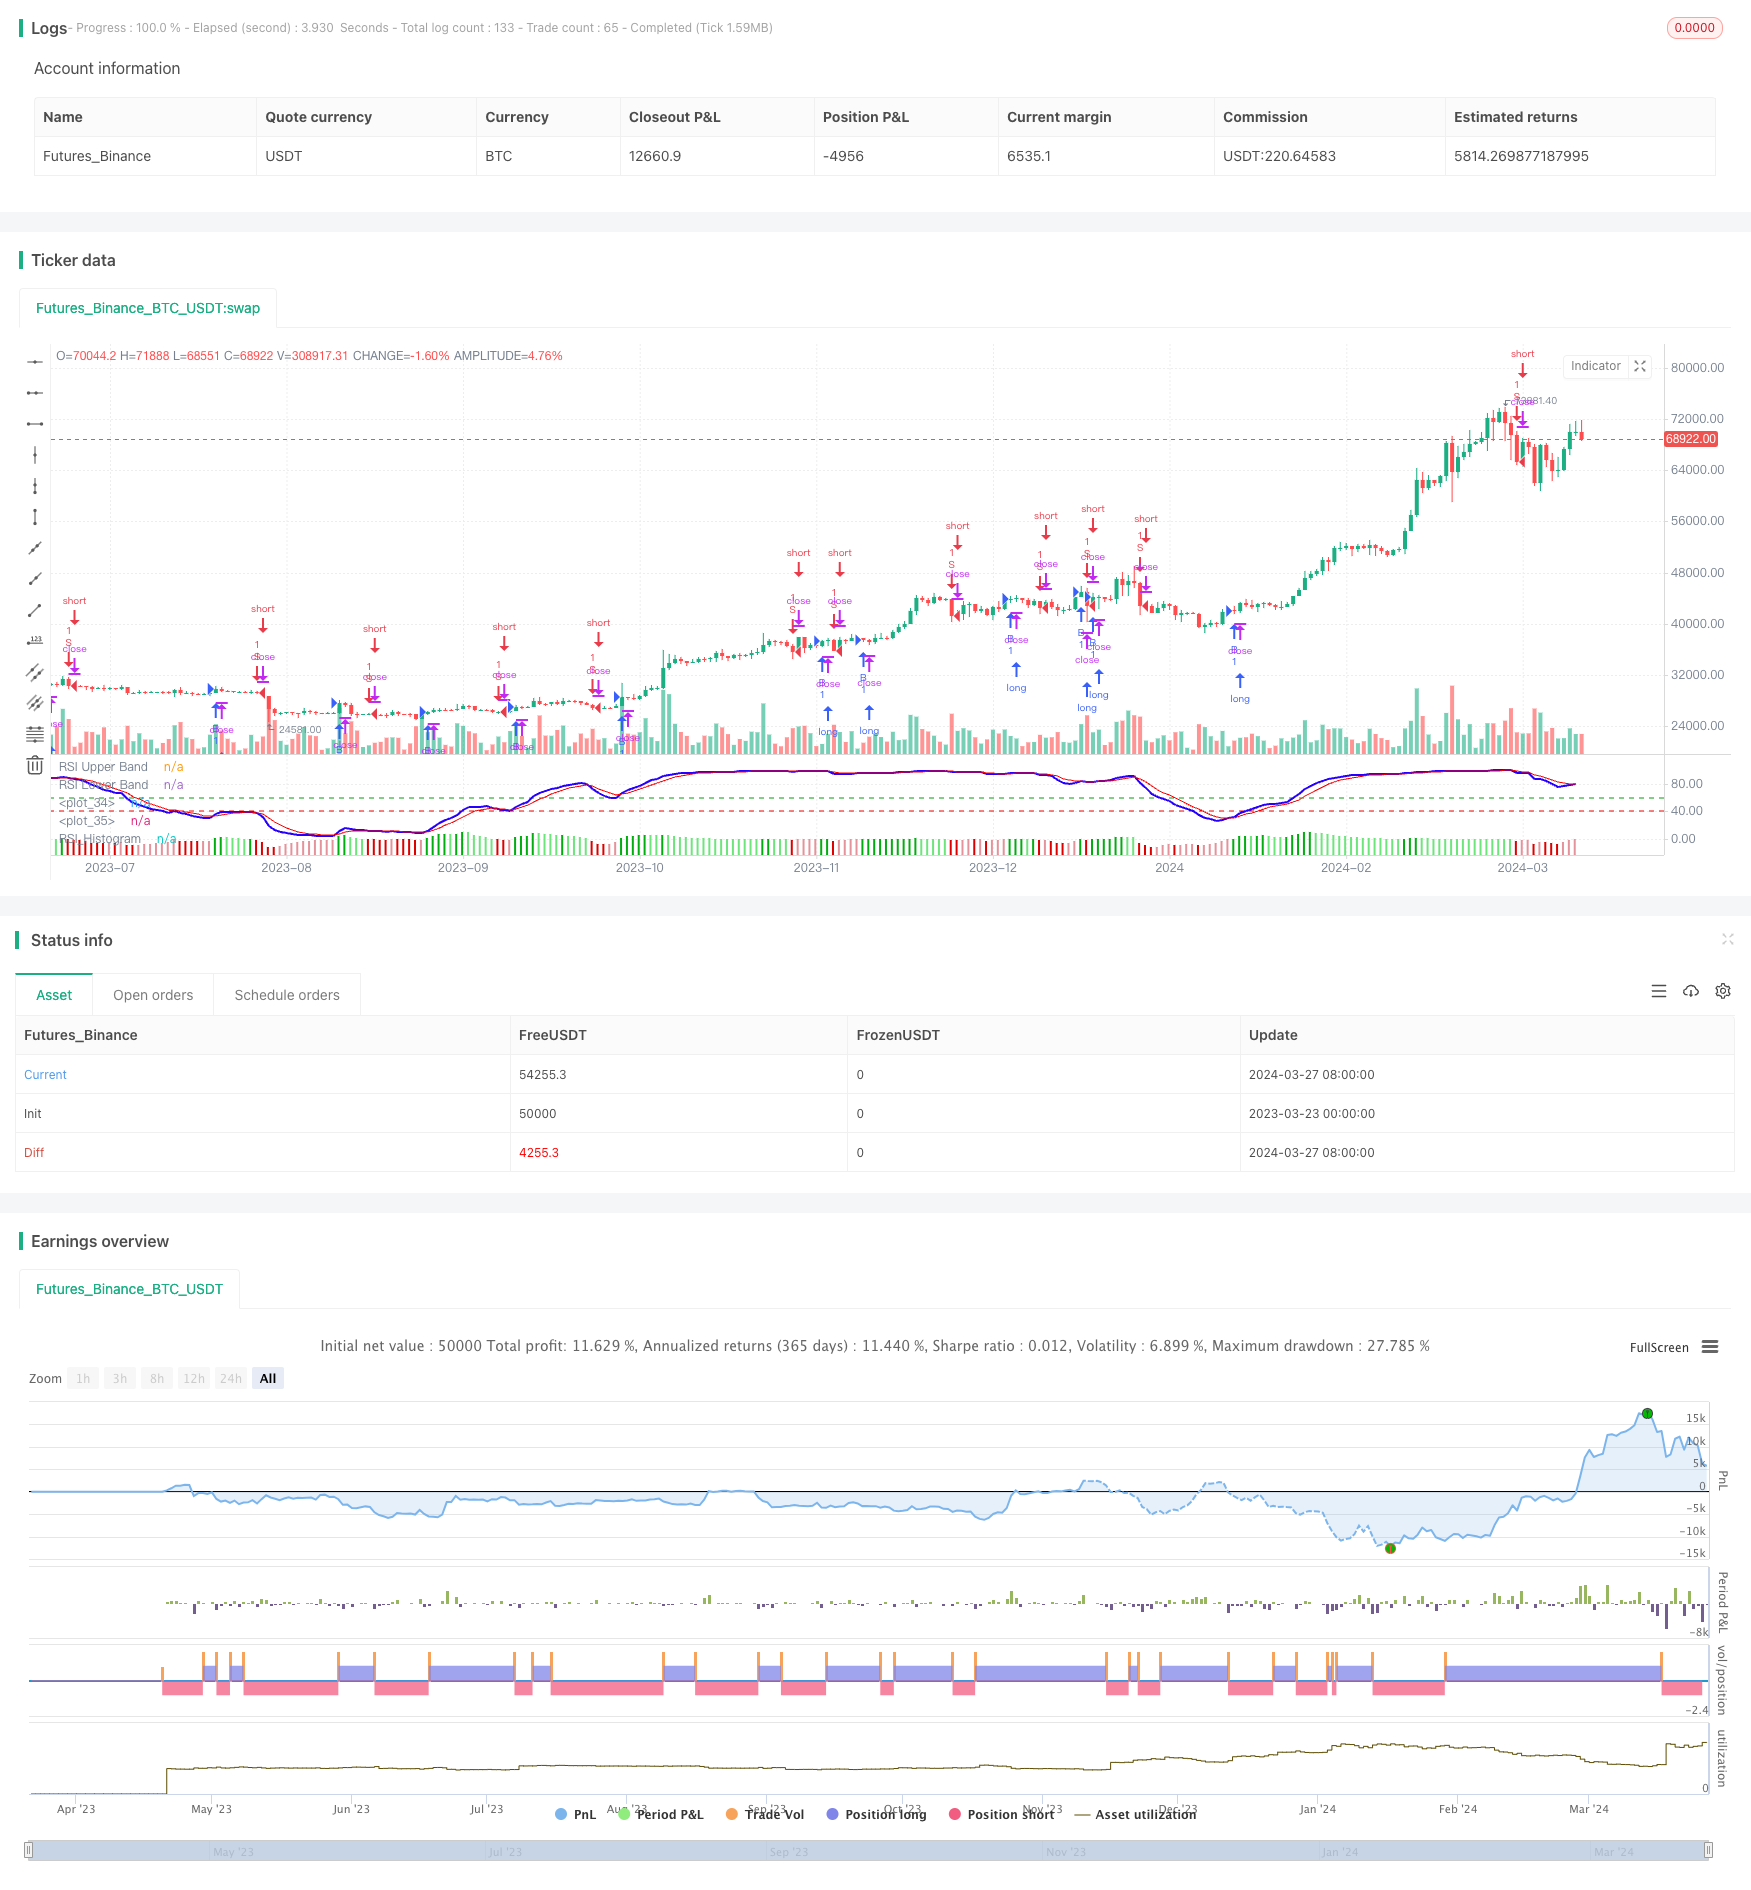
रणनीति के बाद संशोधित सापेक्ष शक्ति सूचकांक की प्रवृत्ति
लेखक:चाओझांग, दिनांकः 2024-03-29 16:16:37टैगः

अवलोकन
यह रणनीति संशोधित सापेक्ष शक्ति सूचकांक (संशोधित आरएसआई) के आधार पर बाजार के रुझानों को पकड़ती है। रणनीति का मुख्य विचार बाजार की प्रवृत्ति निर्धारित करने और प्रवृत्ति दिशा के अनुसार ट्रेड करने के लिए संशोधित आरएसआई संकेतक के क्रॉसओवर संकेतों और हिस्टोग्राम संकेतों का उपयोग करना है।
रणनीतिक सिद्धांत
- संशोधित आरएसआई के लिए इनपुट के रूप में मूल्य के ईएमए की गणना करें
- संशोधित आरएसआई संकेतक की गणना करें
- संकेत रेखा के रूप में संशोधित आरएसआई के ईएमए की गणना करें
- हिस्टोग्राम के रूप में संशोधित आरएसआई और संकेत रेखा के बीच अंतर की गणना करें
- जब संशोधित आरएसआई सिग्नल लाइन के ऊपर पार करता है और हिस्टोग्राम 0 से अधिक होता है, तो एक खरीद संकेत उत्पन्न करता है
- जब संशोधित आरएसआई सिग्नल लाइन के नीचे पार करता है और हिस्टोग्राम 0 से कम होता है, तो एक बिक्री संकेत उत्पन्न करता है
रणनीतिक लाभ
- संशोधित आरएसआई संकेतक पारंपरिक आरएसआई संकेतक की तुलना में रुझानों को बेहतर ढंग से पकड़ सकता है।
- संशोधित आरएसआई के क्रॉसओवर संकेतों और हिस्टोग्राम संकेतों का संयोजन प्रभावी रूप से झूठे संकेतों को फ़िल्टर कर सकता है
- पैरामीटर समायोज्य हैं और विभिन्न बाजारों और समय सीमाओं पर लागू होते हैं
- कार्यक्रम संक्षिप्त और कम्प्यूटेशनल कुशल है
रणनीतिक जोखिम
- संशोधित आरएसआई संकेतक सीमाबद्ध बाजारों में झूठे संकेत उत्पन्न करने के लिए प्रवण है
- रुझान मोड़ के बिंदुओं को पकड़ने में देरी हो सकती है
- एक एकल संकेतक को मूल्य शोर से आसानी से प्रभावित किया जाता है
रणनीति अनुकूलन दिशाएं
- सिग्नल विश्वसनीयता में सुधार के लिए इसे अन्य रुझान संकेतकों जैसे चलती औसत के साथ जोड़ा जा सकता है
- एकल लेनदेन जोखिम को नियंत्रित करने के लिए स्टॉप लॉस और टेक प्रॉफिट मॉड्यूल जोड़ा जा सकता है
- विभिन्न बाजार विशेषताओं के आधार पर मापदंडों को अनुकूलित किया जा सकता है
- स्थिति प्रबंधन मॉड्यूल को गतिशील रूप से स्थिति को समायोजित करने के लिए जोड़ा जा सकता है
सारांश
यह रणनीति ट्रेंड फॉलो करने के परिप्रेक्ष्य से ट्रेडिंग सिस्टम बनाने के लिए संशोधित आरएसआई संकेतक की विशेषताओं का उपयोग करती है। संशोधित आरएसआई संकेतक पारंपरिक आरएसआई संकेतक के कुछ दोषों को दूर करता है और अपेक्षाकृत मजबूत ट्रेंड कैप्चर क्षमता रखता है। हालांकि, एक एकल संकेतक पर आधारित रणनीतियों की अक्सर सीमाएं होती हैं और उन्हें अन्य तकनीकी साधनों के साथ संयोजन में सुधार करने की आवश्यकता होती है। रणनीति मापदंडों को अनुकूलित करके, संकेत स्रोतों को समृद्ध करके, जोखिम नियंत्रण मॉड्यूल जोड़कर और अन्य तरीकों से, इस रणनीति की स्थिरता और लाभप्रदता में और सुधार किया जा सकता है।
/*backtest
start: 2023-03-23 00:00:00
end: 2024-03-28 00:00:00
period: 1d
basePeriod: 1h
exchanges: [{"eid":"Futures_Binance","currency":"BTC_USDT"}]
*/

// This source code is subject to the terms of the Mozilla Public License 2.0 at https://mozilla.org/MPL/2.0/
// © YogirajDange

//@version=5


// Verical lines


// // Define the times
// t1 = timestamp(year, month, dayofmonth, 09, 15) // 9:15
// t2 = timestamp(year, month, dayofmonth, 11, 15) // 11:15
// t3 = timestamp(year, month, dayofmonth, 13, 15) // 1:15
// t4 = timestamp(year, month, dayofmonth, 15, 25) // 3:25

// // Check if the current bar is on the current day
// is_today = (year(time) == year(timenow)) and (month(time) == month(timenow)) and (dayofmonth(time) == dayofmonth(timenow))

// // Draw a vertical line at each time
// if is_today and (time == t1 or time == t2 or time == t3 or time == t4)
//     line.new(x1 = bar_index, y1 = low, x2 = bar_index, y2 = high, extend = extend.both, color=color.red, width = 1)

strategy('Modified RSI')
col_grow_above = input(#02ac11, "Above   Grow", group="Histogram", inline="Above")
col_fall_above = input(#6ee47d, "Fall", group="Histogram", inline="Above")
col_grow_below = input(#e5939b, "Below Grow", group="Histogram", inline="Below")
col_fall_below = input(#dd0000, "Fall", group="Histogram", inline="Below")
EMA_length = input.int(13, 'Price_EMA', minval=1)
RSI_length = input.int(14, 'RSI_Period', minval=1)
Avg_length = input.int(5, 'RSI_Avg_EMA', minval=1)
fastMA = ta.ema(close, EMA_length)
modrsi = ta.rsi(fastMA, RSI_length)
RSIAVG = ta.ema(modrsi, Avg_length)
plot(modrsi, color=color.rgb(38, 0, 255), linewidth=2)
plot(RSIAVG, color=color.rgb(247, 0, 0))
rsiUpperBand = hline(60, 'RSI Upper Band', color=#099b0e)
//hline(50, "RSI Middle Band", color=color.new(#787B86, 50))
rsiLowerBand = hline(40, 'RSI Lower Band', color=#e90101)

RSI_hist = modrsi - RSIAVG

//plot(RSI_hist,"RSI_Histogram", color = #c201e9, style = plot.style_columns,linewidth= 5)

plot(RSI_hist, title="RSI_Histogram", style=plot.style_columns, color=(RSI_hist>=0 ? (RSI_hist[1] < RSI_hist ? col_grow_above : col_fall_above) : (RSI_hist[1] < RSI_hist ? col_grow_below : col_fall_below)))


/////// Moving Averages 20 50 EMA

fast_ma = input.int(20, minval=2, title="Fast_EMA")
slow_ma = input.int(50, minval=2, title="Slow_EMA")

src = input.source(close, title="Source")

out = ta.ema(src, fast_ma)
out1 = ta.ema(src, slow_ma)

//plot(out, title="20 EMA", color=color.rgb(117, 71, 247), linewidth = 2)
//plot(out1, title="50 EMA", color=color.rgb(0, 0, 0), linewidth = 2)


longCondition = ((ta.crossover(modrsi, RSIAVG)) and (RSI_hist > 0))
if longCondition
    strategy.entry('B', strategy.long)

shortCondition = ((ta.crossunder(modrsi, RSIAVG)) and (RSI_hist < 0))
if shortCondition
    strategy.entry('S', strategy.short)
- गतिशील एटीआर स्टॉप लॉस और टेक प्रॉफिट रणनीति के साथ वीडब्ल्यूएपी मूविंग एवरेज क्रॉसओवर
- इक्विटी डेटा पर आधारित समय श्रृंखला अनुकूलन गतिशील सीमा रणनीति
- एशियाई सत्र उच्च निम्न ब्रेकआउट रणनीति
- तीर और अलर्ट रणनीति के साथ मार्कस के ट्रेंड ट्रेडर
- ईएमए की रणनीति का अनुसरण करते हुए दोहरी चलती औसत क्रॉसओवर ट्रेंड
- चलती औसत क्रॉसओवर रणनीति
- मैनुअल टीपी और एसएल के साथ आरएसआई गति रणनीति
- ईएमए आरएसआई रुझान-अनुसरण और गति रणनीति
- गाउसियन चैनल ट्रेंड रणनीति का पालन करना
- बोलिंगर बैंड और डीसीए को जोड़ने वाली उच्च आवृत्ति व्यापार रणनीति
- इंट्रा-डे बुलिश ब्रेकआउट रणनीति
- ईएमए-एमएसीडी-सुपरट्रेंड-एडीएक्स-एटीआर मल्टी-इंडिकेटर ट्रेडिंग सिग्नल रणनीति
- प्रवृत्ति के अनुसार परिवर्तनीय स्थिति ग्रिड रणनीति
- सुपरट्रेंड और बोलिंगर बैंड्स संयोजन रणनीति
- रणनीति के बाद एमएसीडी रुझान
- ईएमए डबल मूविंग एवरेज क्रॉसओवर रणनीति
- XAUUSD 1-मिनट स्केलिंग रणनीति
- वेक्टर कैंडल आधारित चैनल ब्रेकआउट और कस्टम चोच रणनीति
- BreakHigh ईएमए क्रॉसओवर रणनीति
- रणनीति के बाद गतिशील रुझान