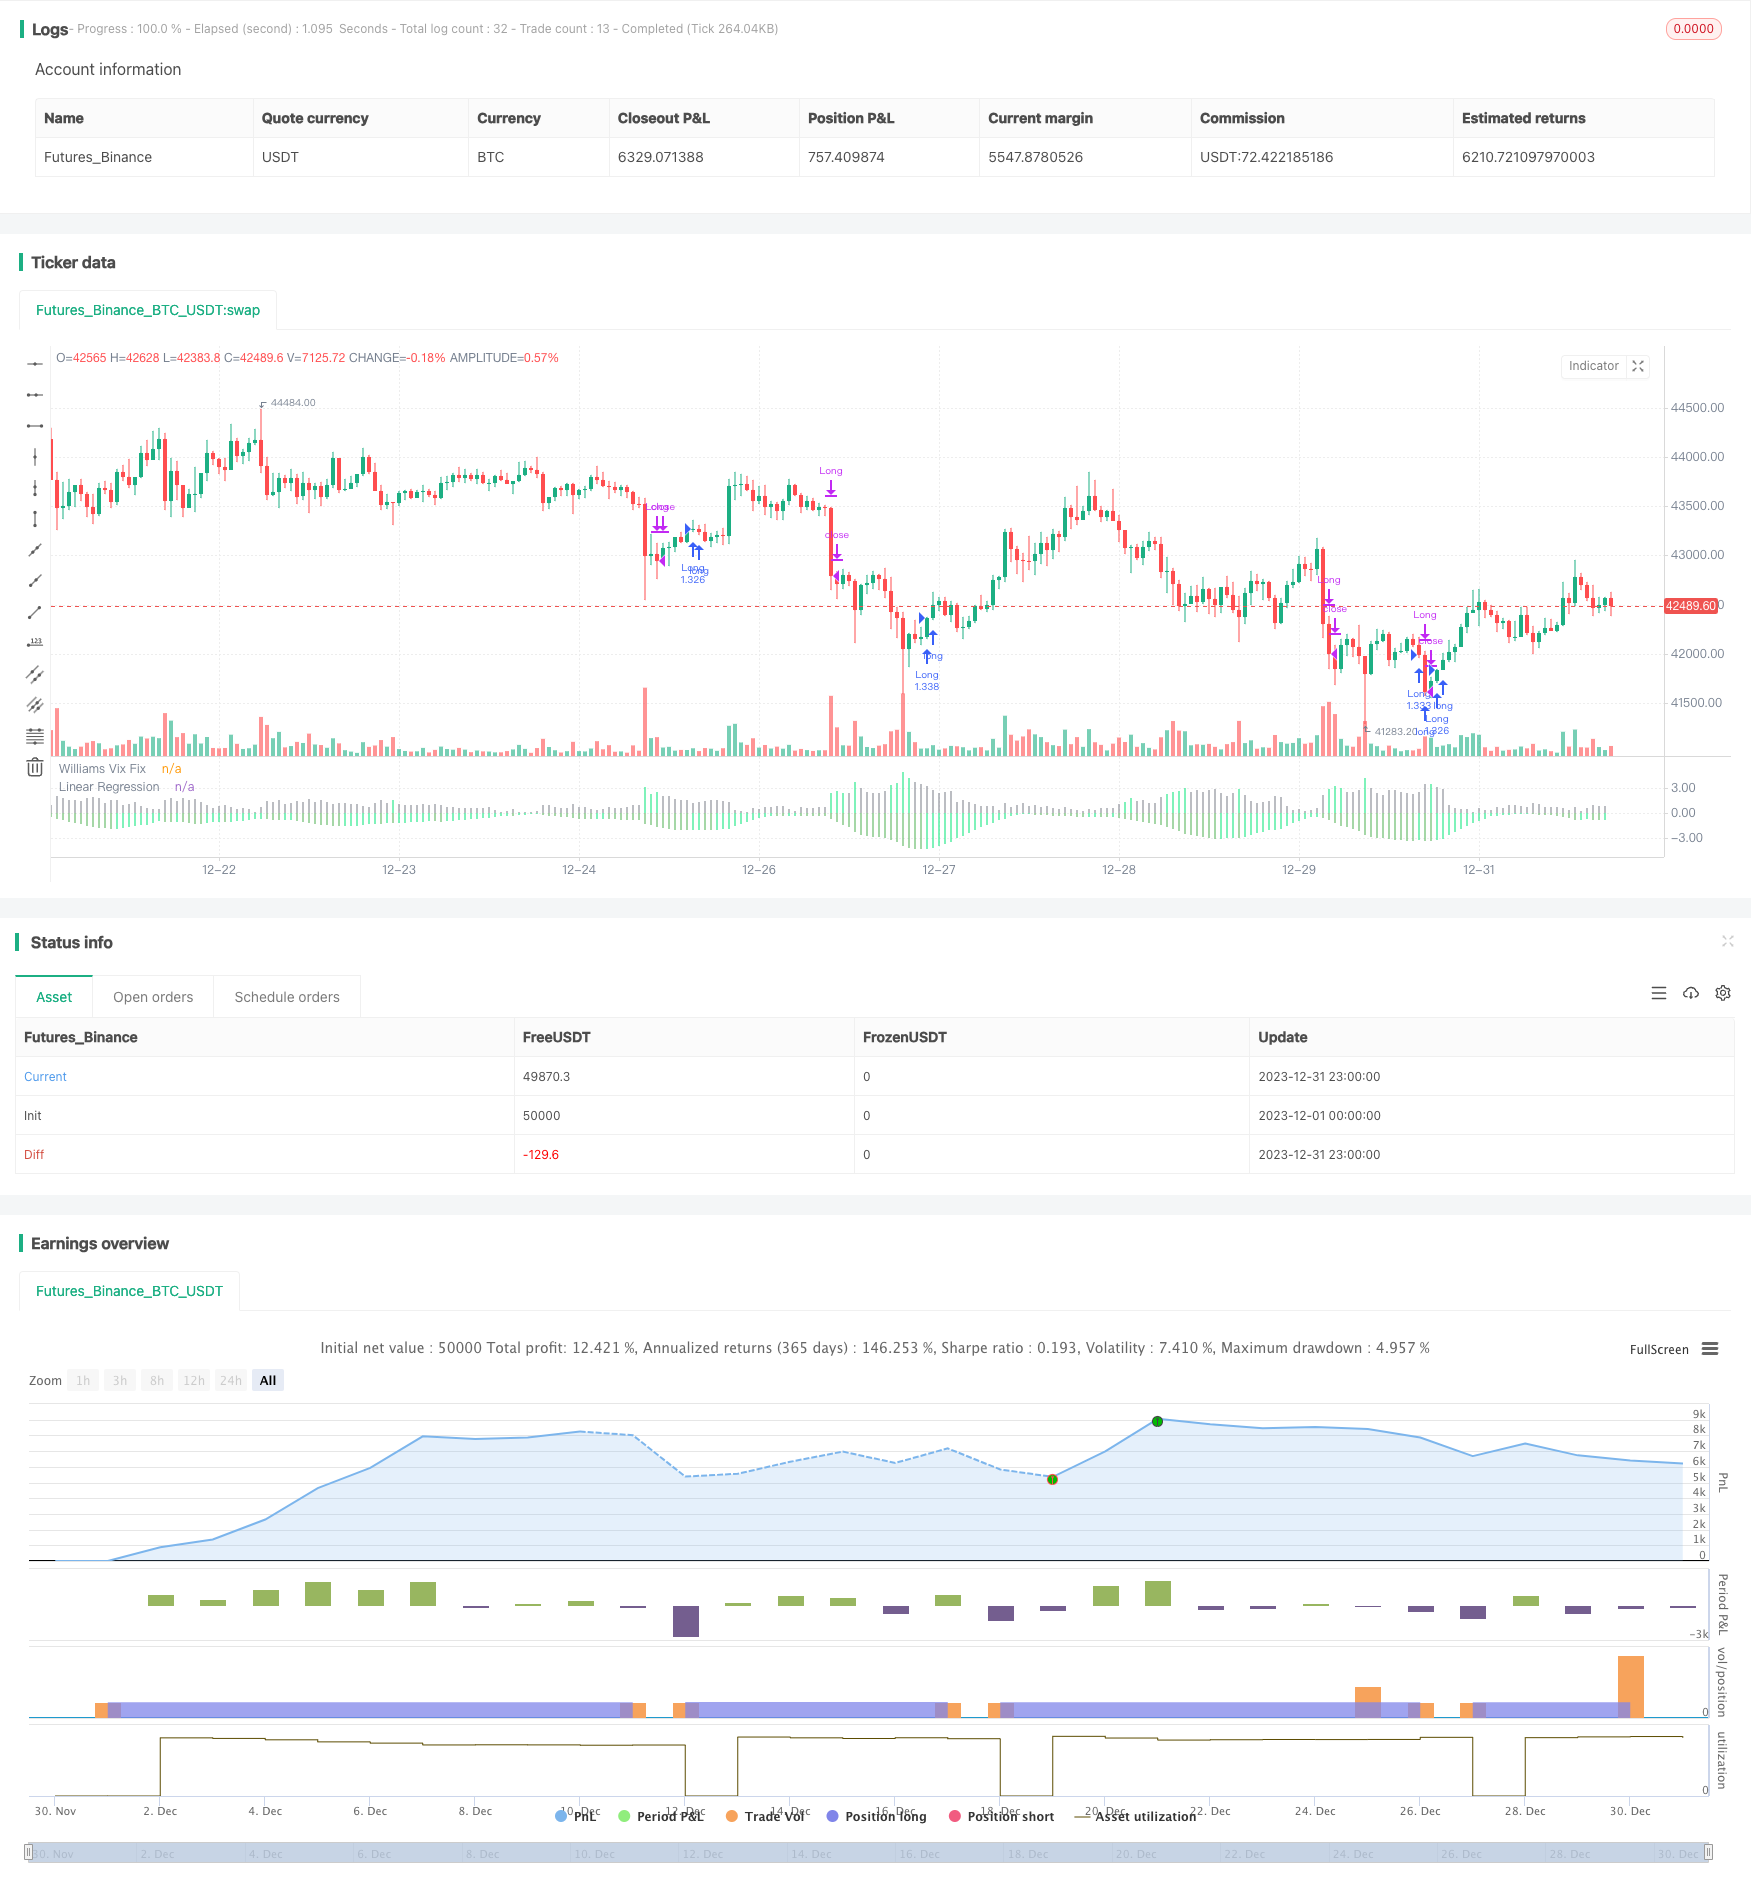
Strategi penangkapan titik rendah berdasarkan regresi linier perbaikan Vix

Ringkasan
Gagasan inti dari strategi ini adalah menggabungkan indikator perbaikan Wix dan regresi liniernya, untuk menangkap titik rendah pasar dengan tepat. Strategi ini disebut strategi perbaikan titik rendah regresi linier.
Prinsip Strategi
- Perhitungan indeks perbaikan Wix, yang lebih baik dalam menilai titik rendah pasar
- Regresi linier diterapkan pada indikator perbaikan Wix. Ketika histogram regresi linier berwarna hijau, menunjukkan regresi linier perbaikan Wix mulai naik, sinyal beli dapat dikirim
- Kombinasi dengan kolom hijau indikator perbaikan Wix, untuk lebih mengkonfirmasi waktu pembelian
- Ketika histogram regresi linier berubah warna menjadi merah, menunjukkan bahwa regresi linier perbaikan Wix mulai menurun dan mengirimkan sinyal sell out
Proses di atas, menggunakan regresi linier untuk meningkatkan akurasi dan ketepatan waktu sinyal indikator perbaikan Wix, memfilter beberapa sinyal palsu, sehingga tepat menangkap titik rendah.
Analisis Keunggulan
- Strategi memanfaatkan filter regresi linier untuk memperbaiki sinyal palsu parsial dari indikator Wix, membuat sinyal beli/jual lebih akurat dan dapat diandalkan
- Regresi linier meningkatkan sensitivitas dan ketepatan waktu sinyal, dan dapat menangkap titik-titik perubahan pasar dengan cepat
- Strategi logis sederhana dan jelas, mudah dipahami implementasi, cocok untuk perdagangan kuantitatif
- Lebih banyak parameter yang dapat dikonfigurasi, dapat disesuaikan dengan perubahan pasar
Risiko dan Solusi
- Strategi ini terutama digunakan untuk menilai titik rendah pasar secara keseluruhan, tidak cocok untuk saham individu
- Regresi linier tidak dapat sepenuhnya memfilter sinyal palsu, dan kombinasi dengan indikator perbaikan Wix dapat mengurangi risiko
- Parameter perlu disesuaikan dengan perubahan situasi, untuk menghindari kegagalan
- Disarankan untuk digunakan dalam kombinasi dengan indikator lain untuk lebih mengkonfirmasi sinyal.
Arah optimasi
- Dapat dipertimbangkan untuk digabungkan dengan indikator oscillasi atau indikator kuantitatif untuk lebih memfilter sinyal
- Metode Optimasi Adaptasi Parameter yang Dapat Dipelajari untuk Membuat Strategi Lebih Cerdas
- Menggunakan model yang lebih kompleks untuk memprediksi pergerakan perbaikan Wix
- Anda dapat mencoba metode serupa pada saham individu, dan mempelajari cara memfilter sinyal palsu.
Meringkaskan
Strategi ini menggunakan Wix untuk memperbaiki indikator untuk menentukan titik rendah, sementara memperkenalkan regresi linier untuk meningkatkan kualitas sinyal, sehingga dapat menangkap titik rendah pasar secara efektif. Strategi ini sederhana dan praktis, hasilnya lebih ideal, risiko utama adalah kegagalan untuk memfilter sinyal palsu sepenuhnya.
/*backtest
start: 2023-12-01 00:00:00
end: 2023-12-31 23:59:59
period: 1h
basePeriod: 15m
exchanges: [{"eid":"Futures_Binance","currency":"BTC_USDT"}]
*/

// This source code is subject to the terms of the Mozilla Public License 2.0 at https://mozilla.org/MPL/2.0/
// © HeWhoMustNotBeNamed

//@version=4
strategy("VixFixLinReg-Strategy", shorttitle="VixFixLinReg - Strategy",
                     overlay=false, initial_capital = 100000,
                     default_qty_type = strategy.percent_of_equity, default_qty_value = 100, commission_type = strategy.commission.percent, pyramiding = 1,
                     commission_value = 0.01)
pd = input(22, title="LookBack Period Standard Deviation High")
bbl = input(20, title="Bolinger Band Length")
mult = input(2.0    , minval=1, maxval=5, title="Bollinger Band Standard Devaition Up")
lb = input(50  , title="Look Back Period Percentile High")
ph = input(.85, title="Highest Percentile - 0.90=90%, 0.95=95%, 0.99=99%")
pl = input(1.01, title="Lowest Percentile - 1.10=90%, 1.05=95%, 1.01=99%")
hp = input(false, title="Show High Range - Based on Percentile and LookBack Period?")
sd = input(false, title="Show Standard Deviation Line?")
i_startTime = input(defval = timestamp("01 Jan 2010 00:00 +0000"), title = "Start Time", type = input.time)
i_endTime = input(defval = timestamp("01 Jan 2099 00:00 +0000"), title = "End Time", type = input.time)
inDateRange = true
considerVIXFixClose = input(false)
lengthKC=input(20, title="KC Length")
multKC = input(1.5, title="KC MultFactor")

atrLen = input(22)
atrMult = input(5)
initialStopBar = input(5)
waitForCloseBeforeStop = input(true)
f_getStop(atrLen, atrMult)=>
    stop = strategy.position_size > 0 ? close - (atrMult * atr(atrLen)) : lowest(initialStopBar)
    stop := strategy.position_size > 0 ? max(stop,nz(stop[1], stop)) : lowest(initialStopBar)
    stop

wvf = ((highest(close, pd)-low)/(highest(close, pd)))*100

sDev = mult * stdev(wvf, bbl)
midLine = sma(wvf, bbl)
lowerBand = midLine - sDev
upperBand = midLine + sDev

rangeHigh = (highest(wvf, lb)) * ph
rangeLow = (lowest(wvf, lb)) * pl


col = wvf >= upperBand or wvf >= rangeHigh ? color.lime : color.gray

val = linreg(wvf, pd, 0)
absVal = abs(val)

linRegColor = val>val[1]? (val > 0 ? color.green : color.orange): (val > 0 ? color.lime : color.red)
plot(hp and rangeHigh ? rangeHigh : na, title="Range High Percentile", style=plot.style_line, linewidth=4, color=color.orange)
plot(hp and rangeLow ? rangeLow : na, title="Range High Percentile", style=plot.style_line, linewidth=4, color=color.orange)
plot(wvf, title="Williams Vix Fix", style=plot.style_histogram, linewidth = 4, color=col)
plot(sd and upperBand ? upperBand : na, title="Upper Band", style=plot.style_line, linewidth = 3, color=color.aqua)

plot(-absVal, title="Linear Regression", style=plot.style_histogram, linewidth=4, color=linRegColor)

vixFixState = (col == color.lime) ? 1: 0
vixFixState := strategy.position_size == 0? max(vixFixState, nz(vixFixState[1],0)) : vixFixState

longCondition = (vixFixState == 1 and linRegColor == color.lime) and inDateRange
exitLongCondition = (linRegColor == color.orange or linRegColor == color.red) and considerVIXFixClose

stop = f_getStop(atrLen, atrMult)
label_x = time+(60*60*24*1000*20)
myLabel = label.new(x=label_x, y=0, text="Stop : "+tostring(stop), xloc=xloc.bar_time, style=label.style_none, textcolor=color.black, size=size.normal)
label.delete(myLabel[1])
strategy.entry("Long", strategy.long, when=longCondition, oca_name="oca_buy")
strategy.close("Long", when=exitLongCondition or (close < stop and waitForCloseBeforeStop and linRegColor == color.green))
strategy.exit("ExitLong", "Long", stop = stop, when=not waitForCloseBeforeStop and linRegColor == color.green)