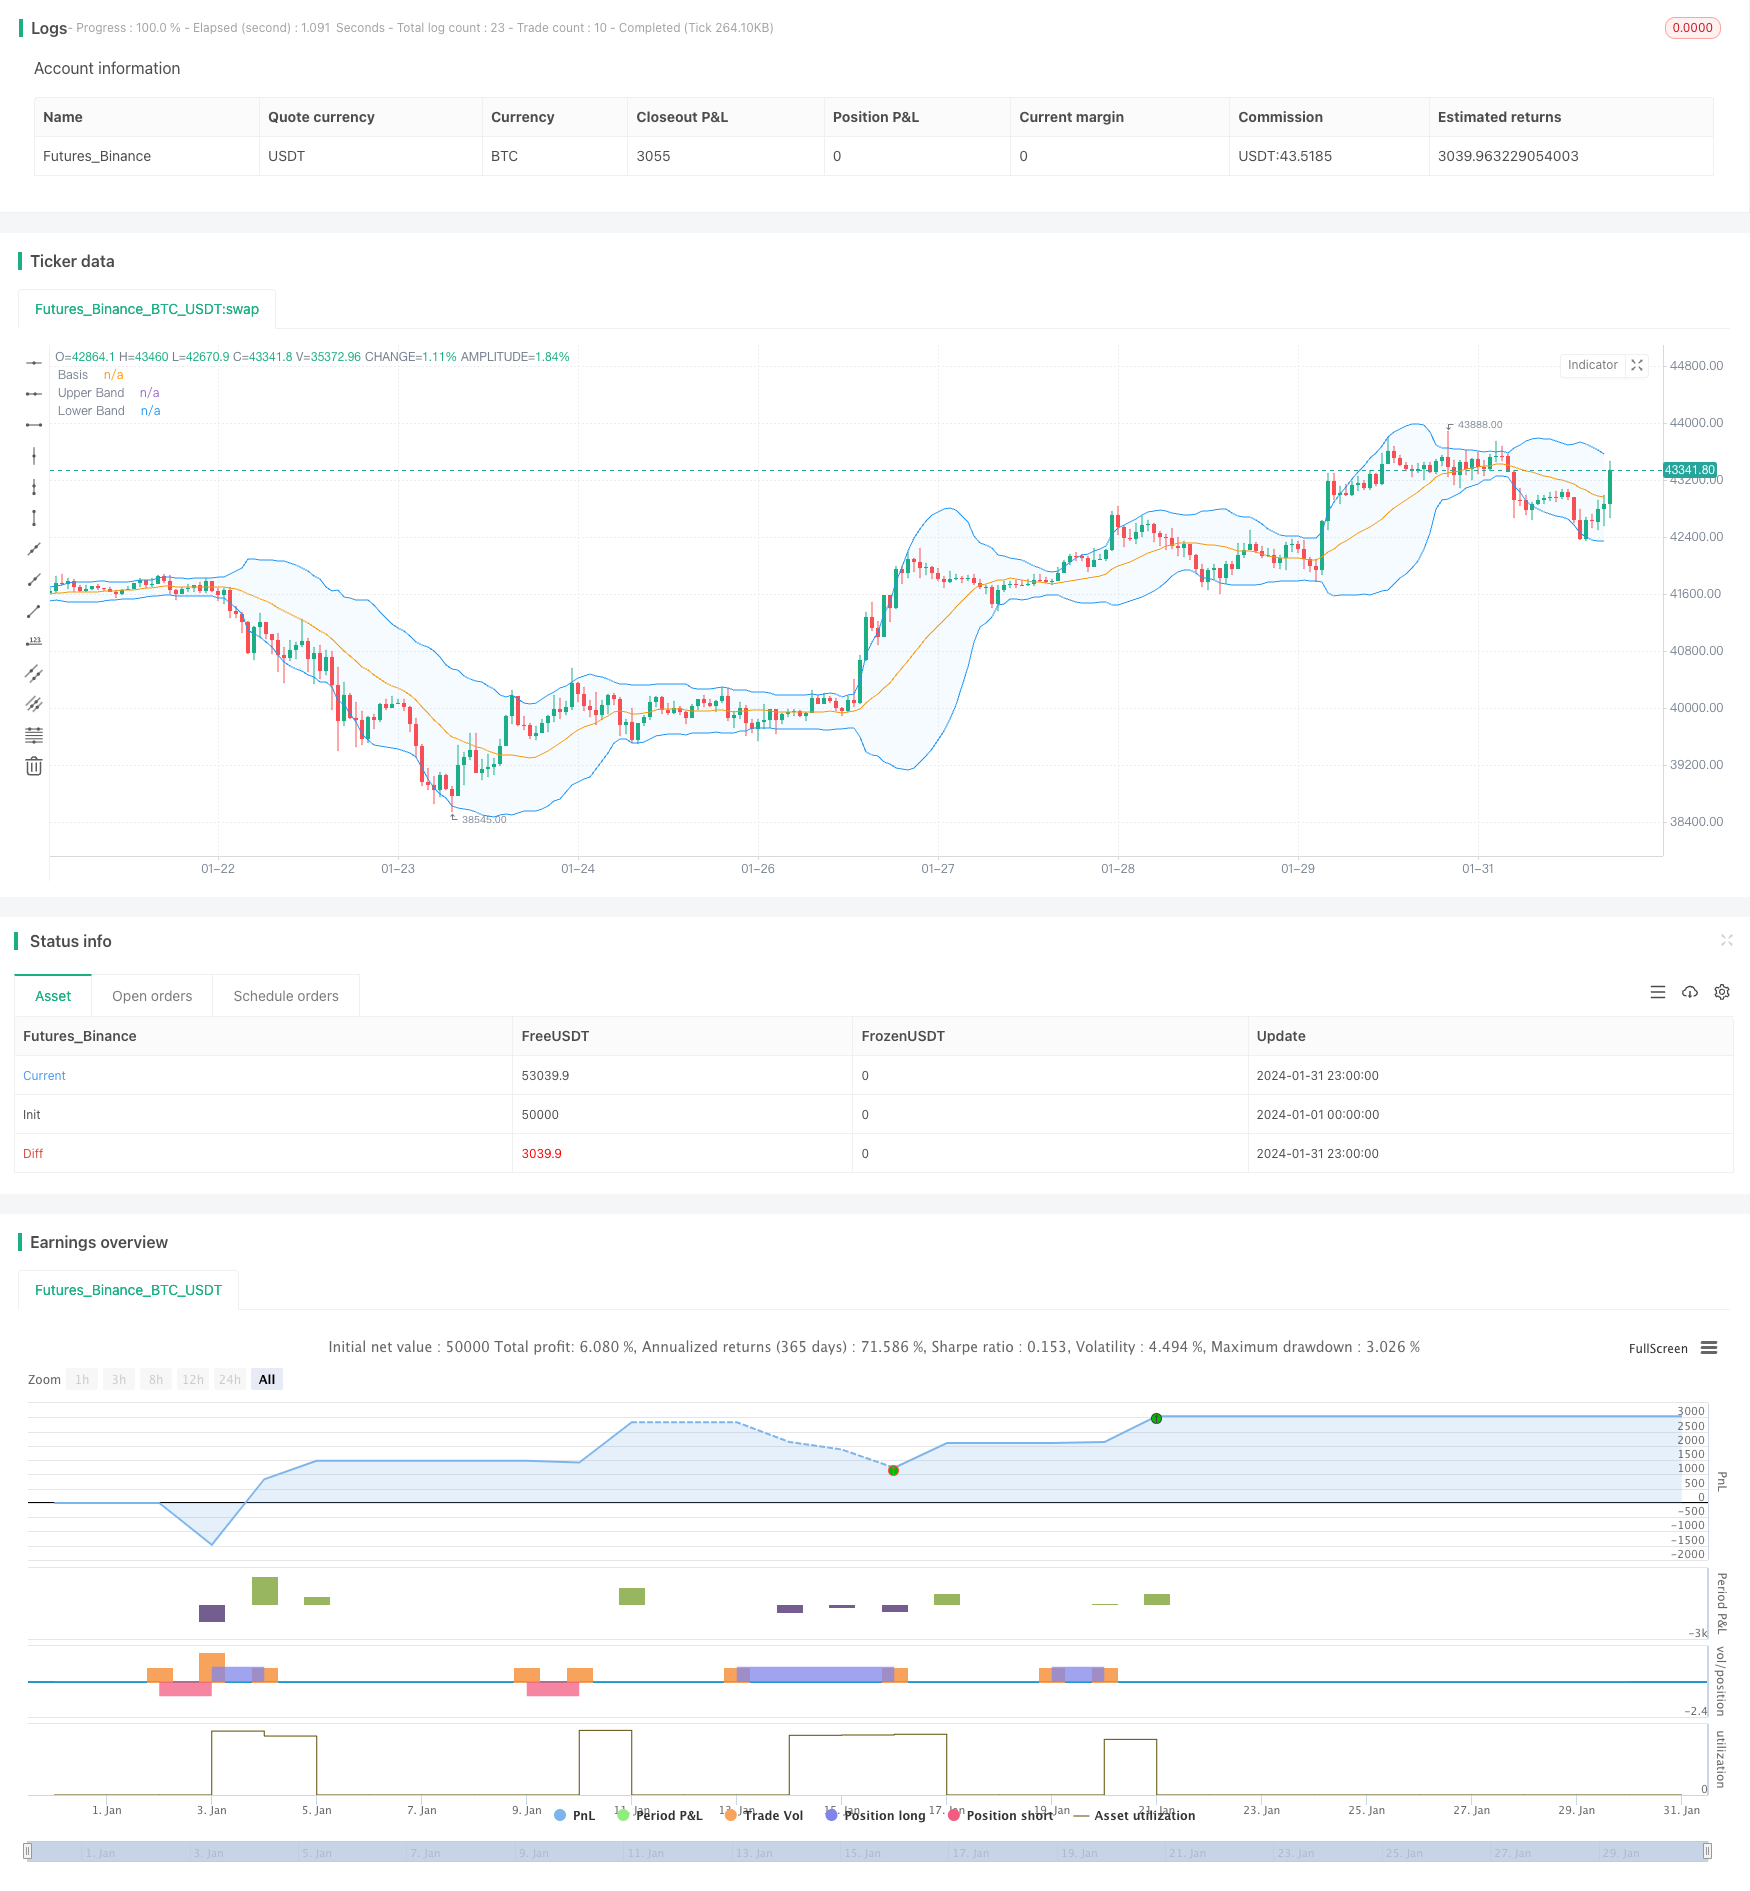
Strategi tren multi-kerangka waktu berdasarkan penembusan Bollinger Band dan indikator RSI

Ringkasan
Strategi ini menggabungkan indikator Brin, RSI, dan analisis multi-frame waktu untuk menangkap arah tren garis tengah dan panjang. Melalui Brin, tren naik dan tren turun digabungkan dengan sinyal RSI overbought dan oversold untuk menentukan titik balik tren, dan memungkinkan masuk dengan risiko rendah.
Prinsip Strategi
Penggunaan indikator Bollinger Bands untuk menentukan harga pecah. Bollinger Bands adalah rata-rata bergerak dari N-day closing price, dengan masing-masing selisih standar di atas dan di bawah mid-trail. Ini adalah sinyal yang kuat ketika harga close breaks up, dan sinyal yang lemah ketika harga breaks down.
Jika RSI lebih besar dari 70 adalah zona overbought, dan lebih kecil dari 30 adalah zona oversold. Jika RSI naik dari bawah ke atas 70 dianggap sebagai overbought, dan Brin naik ke atas sebagai konfirmasi bahwa tren telah berbalik. Jika RSI naik ke bawah 30 dianggap sebagai oversold, Brin turun ke bawah sebagai konfirmasi bahwa tren telah berbalik.
Gunakan filter waktu yang lebih tinggi untuk penembusan palsu. Jika sinyal penembusan muncul pada hari yang sama, gunakan waktu 4 jam atau lebih untuk mengkonfirmasi dan menghindari penyadapan.
Keunggulan Strategis
Di sisi lain, ada beberapa faktor yang dapat memicu pertumbuhan ekonomi global.
Indikator RSI menilai titik balik yang dapat mengurangi kerugian akibat terobosan palsu.
Analisis multi-frame time frame untuk memfilter tren getaran secara efektif dan menghindari kebocoran.
Optimalkan penilaian sinyal terobosan ((3 garis K harus menembus Brin untuk naik dan turun), pastikan tren berkembang dan masuk setelah matang.
Indikator Vortex menilai arah tren dan menangkap tren baru yang mulai terbentuk.
Risiko Strategis
Jika parameter Brin tidak disetel dengan benar, sinyal overbought dan oversold akan salah.
Pengaturan parameter RSI perlu menentukan nilai yang wajar berdasarkan varietas yang berbeda.
Sinyal penembusan dapat menyebabkan penembusan palsu.
Jaminan stop loss yang memadai, seperti 3 kali lipat dari indikator ATR.
Arah optimasi strategi
Menggunakan algoritma pembelajaran mesin untuk mengoptimalkan parameter Brinks dan RSI secara real-time.
Mengoptimalkan Stop Loss Divergensi dengan menggunakan indikator volatilitas.
Menambahkan modul kontrol volume transaksi untuk menyesuaikan posisi sesuai dengan perubahan pasar.
Terkait dengan prinsip manajemen dana, membatasi rasio kerugian per transaksi.
Evaluasi stabilitas sinyal penembusan pada waktu perdagangan yang berbeda.
Meringkaskan
Strategi ini secara menyeluruh mempertimbangkan berbagai indikator teknis seperti penilaian tren, fenomena overbought dan oversold, analisis kerangka waktu multi, dengan asumsi pengendalian risiko, memilih waktu masuk yang tepat, menangkap tren kualitas garis tengah dan panjang, untuk mendapatkan rasio untung rugi yang lebih baik. Di samping itu, ada ruang untuk optimalisasi lebih lanjut, dengan cara pengoptimalan parameter, perbaikan mekanisme stop loss, dan lain-lain, diharapkan untuk mendapatkan kinerja investasi yang lebih baik.
/*backtest
start: 2024-01-01 00:00:00
end: 2024-01-31 23:59:59
period: 1h
basePeriod: 15m
exchanges: [{"eid":"Futures_Binance","currency":"BTC_USDT"}]
*/

// This Pine Script™ code is subject to the terms of the Mozilla Public License 2.0 at https://mozilla.org/MPL/2.0/
// © Noway0utstorm
//@version=5
strategy(title='Vortex0.71.3 + bb 3bar breakout + rsi - close hit upper or lower', shorttitle='truongphuthinh', format=format.price, precision=4,overlay = true)

length = input(20, title="Length")
mult = input(2.0, title="Multiplier")
source = close

basis = ta.sma(source, length)
dev = mult * ta.stdev(source, length)

upperBand = basis + dev
lowerBand = basis - dev

isClosedBar = ta.change(time("15"))

var bool closeAboveUpperBand = false
var bool closeBelowLowerBand = false


// Vortex Indicator Settings
period_ = input.int(14, title='Period', minval=2)

VMP = math.sum(math.abs(high - low[1]), period_)
VMM = math.sum(math.abs(low - high[1]), period_)
STR = math.sum(ta.atr(1), period_)
VIP = VMP / STR
VIM = VMM / STR

//
lengthrsi = input(14, title="RSI Length")
overboughtLevel = input(70, title="Overbought Level")
oversoldLevel = input(30, title="Oversold Level")

sourcersi = close
rsiValue = ta.rsi(sourcersi, lengthrsi)

shouldShort = rsiValue > overboughtLevel
shouldLong = rsiValue < oversoldLevel


if bool(isClosedBar[1]) and bool(isClosedBar[2]) and bool(isClosedBar[3])

    if close[1] > upperBand[1] and close[2] > upperBand[2] and close[3] > upperBand[3] and VIP > 1.25 and VIM < 0.7 and rsiValue > overboughtLevel
        strategy.entry("Short", strategy.short)
        closeAboveUpperBand := false  // Reset the condition when entering a new Short position
    if close[1] < lowerBand[1] and close[2] < lowerBand[2] and close[3] < lowerBand[3] and VIP < 0.7 and VIM > 1.25 and rsiValue < oversoldLevel
        strategy.entry("Long", strategy.long)
        closeBelowLowerBand := false  // Reset the condition when entering a new Long position


if strategy.position_size > 0  // Check if there is an open Long position
    closeAboveUpperBand := close > upperBand  // Update the condition based on close price
    if closeAboveUpperBand
        strategy.close("Long",disable_alert=true)  // Close the Long position if close price is above upper band

if strategy.position_size < 0  // Check if there is an open Short position
    closeBelowLowerBand := close < lowerBand  // Update the condition based on close price
    if closeBelowLowerBand
        strategy.close("Short",disable_alert=true)  // Close the Short position if close price is below lower band

// Plots
plot(basis, color=color.orange, title="Basis")
p1 = plot(upperBand, color=color.blue, title="Upper Band")
p2 = plot(lowerBand, color=color.blue, title="Lower Band")
fill(p1, p2, title = "Background", color=color.rgb(33, 150, 243, 95))