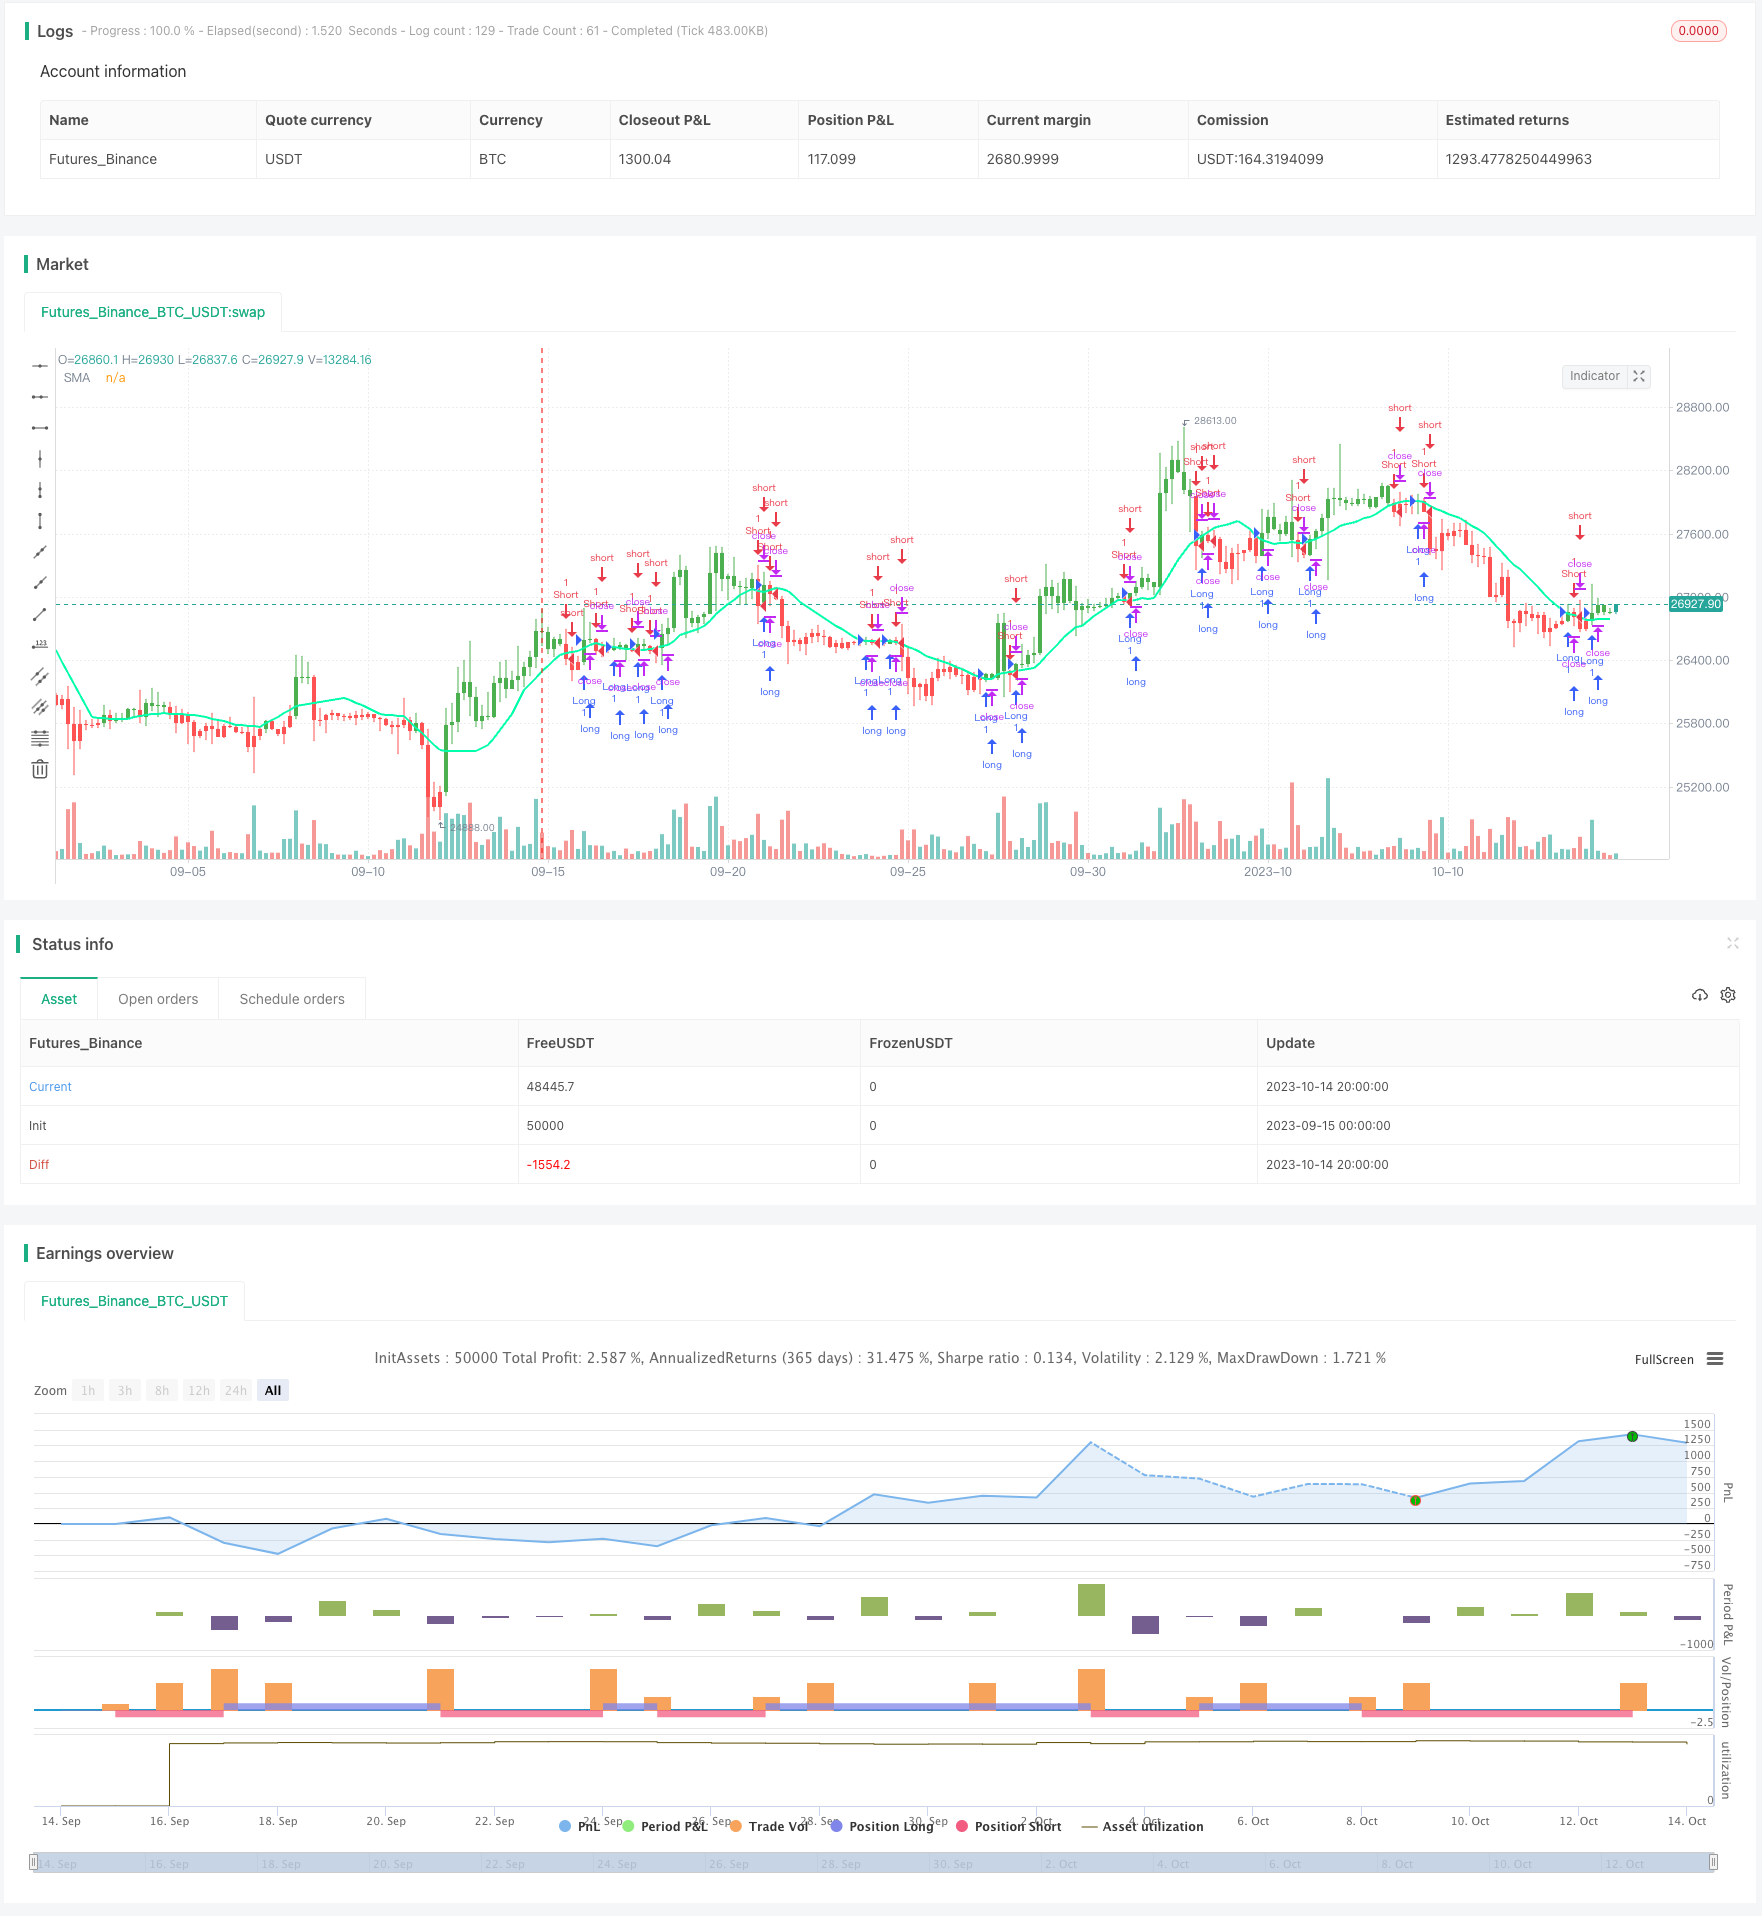
2つの移動平均逆転取引戦略
作者: リン・ハーンチャオチャン開催日:2023年10月16日15時50分35秒タグ:

概要
ダブル移動平均逆転取引戦略は,短期間と長期間の単純な移動平均を計算することによって取引信号を生成する.短期間移動平均が長期間移動平均を上回るときに長行し,短期間移動平均が長期間移動平均を下回るときに短行する.この戦略はトレンドフォロー戦略カテゴリーに属している.
戦略の論理
この戦略は,入力パラメータを通じて異なる期間の長さの2つの単純な移動平均値を設定し,短期間MAは高速線と呼ばれ,長期間MAはスローラインと呼ばれます.高速線は価格変化に早く反応し,短期的なトレンドを捉え,スローラインは価格変化にゆっくり反応し,短期的な市場ノイズをフィルタリングし,主要なトレンドを捉えます.高速線がスローラインを越えると,上昇傾向が強化され,ロングポジションが取られます.高速線がスローラインを下に越えると,ダウントレンドが強化され,ショートポジションが取られます.
ストラテジーは,SMA (スローライン) とファストラインに結果を割り当て,SMA (スローライン) を使って2つのMAを計算する.MASは閉じる価格に基づいて計算される.閉じる価格がxSMAを超えると,ロングポジションを取られる.閉じる価格がxSMAを下回ると,ショートポジションを取られる.ストラテジーはまた,指定された時間範囲内でのみ取引信号を生成するように,取引時間範囲を制限する.
トレープ・プロフィートとストップ・ロストポイントは,各取引に設定され,価格がトレイプ・プロフィートまたはストップ・ロストレベルに達するとすぐに利益が取られ,またはストップ・ロスは起動される.一方,戦略は,バーカラー関数を使用してバー上で価格対MA関係をプロットする.バーは,ロングポジションでは緑色,ショートポジションでは赤色,フラットであれば青色である.
利点分析
- 二重MAシステムを使用することで,短期間の市場騒音に惑わされないようにして,効率的に傾向を追跡できます.
- 急速なMAと遅いMAを組み合わせることで,取引信号の質が向上します.
- 各取引の利益とストップ・ロスのポイントのコントロールリスク
- 取引期間を制限することで 大事なイベントの変動を避けられる
- バールに取引信号をグラフ化することで,視覚的支援と直感性を向上させる
リスク分析
- 二重MAシステムでは,より多くの誤った信号を生成し,取引頻度とコストを増加させる傾向があります.
- MA パラメータは合理的に設定する必要があります.そうでなければ,平滑効果が損なわれ,機会が多く見逃されます.
- MAシステムには遅れがあり,トレンドターニングポイントを逃す可能性があります.
- 固定得益/ストップ損失は,あまりにも鈍いものであり,動的に調整できない可能性があります.
- 取引時間帯を制限することで,他の期間の機会が失われる可能性があります.
リスクは,MAパラメータを調整し,取利益/ストップ損失戦略を最適化し,時間制限を取り除くか,より合理的な取引時間期間を設定することによって軽減できます. フィルター条件として他の指標も組み込まれるので,誤った信号が多すぎないようにすることができます.
オプティマイゼーションの方向性
- 最適なパラメータを見つけるために,異なるMA期間の組み合わせをテストする.
- 動的ストップ損失/利益を考慮し,例えばATRをベースに
- フィルター信号としてMACD,KDなどの他の指標を組み込む
- より多くの機会を掴むために取引時間範囲を最適化
- 突破戦略と組み合わせて,MAsの周りの突破信号を探します
- ダイナミックな出口メカニズムを構築し,価格が範囲に入ると積極的に停止する
概要
ダブル・ムービング・平均逆転取引戦略は,全体としてシンプルで実用的なトレンドフォロー戦略である.トレンド方向を特定するためにMAのスムージング効果を最大限に活用し,トレンド信号を生成するために高速/遅いMAを使用する.この戦略は明確な論理で実行しやすいし,初心者が理解するのに適している.しかし,過剰な誤った信号と遅延問題を発生させる可能性があります. 戦略をより堅牢にするためにパラメータ最適化,補助指標を追加などにより改善ができます.正しく使用した場合,この戦略は安定した利益をもたらし,包括的なテストと最適化に価値があります.
/*backtest
start: 2023-09-15 00:00:00
end: 2023-10-15 00:00:00
period: 4h
basePeriod: 15m
exchanges: [{"eid":"Futures_Binance","currency":"BTC_USDT"}]
*/

// This source code is subject to the terms of the Mozilla Public License 2.0 at https://mozilla.org/MPL/2.0/
// © HPotter
//  Simple SMA strategy
//
// WARNING:
//      - For purpose educate only
//      - This script to change bars colors
//@version=4
timeinrange(res, sess) => not na(time(res, sess)) ? 1 : 0

strategy(title="Simple SMA Strategy Backtest", shorttitle="SMA Backtest", precision=6, overlay=true)
Resolution = input(title="Resolution", type=input.resolution, defval="D")
Source = input(title="Source", type=input.source, defval=close)
xSeries = security(syminfo.tickerid, Resolution, Source)
Length = input(title="Length", type=input.integer, defval=14, minval=2)
TriggerPrice = input(title="Trigger Price", type=input.source, defval=close)
TakeProfit = input(50, title="Take Profit", step=0.01)
StopLoss = input(20, title="Stop Loss", step=0.01)
UseTPSL = input(title="Use Take\Stop", type=input.bool, defval=false)
BarColors = input(title="Painting bars", type=input.bool, defval=true)
ShowLine = input(title="Show Line", type=input.bool, defval=true)
UseAlerts = input(title="Use Alerts", type=input.bool, defval=false)
timeframe = input(title="Time Frame", defval="15")
timerange = input(title="Time Range", defval="2300-0800")
reverse = input(title="Trade Reverse", type=input.bool, defval=false)
pos = 0
xSMA = sma(xSeries, Length)
pos := iff(TriggerPrice > xSMA, 1,
         iff(TriggerPrice < xSMA, -1, nz(pos[1], 0)))
nRes = ShowLine ? xSMA : na
alertcondition(UseAlerts == true and pos != pos[1] and pos == 1, title='Signal Buy', message='Strategy to change to BUY')
alertcondition(UseAlerts == true and pos != pos[1] and pos == -1, title='Signal Sell', message='Strategy to change to SELL')
alertcondition(UseAlerts == true and pos != pos[1] and pos == 0, title='FLAT', message='Strategy get out from position')
possig =iff(pos[1] != pos,
         iff(reverse and pos == 1, -1,
           iff(reverse and pos == -1, 1, pos)), 0)
if (possig == 1 and timeinrange(timeframe, timerange))
    strategy.entry("Long", strategy.long)
if (possig == -1 and timeinrange(timeframe, timerange))
    strategy.entry("Short", strategy.short)
if (timeinrange(timeframe, timerange) == 0)
    strategy.close_all()

if (UseTPSL)
    strategy.close("Long", when = high > strategy.position_avg_price + TakeProfit, comment = "close buy take profit")
    strategy.close("Long", when = low < strategy.position_avg_price - StopLoss, comment = "close buy stop loss")
    strategy.close("Short", when = low < strategy.position_avg_price - TakeProfit, comment = "close buy take profit")
    strategy.close("Short", when = high > strategy.position_avg_price + StopLoss, comment = "close buy stop loss")
nColor = BarColors ? strategy.position_avg_price != 0  and pos == 1 ? color.green :strategy.position_avg_price != 0 and pos == -1 ? color.red : color.blue : na
barcolor(nColor)
plot(nRes, title='SMA', color=#00ffaa, linewidth=2, style=plot.style_line)
- マーク・ブリン・ベルト・ストップ・ストラテジーとマーティンゲル・倍投
- RSIと移動平均のクロスオーバーマルチタイムフレーム取引戦略
- 123 リバーサルとスムーズなRSIのコンボ戦略
- 2つのEMAクロスオーバー取引戦略
- 動的ATRストップ・ロスト・センターライン戦略
- 双重EMAクロスオーバー戦略
- イチモク・クラウド・デイ・トレーディング戦略
- ダイナミックリスク調整レバレッジ取引システム
- MACDモメンタム戦略
- EMA の 戦略 に 従う 傾向
- SMA イチモク・クロスオーバー戦略
- イチモク・クラウドとMACD戦略
- ウィック逆転パターン戦略
- 海洋理論のグリッド取引戦略
- スーパートレンド戦略
- イチモク脱出戦略
- ダイナミック戦略分析ツール
- ミニ・プルバック・スーパートレンド戦略
- 2つのスムーズ・ムービング・平均取引戦略
- 2倍移動平均のクロスオーバー取引戦略