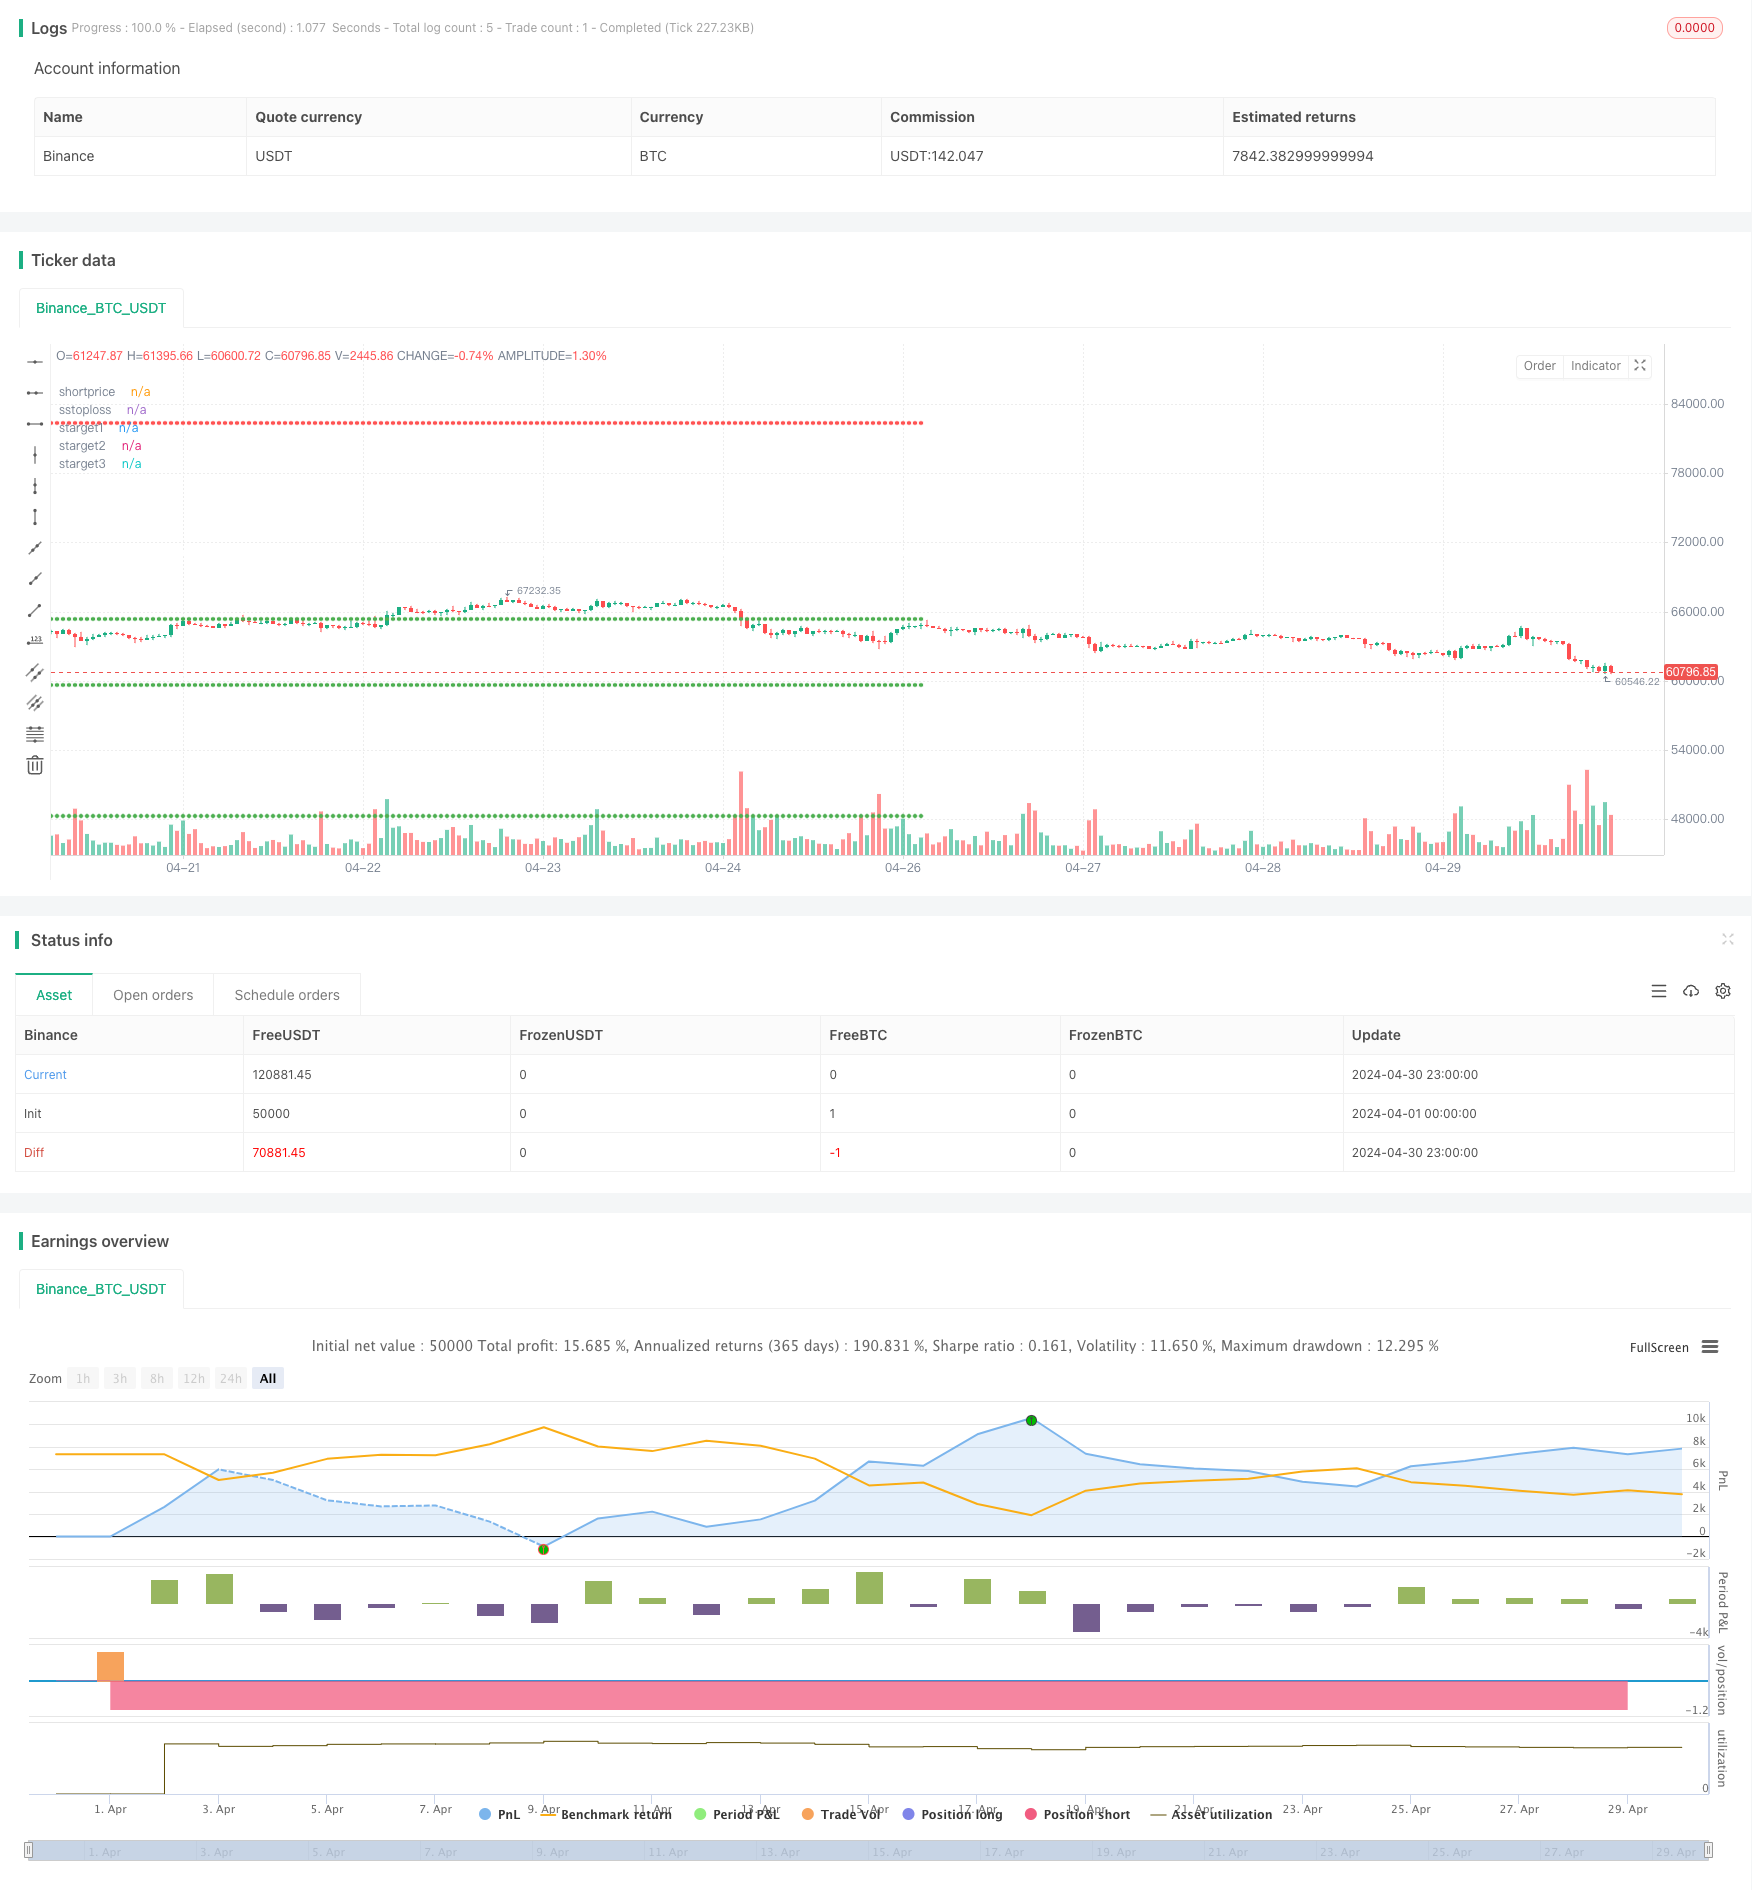
概要
この量化戦略は,主にパラパラ線SAR指標 ((PSAR) とインデックス移動平均 ((EMA) の交差信号を利用し,複数のカスタマイズされた条件を組み合わせて,買入と売却のシグナルを生成する.戦略の主な構想は,PSARは,下からEMAを突破し,一定の条件を満たしたときに買入シグナルを生成する.PSARは,上からEMAを突破し,一定の条件を満たしたときに売却シグナルを生成する.同時に,この戦略は,リスクを制御するために,ストップとストップ・ロスを設定する.
戦略原則
- PSARと30サイクルEMAの計算
- PSARとEMAの交差関係を判断し,対応する標識位を設定する
- PSARとEMAの位置関係,K線の色などの条件を組み合わせて,IGC ((Ideal Green Candle) とIRC ((Ideal Red Candle) を定義する
- IGCとIRCの出現により,買入と売却のシグナルが判断される
- ストップとストップを設定し,ストップは購入価格の8%,16%および32%,ストップは購入価格の16%;販売価格の8%,16%および32%,ストップは販売価格の16%
- 取引時とポジションの状態に応じて,買い,売り,または平仓操作を実行する
戦略的優位性
- 複数の指標と条件を組み合わせて,信号の信頼性を向上させる
- リスクとリターンを柔軟に制御するための複数のストップとストップ・ロスの設定
- 異なる市場状況に合わせて,買取と販売のフィルター条件を設定し,戦略の適応性を向上させる
- コードはモジュール化され,理解し,修正しやすい.
戦略リスク
- 策略のパラメータ設定は,すべての市場環境に適していない可能性があり,実情に合わせて調整する必要があります.
- 波動的な市場では,この戦略は頻繁に取引シグナルが発生し,取引コストが増加する可能性があります.
- この戦略は市場動向の判断が欠けていて,強いトレンドの市場でチャンスを逃す可能性があります.
- ストップ・ローンの設定は,極端な状況からのリスクを完全に回避できない
戦略最適化の方向性
- より多くの技術指標や市場情緒指標を導入し,信号の正確性と信頼性を向上させる
- 停止と停止位置の設定を最適化し,動的な停止停止または波動率に基づく停止停止を導入することを検討できます.
- 異なる市場状況に対応し,異なる取引パラメータとルールを設定し,戦略の適応性を向上させる
- 資金管理モジュールに追加し,口座のエクイティ比バランスなどの要因に基づいて,ポジションとリスク暴露を動的に調整する
要約する
この量化戦略は,PSARとEMAの指標に基づいて,複数のカスタマイズされた条件とルールによって,買入と売却のシグナルを生成する.この戦略は,ある程度の適応性と柔軟性を持ち,また,リスクを制御するためにストップ・ストップ・ロスを設定している.しかし,戦略のパラメータ設定とリスク管理の面で最適化の余地がある.全体的に,この戦略は,基礎のテンプレートとして使用することができ,さらなる最適化と改善によって,安定した取引戦略になる可能性が高い.
ストラテジーソースコード
/*backtest
start: 2024-04-01 00:00:00
end: 2024-04-30 23:59:59
period: 1h
basePeriod: 15m
exchanges: [{"eid":"Binance","currency":"BTC_USDT"}]
*/

// This Pine Script™ code is subject to the terms of the Mozilla Public License 2.0 at https://mozilla.org/MPL/2.0/
// © SwapnilRaykar

//@version=5
strategy("aj sir second project", overlay=true, margin_long=100, margin_short=100)

start=input("0915-1515","session time")
st11=time(timeframe.period,start)
st=st11>0
et= not st

psar=ta.sar(0.02,0.02,0.2)
emared=ta.ema(close,30)
//plot(psar,"psar",color.yellow,style = plot.style_cross)
//plot(emared,"emared",color.red)
var crodownflag=0
var croupflag=0

var igcflag=0

var ircflag=0

cdown1=ta.crossunder(psar,emared)  and not (psar<close and psar[1]>close[1])
cup1=ta.crossover(psar,emared) and not (psar>close and psar[1]<close[1])

cdown=ta.crossunder(psar,emared)
cup=ta.crossover(psar,emared)


green_candle=close>open
red_candle=close<open

if ta.crossunder(psar,emared) and crodownflag==0  and not (psar<close and psar[1]>close[1])
    crodownflag:=1
else if cdown and crodownflag==1
    crodownflag:=0


if crodownflag==1 and green_candle and igcflag==0
    igcflag:=1
else if cdown and igcflag==1
    igcflag:=0

//plot(igcflag,"igcflag",color.lime)

if ta.crossover(psar,emared) and croupflag==0 and not (psar>close and psar[1]<close[1])
    croupflag:=1
else if cdown and croupflag==1
    croupflag:=0

//plot(crodownflag,"crodownflag",color.white)
irc_cond=croupflag==1 or cup

if (croupflag==1 and red_candle and ircflag==0)
    ircflag:=1
else if cup and croupflag==1
    ircflag:=0

igc_candle1=(igcflag==1 and igcflag[1]==0) or (cdown1 and green_candle)
irc_candle1=(ircflag==1 and ircflag[1]==0) or (cup1 and red_candle)
///////////////////////////
dm=dayofmonth(time)
newday=dm!=dm[1]
dmc=dm==ta.valuewhen(bar_index==last_bar_index,dm,0)

///////////////////////////////////////////
var irc_there=0

if irc_candle1[1] and irc_there==0
    irc_there:=1
else if cdown and irc_there==1
    irc_there:=0

irc_candle=irc_candle1 and irc_there==0// and dmc

var igc_there=0

if igc_candle1[1] and igc_there==0
    igc_there:=1
else if cup and igc_there ==1
    igc_there:=0

igc_candle=igc_candle1 and igc_there==0// and dmc
/////////// to get rid of irc being valid even after crossdown
var valid_igc_low=0
var valid_irc_high=0

if irc_candle[1] and valid_irc_high==0
    valid_irc_high:=1
else if igc_candle and valid_irc_high==1
    valid_irc_high:=0

if igc_candle and valid_igc_low==0
    valid_igc_low:=1
else if irc_candle and valid_igc_low==1
    valid_igc_low:=0


igc_low=ta.valuewhen(igc_candle,low,0)
irc_high=ta.valuewhen(irc_candle,high,0)
//////////////////////////////
//plot(irc_high,"irc_high",color.red)

//plot(valid_irc_high,"valid_irc_high",color.purple)

buy12=ta.crossunder(close,igc_low) and valid_igc_low==1
buy1=buy12[1]

short12=ta.crossover(close,irc_high) and valid_irc_high==1
short1=short12[1]
//plotshape(short12,"short12",shape.arrowdown,color=color.purple)

// plotshape(igc_candle,"igc_candle",shape.arrowdown,color=color.green)
// plotshape(irc_candle,"irc_candle",shape.arrowdown,color=color.red)
//plotshape((psar<close and psar[1]>close[1]) ,"croup",shape.arrowdown,color=color.red)
//plotshape(cup ,"croup",shape.arrowdown,color=color.orange)

buyprice=ta.valuewhen(buy1 and strategy.position_size[1]==0,open,0)
shortprice=ta.valuewhen(short1 and strategy.position_size[1]==0,open,0)

btarget1=buyprice+(buyprice*0.08)
btarget2=buyprice+(buyprice*0.16)
btarget3=buyprice+(buyprice*0.32)
bstoploss=buyprice-(buyprice*0.16)

starget1=shortprice-(shortprice*0.08)
starget2=shortprice-(shortprice*0.16)
starget3=shortprice-(shortprice*0.32)
sstoploss=shortprice+(shortprice*0.16)

if buy12 and strategy.position_size==0 and st11
    strategy.entry("buy",strategy.long)

if strategy.position_size >0
    strategy.exit("sell",from_entry = "buy",stop=bstoploss,limit=btarget3)

if short12 and strategy.position_size==0 and st11
    strategy.entry("short",strategy.short)

if strategy.position_size<0
    strategy.exit("cover",from_entry = "short",stop = sstoploss,limit = starget3)

if et
    strategy.close_all(comment = "timeover")

plot(strategy.position_size>0?buyprice:na,"buyprice",color.white, style=plot.style_circles )
plot(strategy.position_size>0?bstoploss:na,"bstoploss",color.red, style=plot.style_circles )
plot(strategy.position_size>0?btarget1:na,"btarget1",color.green, style=plot.style_circles )
plot(strategy.position_size>0?btarget2:na,"btarget2",color.green, style=plot.style_circles )
plot(strategy.position_size>0?btarget3:na,"btarget3",color.green, style=plot.style_circles )

plot(strategy.position_size<0?shortprice:na,"shortprice",color.white, style=plot.style_circles )
plot(strategy.position_size<0?sstoploss:na,"sstoploss",color.red, style=plot.style_circles )
plot(strategy.position_size<0?starget1:na,"starget1",color.green, style=plot.style_circles )
plot(strategy.position_size<0?starget2:na,"starget2",color.green, style=plot.style_circles )
plot(strategy.position_size<0?starget3:na,"starget3",color.green, style=plot.style_circles )