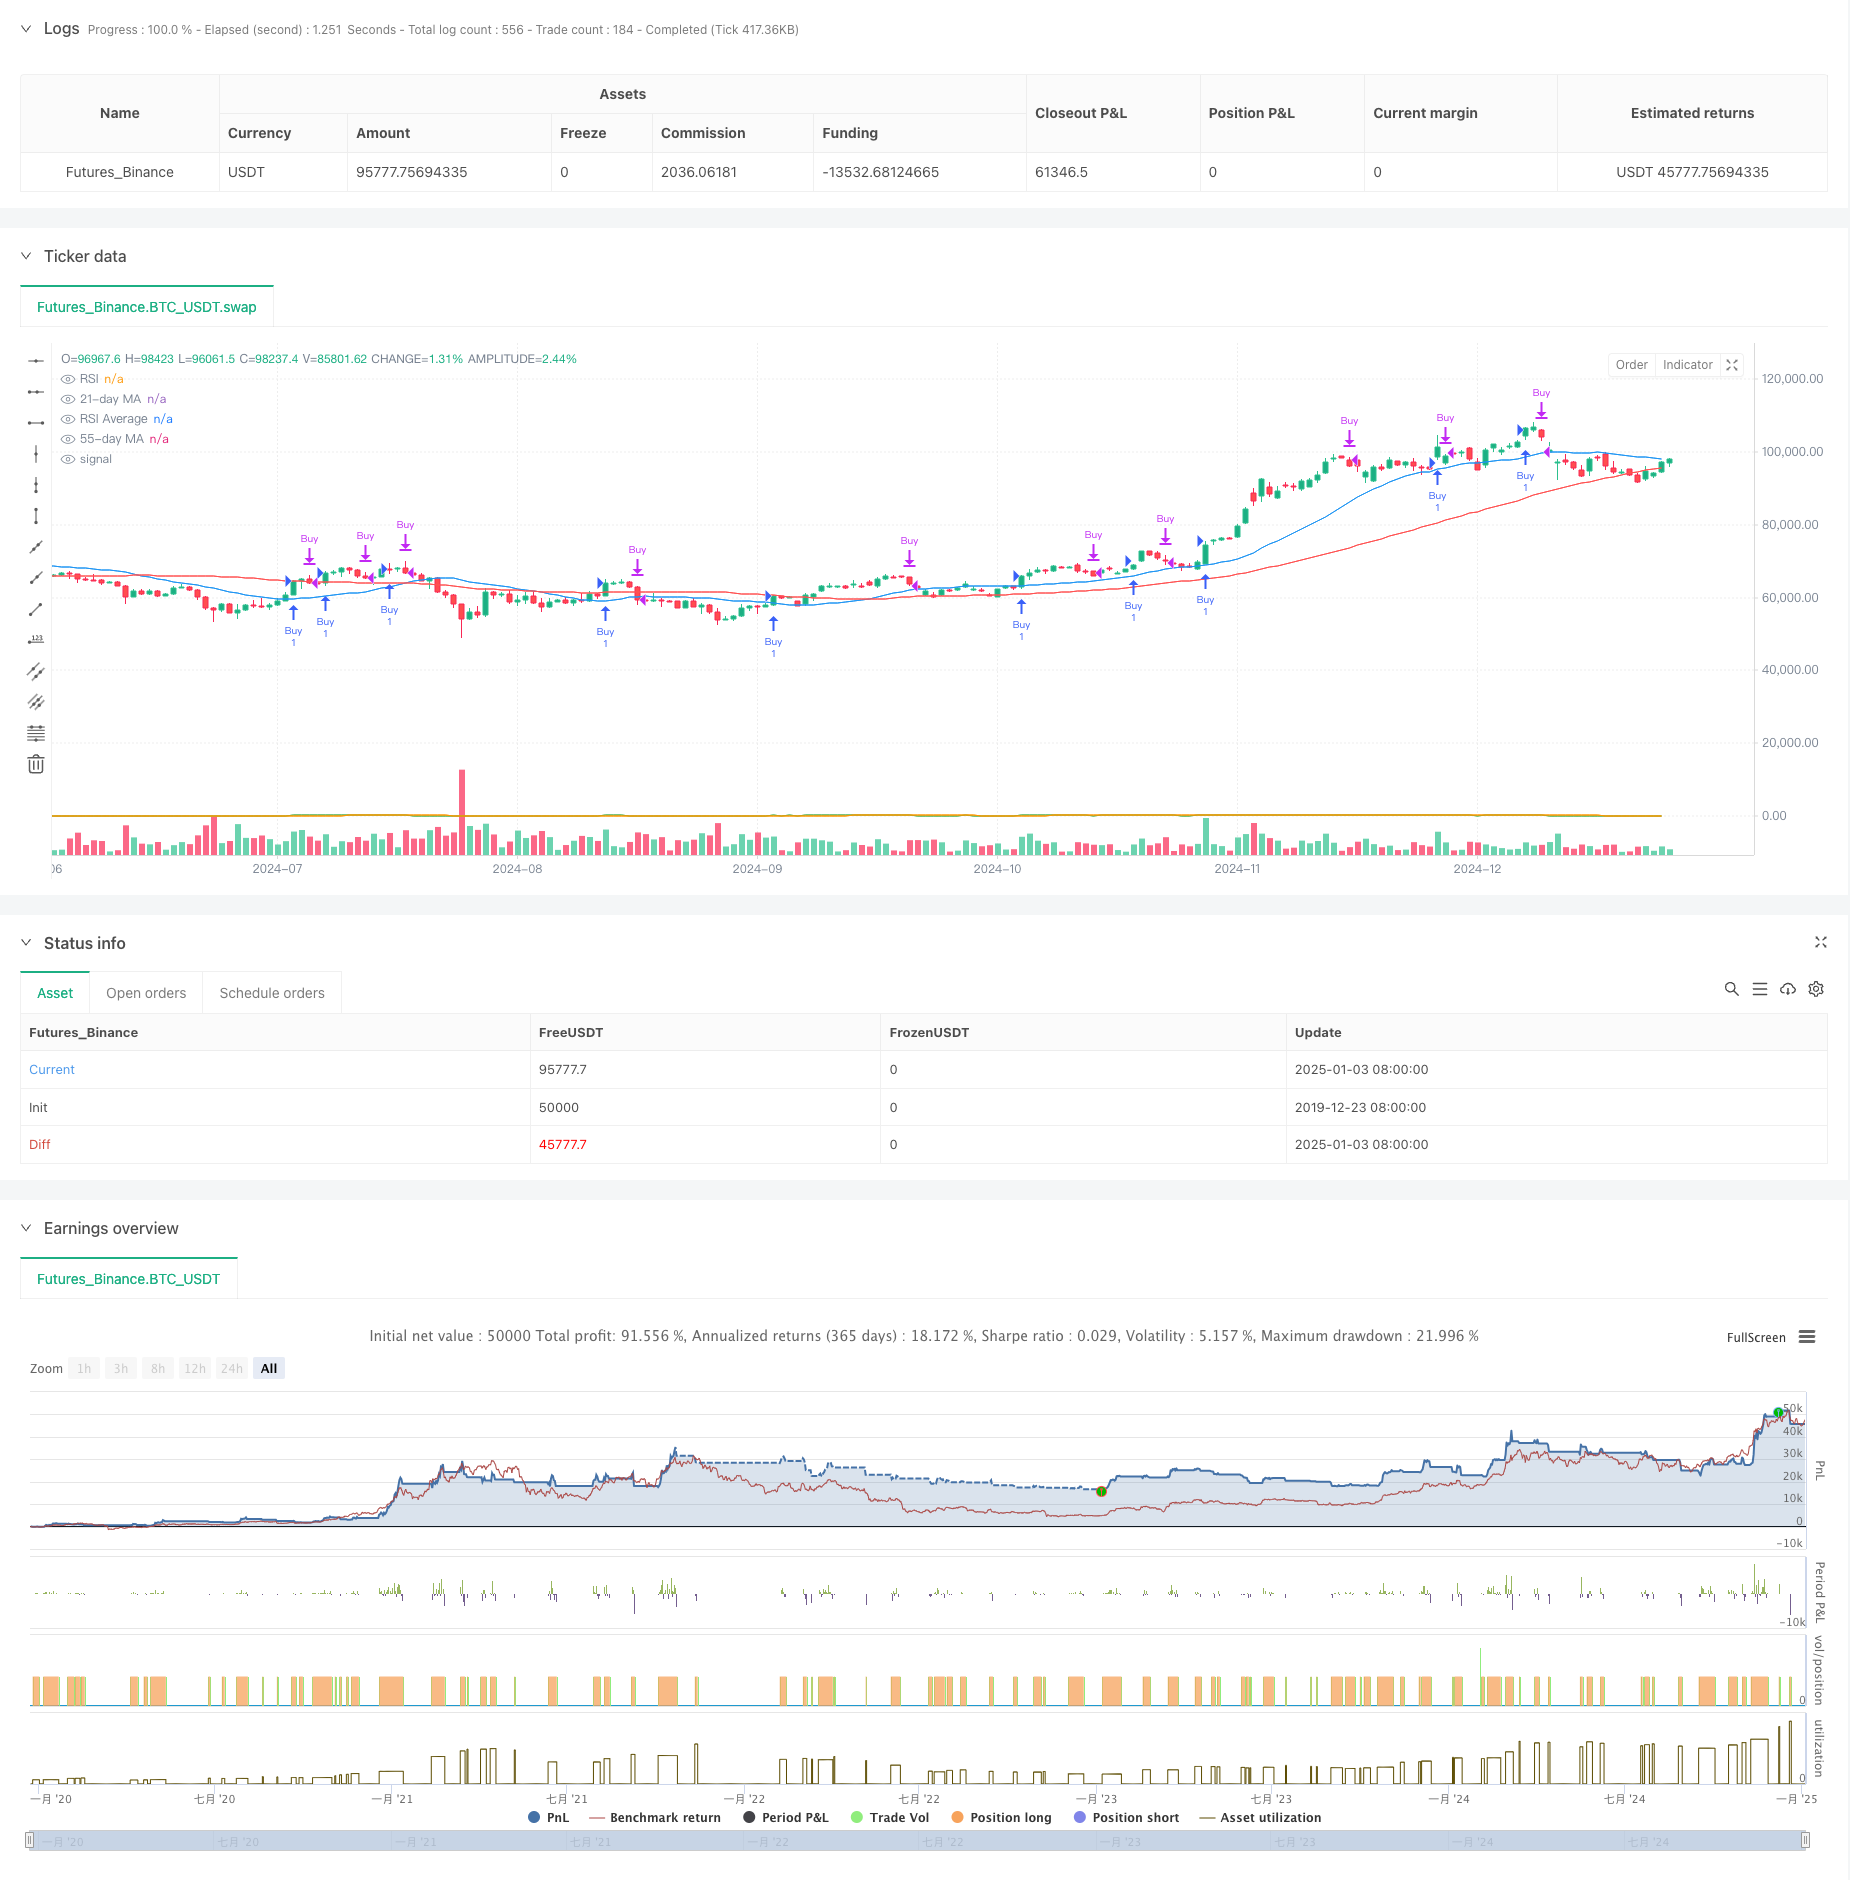
戦略をフォローするRSIモメントとボリュームトレンドを持つ二期移動平均
作者: リン・ハーンチャオチャン, 日付: 2025-01-06 13:45:16タグ:RSIマルチSMAVOL

概要
この戦略は,2つの期間の移動平均値 (21日および55日),RSIモメントインジケーター,およびボリューム分析を組み合わせるトレンドフォロー戦略である.この戦略は,トレンド方向を確認し,トレンドの正確性を向上させるためにRSIおよびボリュームインジケーターを通じて取引信号をフィルタリングしながら,価格情報 (価格,モメント,ボリューム) を3次元から分析する.この戦略には,短期移動平均値の価格突破,RSIの平均値を超越し,トレンドの有効性を確認するためのボリューム増加が必要である.
戦略の原則
この戦略は三重フィルタリングメカニズムを使用しています.
- 価格フィルター:21日間の移動平均値と55日間の移動平均値を使用して価格動向を確認し,21日間のMAを超える価格で,潜在的な長期機会を示します.
- モメントフィルター: RSI が平均値を超えるとモメント方向を確認する 13 期間の RSI とその 13 期間の平均値を計算する
- ボリュームフィルター: 21 期間のボリューム移動平均を計算し,エントリーボリュームが平均を上回ることを要求し,市場参加を確認します.
購入条件は,次の条件をすべて要求します.
- 閉じる価格 21 日間MAを超える
- RSI は平均より高い
- 容量より大きいMA
販売条件は次のいずれかを要求します:
- 価格が55日間MAを下回る
- RSIは平均を下回る
戦略 の 利点
- 多次元分析: 価格,勢い,およびボリュムの包括的な分析を通じて信号の信頼性を向上させる
- トレンド確認: 2 期間の移動平均は,トレンドの方向性と強さをよりよく確認します.
- 動的適応:RSIインジケーターは市場の変動に動的に適応し,動向の変化を把握するのに役立ちます.
- ボリューム・価格調整: ボリュームをフィルター条件として利用し,市場活動が活発な期間中に取引が起こるようにします
- リスク管理: リスク管理に役立つ明確なストップ・ロスの条件を設定する
戦略リスク
- 遅延リスク: 移動平均値は本質的に遅延する指標であり, 遅延したエントリーと出口を引き起こす可能性があります.
- 範囲限定市場リスク:横向市場では頻繁に誤ったブレイクシグナルを生む可能性があります.
- パラメータ敏感性: 戦略の有効性はパラメータ設定に敏感であり,異なる市場環境で調整する必要があります.
- コストリスク:頻繁な取引は高額な取引コストを伴う可能性があります
- 流動性リスク:低流動性市場では,理想的な価格で取引を行うのは困難かもしれません.
戦略の最適化方向
- パラメータ調整: 市場の変動に基づいて移動平均期を動的に調整するための適応メカニズムを導入する
- シグナル確認: トレンド強度指標 (ADX などの) を追加し,さらにシグナルをフィルターします.
- 利得の最適化: 強い傾向においてより多くの利益を得るために動的な利得のメカニズムを設計する
- ポジション管理: シグナル強さと市場の変動に基づいてポジションサイズを動的に調整する
- 時間フィルタリング: 不利な取引期間を避けるために取引時間窓を追加
概要
この戦略は,技術分析の3つの必須要素 (価格,量,勢い) を包括的に利用するトレンドフォロー戦略である.複数のフィルタリングメカニズムを通じて,戦略はリスク制御能力を維持しながら信号の信頼性を保証する.いくつかの固有の制限があるにもかかわらず,継続的な最適化と改善を通じて,戦略は実際の取引で安定した収益を達成する可能性がある.戦略は明確なトレンドと十分な流動性のある市場で特にうまく機能する可能性があります.
/*backtest
start: 2019-12-23 08:00:00
end: 2025-01-04 08:00:00
period: 1d
basePeriod: 1d
exchanges: [{"eid":"Futures_Binance","currency":"BTC_USDT"}]
*/

//@version=5
strategy("21/55 MA with RSI Crossover", overlay=true)

// Inputs for moving averages
ma21_length = input.int(21, title="21-day Moving Average Length", minval=1)
ma55_length = input.int(55, title="55-day Moving Average Length", minval=1)

// RSI settings
rsi_length = input.int(13, title="RSI Length", minval=1)
rsi_avg_length = input.int(13, title="RSI Average Length", minval=1)

// Moving averages
ma21 = ta.sma(close, ma21_length)
ma55 = ta.sma(close, ma55_length)

// Volume settings
vol_ma_length = input.int(21, title="Volume MA Length", minval=1)

// Volume moving average
vol_ma = ta.sma(volume, vol_ma_length)

// RSI calculation
rsi = ta.rsi(close, rsi_length)
rsi_avg = ta.sma(rsi, rsi_avg_length)

// Buy condition
// buy_condition = close > ma21 and ta.crossover(rsi, rsi_avg) and volume > vol_ma
buy_condition = close > ma21 and rsi > rsi_avg and volume > vol_ma

// Sell condition
// sell_condition = close < ma55 or ta.crossunder(rsi, rsi_avg)
sell_condition = ta.crossunder(close, ma55) or ta.crossunder(rsi, rsi_avg)

// Execute trades
if (buy_condition)
    strategy.entry("Buy", strategy.long, comment="Buy Signal")

if (sell_condition)
    strategy.close("Buy", comment="Sell Signal")

// Plot moving averages for reference
plot(ma21, color=color.blue, title="21-day MA")
plot(ma55, color=color.red, title="55-day MA")

// Plot RSI and RSI average for reference
rsi_plot = input.bool(true, title="Show RSI?", inline="rsi")
plot(rsi_plot ? rsi : na, color=color.green, title="RSI")
plot(rsi_plot ? rsi_avg : na, color=color.orange, title="RSI Average")
関連性
- 取引戦略をフォローするマルチテクニカル指標傾向
- 多指標動的波動性取引戦略
- MA,SMA,MA傾斜,ストップ損失を後押しし,再入力
- マルチテクニカル指標クロストレンド追跡戦略:RSIとストカスティックRSIシネージ取引システム
- 動的サポート・レジスタンスのブレイク 移動平均クロスオーバー戦略
- 52週間の高低/平均量/量突破戦略
- 多期移動平均値とRSIモメントの交差トレンド 戦略に従う
- 移動平均フィルター戦略による3回検証されたRSI平均逆転
- 多期移動平均値とRSIモメントクロス戦略
- 2つの移動平均RSIトレンドモメンタム戦略
もっと
- 相対的な強さとRSIに基づく戦略をフォローするダイナミックトレンド
- 多指標動的モメントクロス戦略
- 運動量と平均逆転を組み合わせた高周波定量戦略
- 動的ATR調整EMAクロスオーバー戦略
- 先進的な圧力逆転とキャンドルスタイク重複戦略
- 2倍指数関数移動平均勢力のクロスオーバー取引戦略
- RSIとボリンジャー帯のシネージストラテジー
- モメントトレンド イチモク・クラウド・トレーディング・戦略
- 多動平均スーパートレンドとボリンジャーブレイクトレード戦略
- 多指標動的移動平均のクロスオーバー量的な戦略
- RSI トレンドブレークスルーとモメンタム強化取引戦略
- 定量的な取引戦略をフォローする二重EMAクロスオーバー動的傾向
- アダプティブ・トレンド・フロー・マルチフィルター・トレーディング・戦略
- ダイナミック・ダブル・テクニカル・インディケーター 過剰販売・過剰購入の確認取引戦略
- 多指標動的トレーリングストップ取引戦略
- 双 EMA ストカスティック オシレーター システム: トレンドフォローとモメンタムを組み合わせた定量的な取引モデル
- 多指標動的波動性取引戦略
- ダイナミック・トレード理論:指数的な移動平均値と累積的なボリューム期間クロスオーバー戦略
- ADX トレンド強度フィルタリングシステムによるダイナミック・EMA・クロスオーバー戦略
- 多期トレンド線形吸収パターン 定量的な取引戦略