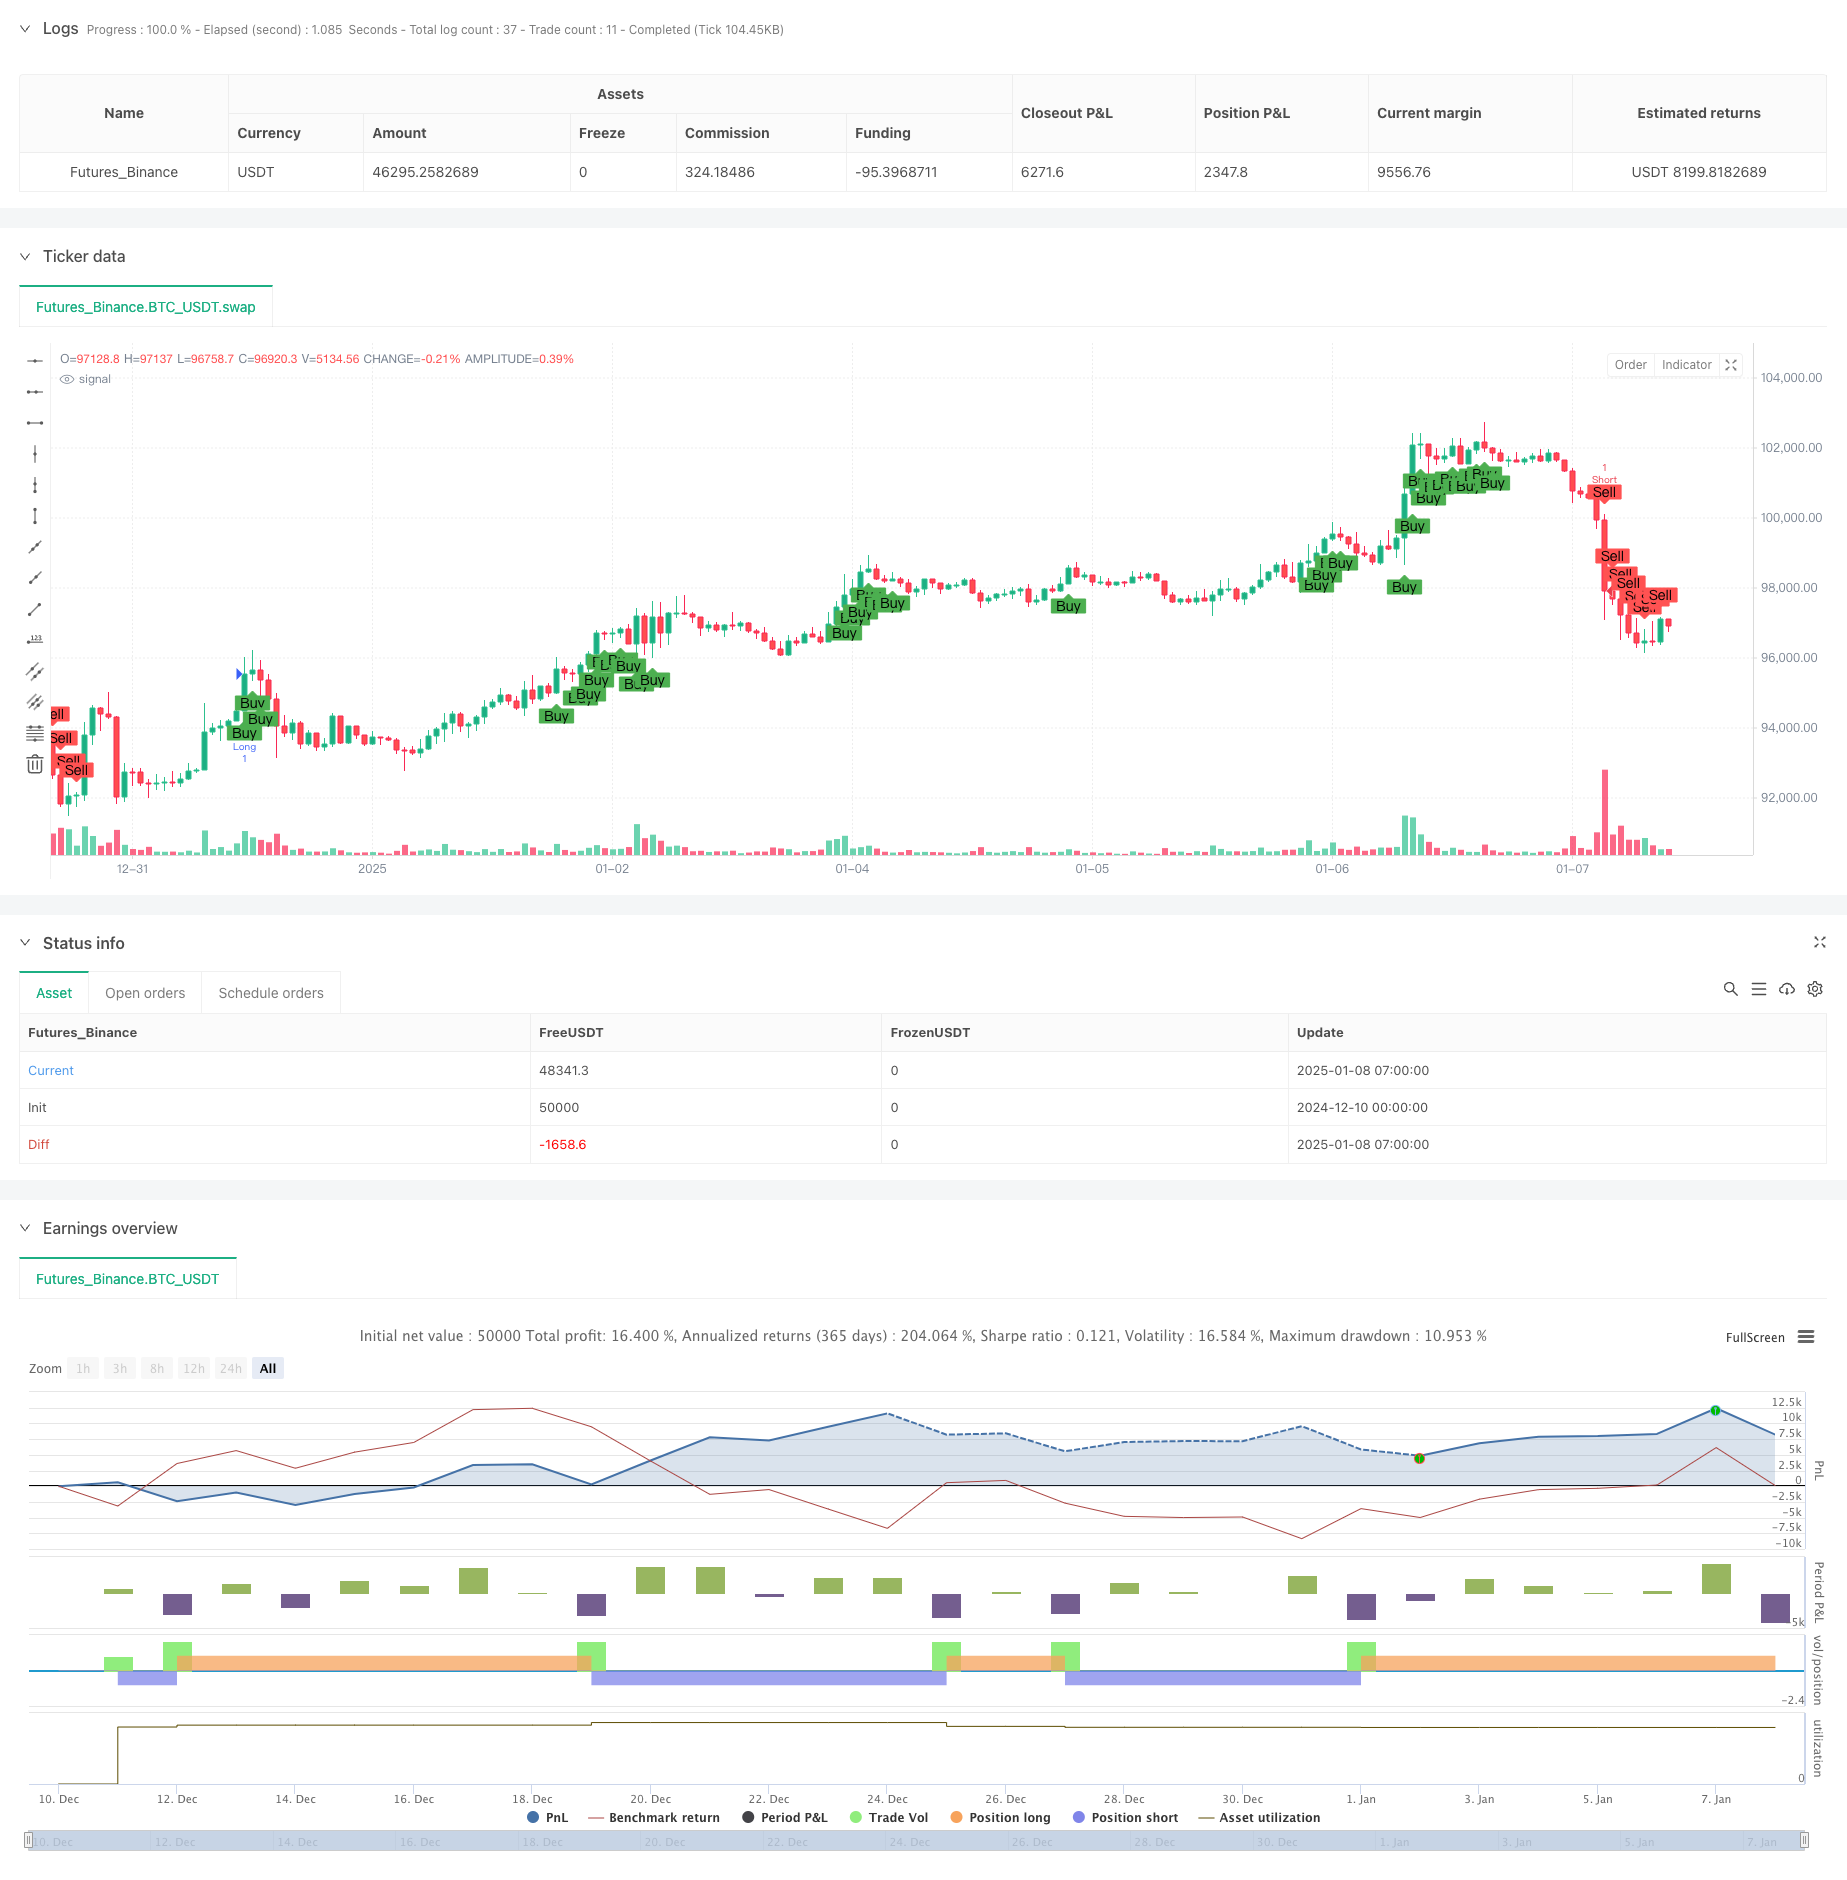
双 EMA-RSI 差異戦略:指数関数移動平均値と相対強度に基づいたトレンドキャプチャシステム
作者: リン・ハーンチャオチャン開催日:2025年01月10日 15:03:06タグ:エイマRSI

概要
この戦略は,指数移動平均値 (EMA) と相対強度指数 (RSI) を組み合わせたトレンドフォロー戦略である.この戦略は,RSIオーバーバイト/オーバーセールレベルとRSIディバージェンスを取り入れながら,高速および遅いEMAのクロスオーバーをモニタリングすることによって取引信号を特定し,市場のトレンドを効果的に把握する.1時間のタイムフレームで動作し,複数の技術指標の検証を通じて取引精度を向上させる.
戦略の原則
基本論理には次の主要な要素が含まれます.
1. 9 期間の EMA と 26 期間の EMA を使ってトレンド方向を決定し,高速線がスローラインの上にあるとき上昇傾向が示されます.
2. 長期および短期信号の
戦略 の 利点
- 複数の技術指標の相互検証は信号の信頼性を向上させる
- RSIの差異を検出することで,誤ったブレイクリスクが軽減されます.
- トレンドフォローとオーバー買い/オーバーセール条件の利点を組み合わせる
- パラメータは異なる市場特性に最適化できます
- わかりやすく実行できる 明確な戦略論理
戦略リスク
- EMAは遅れている指標として,不適正なエントリーポイントにつながる可能性があります.
- RSIは,変動市場で過剰な信号を生む可能性があります.
- 格差の検出は,特に不安定な市場において,誤った読み上げを生む可能性があります.
- 市場が急激に逆転する際に,大幅な引き下げが可能である 緩和措置
- ストップ・ロストとテイク・プロフィートの設定を追加する
- 容量指標の検証を追加することを検討する
- RSIの限界値を変動市場で調整する
オプティマイゼーションの方向性
- 市場変動に基づく適応性RSIの
値を導入する - 信号確認のための音量指標を組み込む
- より正確なディバージェンス検出アルゴリズムの開発
- ストップ損失と利益管理のメカニズムを追加
- 市場変動フィルターを追加することを検討する
概要
この戦略は,移動平均値,モメント指標,および分散分析を組み合わせて比較的完全な取引システムを構築する.誤判リスクを効果的に減らすために複数の信号検証を強調する.固有の遅延があるにもかかわらず,この戦略はパラメータ最適化とリスク管理の改善を通じて実用的な価値を持っています.
/*backtest
start: 2024-12-10 00:00:00
end: 2025-01-08 08:00:00
period: 1h
basePeriod: 1h
exchanges: [{"eid":"Futures_Binance","currency":"BTC_USDT"}]
*/

//@version=5
strategy("EMA9_RSI_Strategy_LongShort", overlay=true)

// Parameters
fastLength = input.int(9, minval=1, title="Fast EMA Length")
slowLength = input.int(26, minval=1, title="Slow EMA Length")
rsiPeriod = input.int(14, minval=1, title="RSI Period")
rsiLevelLong = input.int(65, minval=1, title="RSI Level (Long)")
rsiLevelShort = input.int(35, minval=1, title="RSI Level (Short)")

// Define 1-hour timeframe
timeframe_1h = "60"

// Fetch 1-hour data
high_1h = request.security(syminfo.tickerid, timeframe_1h, high)
low_1h = request.security(syminfo.tickerid, timeframe_1h, low)
rsi_1h = request.security(syminfo.tickerid, timeframe_1h, ta.rsi(close, rsiPeriod))

// Current RSI
rsi = ta.rsi(close, rsiPeriod)

// Find highest/lowest price and corresponding RSI in the 1-hour timeframe
highestPrice_1h = ta.highest(high_1h, 1) // ราคาสูงสุดใน 1 ช่วงของ timeframe 1 ชั่วโมง
lowestPrice_1h = ta.lowest(low_1h, 1)   // ราคาต่ำสุดใน 1 ช่วงของ timeframe 1 ชั่วโมง
highestRsi_1h = ta.valuewhen(high_1h == highestPrice_1h, rsi_1h, 0)
lowestRsi_1h = ta.valuewhen(low_1h == lowestPrice_1h, rsi_1h, 0)

// Detect RSI Divergence for Long
bearishDivLong = high > highestPrice_1h and rsi < highestRsi_1h
bullishDivLong = low < lowestPrice_1h and rsi > lowestRsi_1h
divergenceLong = bearishDivLong or bullishDivLong

// Detect RSI Divergence for Short (switch to low price for divergence check)
bearishDivShort = low > lowestPrice_1h and rsi < lowestRsi_1h
bullishDivShort = high < highestPrice_1h and rsi > highestRsi_1h
divergenceShort = bearishDivShort or bullishDivShort

// Calculate EMA
emaFast = ta.ema(close, fastLength)
emaSlow = ta.ema(close, slowLength)

// Long Conditions
longCondition = emaFast > emaSlow and rsi > rsiLevelLong and not divergenceLong

// Short Conditions
shortCondition = emaFast < emaSlow and rsi < rsiLevelShort and not divergenceShort

// Plot conditions
plotshape(longCondition, title="Buy", location=location.belowbar, color=color.green, style=shape.labelup, text="Buy")
plotshape(shortCondition, title="Sell", location=location.abovebar, color=color.red, style=shape.labeldown, text="Sell")

// Execute the strategy
if (longCondition)
    strategy.entry("Long", strategy.long, comment="entry long")

if (shortCondition)
    strategy.entry("Short", strategy.short, comment="entry short")

// Alert
alertcondition(longCondition, title="Buy Signal", message="Buy signal triggered!")
alertcondition(shortCondition, title="Sell Signal", message="Sell signal triggered!")
関連性
- 複合戦略をフォローする多期RSIモメンタムと三重EMAトレンド
- 双指数移動平均値と相対強度指標のクロスオーバー戦略
- 動的移動平均傾向をRSI確認取引戦略でフォローする
- 低値探知器
- EMAクロスオーバーフィボナッチ逆転戦略
- EMA,RSI,ボリューム価格トレンド
- EMAの上昇型クロスオーバー戦略
- ポジションスケーリングを含む多期間のRSI-EMAモメンタム取引戦略
- 双 EMA RSI モメンタム トレンド 逆転 トレーディング システム - EMA と RSI クロスオーバー をベースにしたモメンタム 突破戦略
- RSIとEMAを組み合わせた多期量的なダイナミック取引戦略
もっと
- 強化された価格量動向の勢い戦略
- ダイナミックな利益/損失管理システムを持つインテリジェント移動平均のクロスオーバー戦略
- アダプティブ マルチMA モメントム・ブレークスルー・トレーディング・戦略
- アダプティブ・モメント・ミディアン・リバーション・クロスオーバー戦略
- 逆トレード最適化戦略を持つ適応型双方向EMAトレンド取引システム
- ATR ベースのダイナミックストップ・ロスの最適化による二重 EMA プルバック・トレーディングシステム
- 複数の期間の段階交差とEMAのトレンドフォロー戦略
- RSIの振動戦略をフォローする多動平均のクロストレンド
- 多期ボリンジャーバンド 変動リスク制御モデル付きのトレンドブレイク戦略
- ダイナミックサポートとレジスタンス アダプティブピボット取引戦略
- 多期超トレンド ダイナミックピラミッド型取引戦略
- 長期トレンドSMAクロスオーバー量的な戦略
- 多技術指標 量的な取引戦略をフォローする融合傾向
- 多技術指標 モメントMA トレンド 戦略をフォローする
- スマート R2R ベースのストップ・ロスの管理を備えた三重 EMA クロスオーバー取引システム
- ダイナミック・ボラティリティ・ドリブン・ハイ・フリクション・EMA・クロスオーバー・量子戦略
- リスクマネジメントシステム付きの双重技術指標モメンタム逆転取引戦略
- EMA-スムーズなRSIとATRダイナミックストップ・ロス/テイク・プロフィートに基づいた多時間枠量的な取引戦略
- アダプティブ・フィボナッチ・ボリンジャー・バンド戦略分析
- 複数のタイムフレームのキャンドルスタイク・パターンの取引戦略