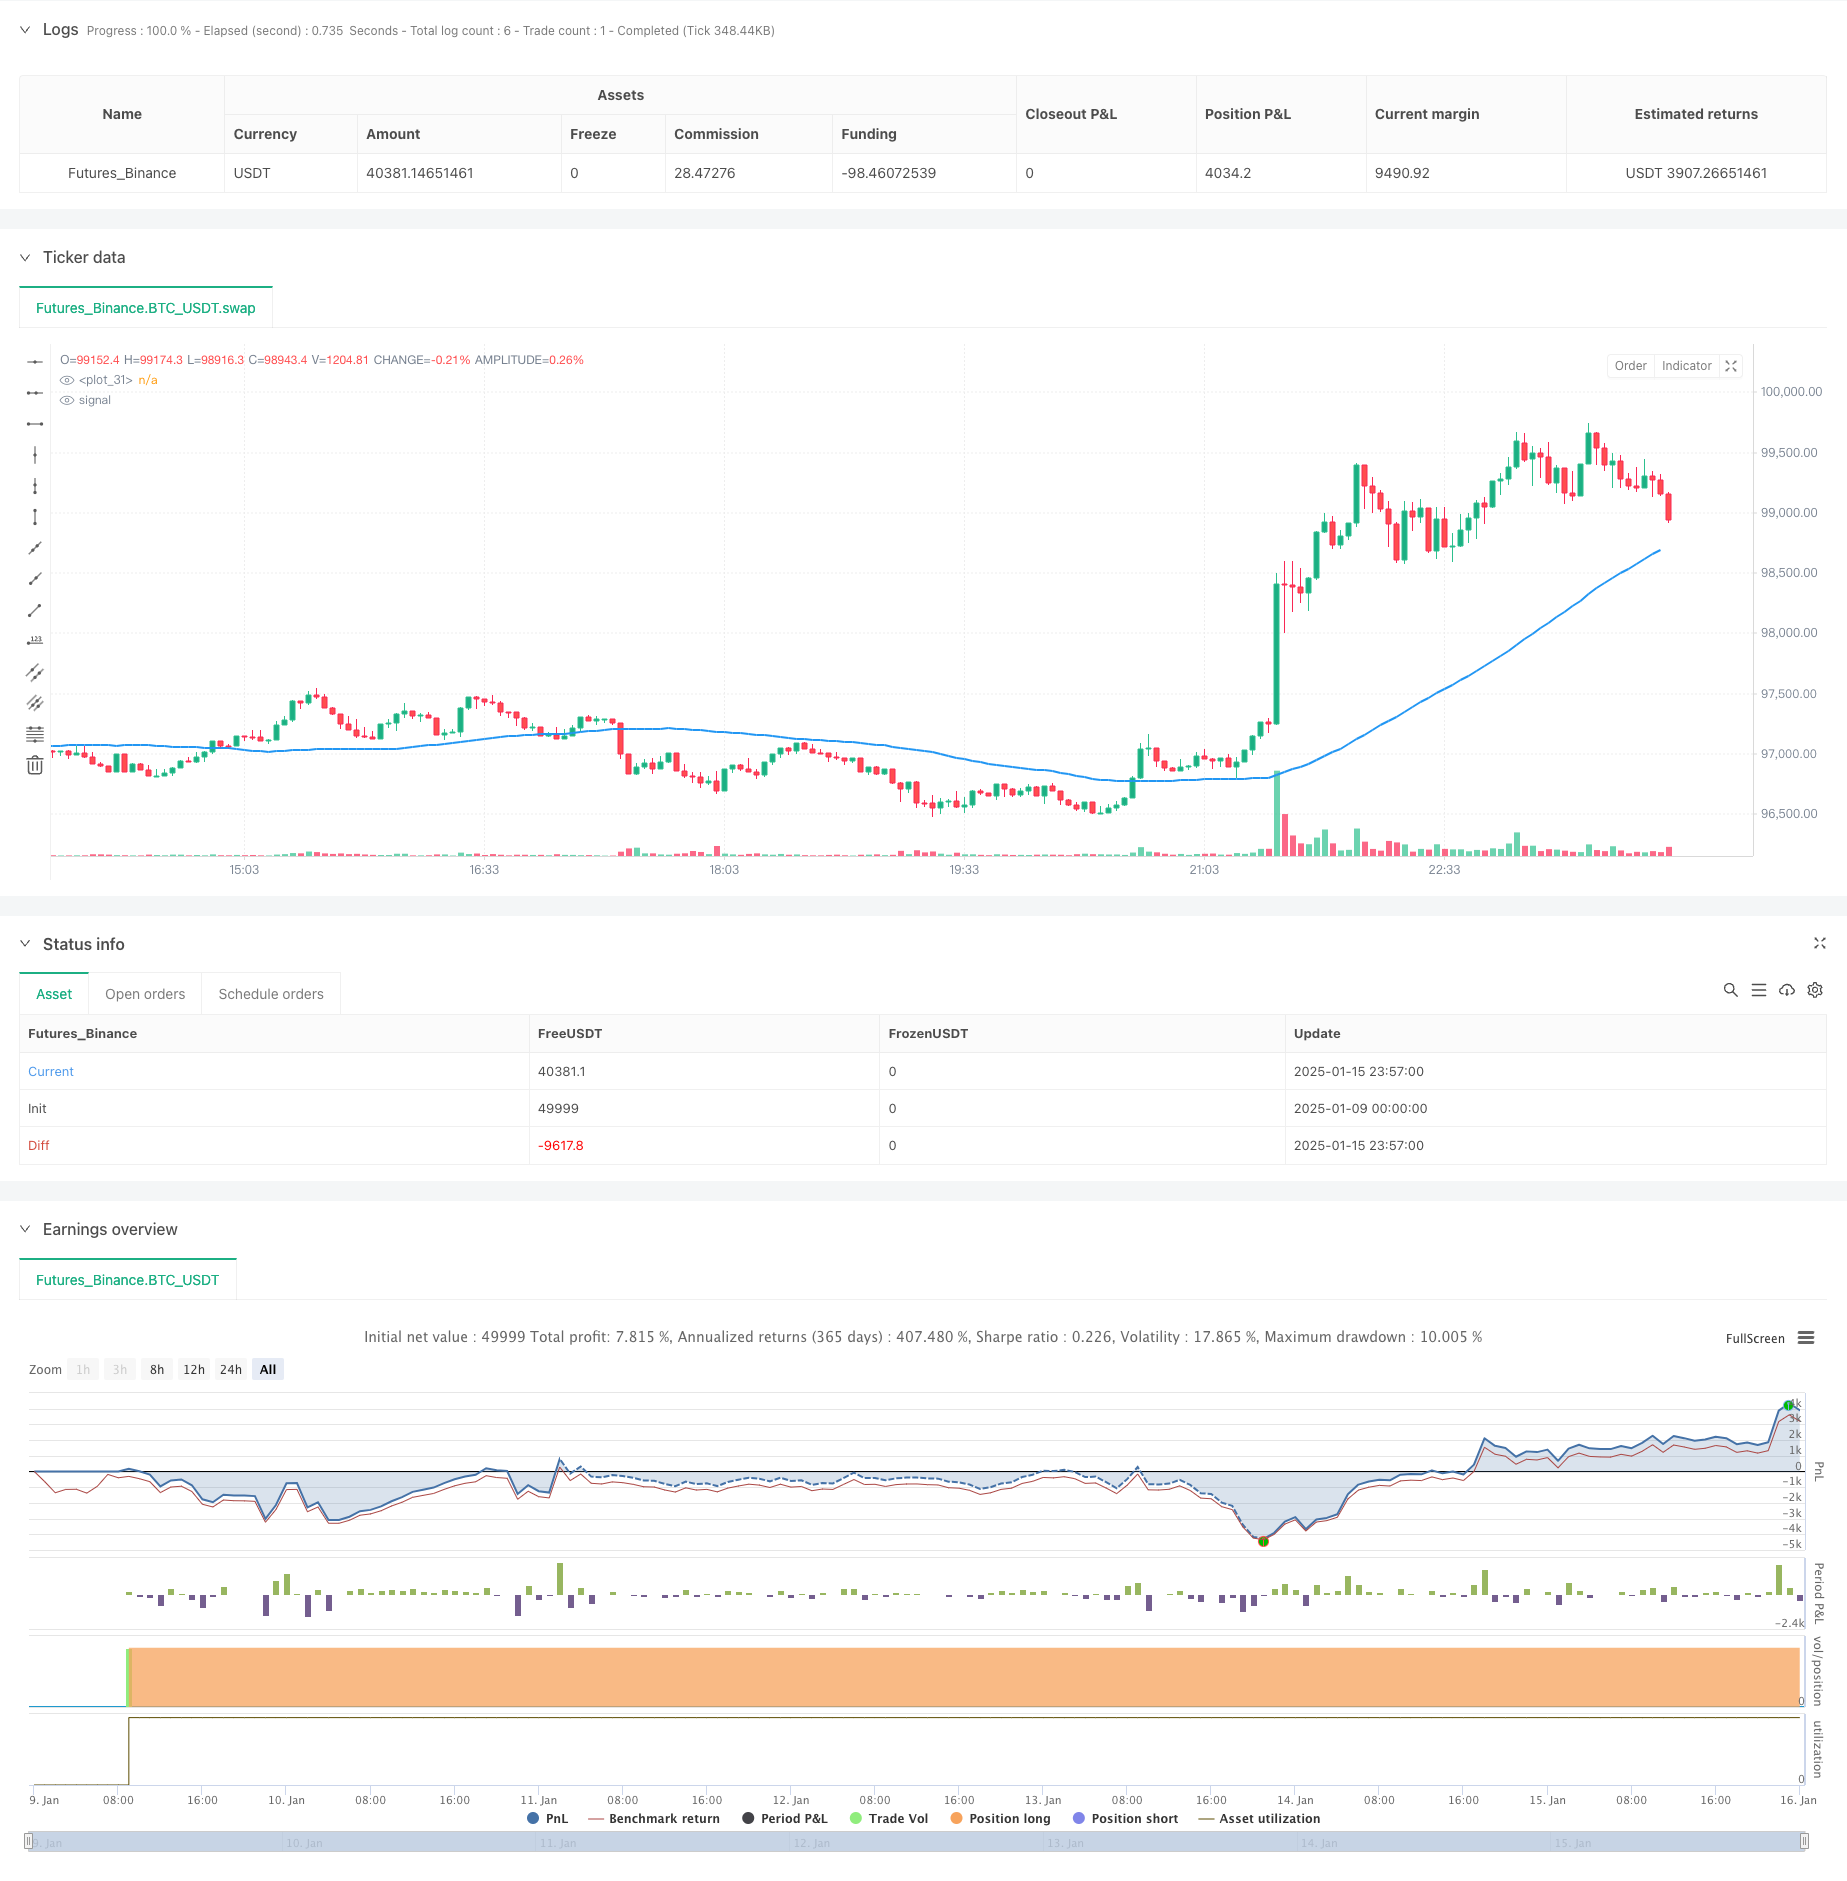
年末トレンド モメンタム・トレード・ストラテジーの後 ((60日間のMAブレイク)
作者: リン・ハーンチャオチャン開催日:2025年1月17日 14:55:20タグ:マルチSMAスロープエイマATRROC

概要
この戦略は,トレンドフォローとタイムベースの退出メカニズムを組み合わせます.コアコンセプトは,リスク管理のために年末強制清算メカニズムを組み込む一方で,60日移動平均値との価格関係を監視することによって市場のトレンドを把握することです.閉値が60日MAをポジティブな傾斜で破るとロングポジションが入力され,すべてのポジションは毎年最後の取引日に閉鎖されます.
戦略の原則
この戦略は,いくつかの基本的な要素に基づいています. 1. 傾向決定: 中期トレンド指標として60日間のシンプル・ムービング・アベア (SMA) を使用し,トレンドの方向性を確認するために14日間の傾斜計算を行います. 2. エントリー・シグナル:価格が60日間のMAを前向きの傾斜で突破し,潜在的上昇傾向を示すとき,購入シグナルが生成される. 3. アクジットメカニズム: 年間ポジションリスクを回避するために,各年の最後の取引日にすべてのポジションを閉じる固定時間ベースの退出を実施する. 4. 取引時間管理: 取引は有効な取引日にのみ行われることを保証するために,日付範囲制御と取引日の検証を組み込む.
戦略 の 利点
- 強いトレンドフォロー: 移動平均システムを通じて中長期トレンドを効果的に把握します.
- 堅牢なリスク管理: 年末の強制清算はポジションリスクを効果的に管理し,年越しの不確実性を排除します.
- 明確な操作規則: 入口と出口条件は明確に定義されており,実行とバックテストを容易にする.
- 高い適応性: 戦略パラメータは,異なる市場特性に合わせて調整できます.
戦略リスク
- MA 遅延:移動平均値は固有の遅延があり,エントリータイムが遅れる可能性があります.
- 変動市場での不良業績: 横向市場では頻繁に誤ったブレイクシグナルを生む可能性があります.
- 安定した退出リスク: 年末の強制清算は,前期的な良好な傾向から退出につながる可能性があります.
- パラメータ敏感性: 戦略のパフォーマンスは MA 期間および他のパラメータ設定に敏感である.
オプティマイゼーションの方向性
- 追加傾向確認: 傾向の検証を改善するために,RSIとMACDを組み込むことを検討する.
- 強化された退出メカニズム: 時間に基づく退出のみに頼るのではなく,ストップ・ロストとテイク・プロフィート条件を追加する.
- 動的パラメータ調整:市場変動に基づいて動的MA期間調整を実施する.
- ポジション管理:資本効率の向上のためにATRベースのポジションサイズ導入.
概要
この戦略は,トレンドフォローとタイムマネジメントを組み合わせて比較的堅牢な取引システムを創出する.そのシンプルで明確な論理は,理解し実行しやすくし,良い実用的な有用性を提供する.適切なパラメータ最適化と追加のリスク管理措置により,戦略は実際の取引条件で安定した収益を生む可能性を示しています.
/*backtest
start: 2025-01-09 00:00:00
end: 2025-01-16 00:00:00
period: 3m
basePeriod: 3m
exchanges: [{"eid":"Futures_Binance","currency":"BTC_USDT","balance":49999}]
*/

//@version=5
strategy("Buy above 60-day MA, Sell at year-end", overlay=true, pyramiding=1)

// Define inputs for start and end dates
startDate = input(defval=timestamp("2010-01-01"), title="Start Date")
endDate = input(defval=timestamp("2024-12-31"), title="End Date")

// Define 60-day moving average
length = input.int(defval=60, title="MA Length", minval=1)
ma = ta.sma(close, length)
slope = ta.sma(ma, 14) - ta.sma(ma, 14)[1]

// Check if current bar is within the specified date range
withinDateRange = true

// Function to check if a day is a trading day (Monday to Friday)
isTradingDay(day) => true

// Check if current bar is the last trading day of the year
// Check if current bar is the last trading day of the year
isLastTradingDayOfYear = false
yearNow = year(time)
if (month == 12 and dayofmonth == 31)
    isLastTradingDayOfYear := isTradingDay(time)
else if (month == 12 and dayofmonth == 30)
    isLastTradingDayOfYear := isTradingDay(time) and not isTradingDay(time + 86400000)
else if (month == 12 and dayofmonth == 29)
    isLastTradingDayOfYear := isTradingDay(time) and not isTradingDay(time + 86400000) and not isTradingDay(time + 86400000 * 2)

// Plot moving average
plot(ma, color=color.blue, linewidth=2)

// Buy when closing price crosses above 60-day MA and up trend
if (withinDateRange and ta.crossover(close, ma) and slope > 0)
    strategy.entry("Buy", strategy.long)

// Sell all positions at the last trading day of the year
if (isLastTradingDayOfYear)
    strategy.close_all(comment="Sell at year-end")

// Plot buy and sell signals
//plotshape(series=ta.crossover(close, ma), location=location.belowbar, color=color.green, style=shape.labelup, text="Buy")
//plotshape(series=isLastTradingDayOfYear, location=location.abovebar, color=color.red, style=shape.labeldown, text="Sell")
関連性
- トリプル・ボトム・リバウンド・モメンタム・ブレークスルー戦略
- 動的移動平均のクロスオーバートレンド ATRリスク管理システムによる戦略に従って
- 戦略をフォローするマルチインジケータ融合平均逆転傾向
- 強化された価格量動向の勢い戦略
- アダプティブ・ムービング・平均クロスオーバーとストップ・ロスのストラテジー
- 上方ウィック・ブイッシュ・キャンドル・ブレークアウト戦略なし
- 多指標シネージシストトレンド逆転量的な取引戦略
- 複数の確認を伴う戦略に従う多面滑らかな移動平均動的クロスオーバー傾向
- Bollinger Bands と ATR に基づく多レベルインテリジェント・ダイナミック・トレリングストップ戦略
- 多次元ゴールド金曜日の異常戦略分析システム
もっと
- 複数の確認を伴う戦略に従う多面滑らかな移動平均動的クロスオーバー傾向
- 大型キャンドルとRSIディバージェンスをベースとした高度なダイナミックストップ・ロスの戦略
- 流動性重量化された移動平均動力量クロスオーバー戦略
- 多指標シネージシストトレンド逆転量的な取引戦略
- 多チャネル動的サポート抵抗 ケルトナーチャネル戦略
- 機械学習 適応型スーパートレンド 定量的な取引戦略
- ダイナミック・ウェーブ・トレンドとフィボナッチ統合量的な取引戦略
- トレーディング戦略をフォローする波動性停止ベースのEMAトレンド
- ダイナミック・ボラティリティ・フィルターによるマルチ-EMAトレンドフォロー戦略
- 多指標量的な取引戦略をフォローする三重EMA傾向
- RSI 過剰購入/過剰売却量的な取引戦略の多指標トレンド
- 効率的な価格チャネル取引戦略 15分ブレイクベース
- 過去のバックテストを伴う多時間枠のフェア・バリュー・ギャップ・ブレイクアウト戦略
- QQEの動的傾向 リスク管理量的な取引戦略
- 移動平均値とバー外パターンに基づく二重トレンド確認取引戦略
- スーパートレンドの三重強化戦略に続くダイナミックな傾向
- RSI ダイナミック・ブレイクアウト・リトレースメント・トレーディング・ストラテジー
- オプティマイズされた二重T3トレンド追跡戦略
- 多条件ドンチアンチャネルモメンタムブレイク戦略
- 多期技術指標 ダイナミック取引システム戦略