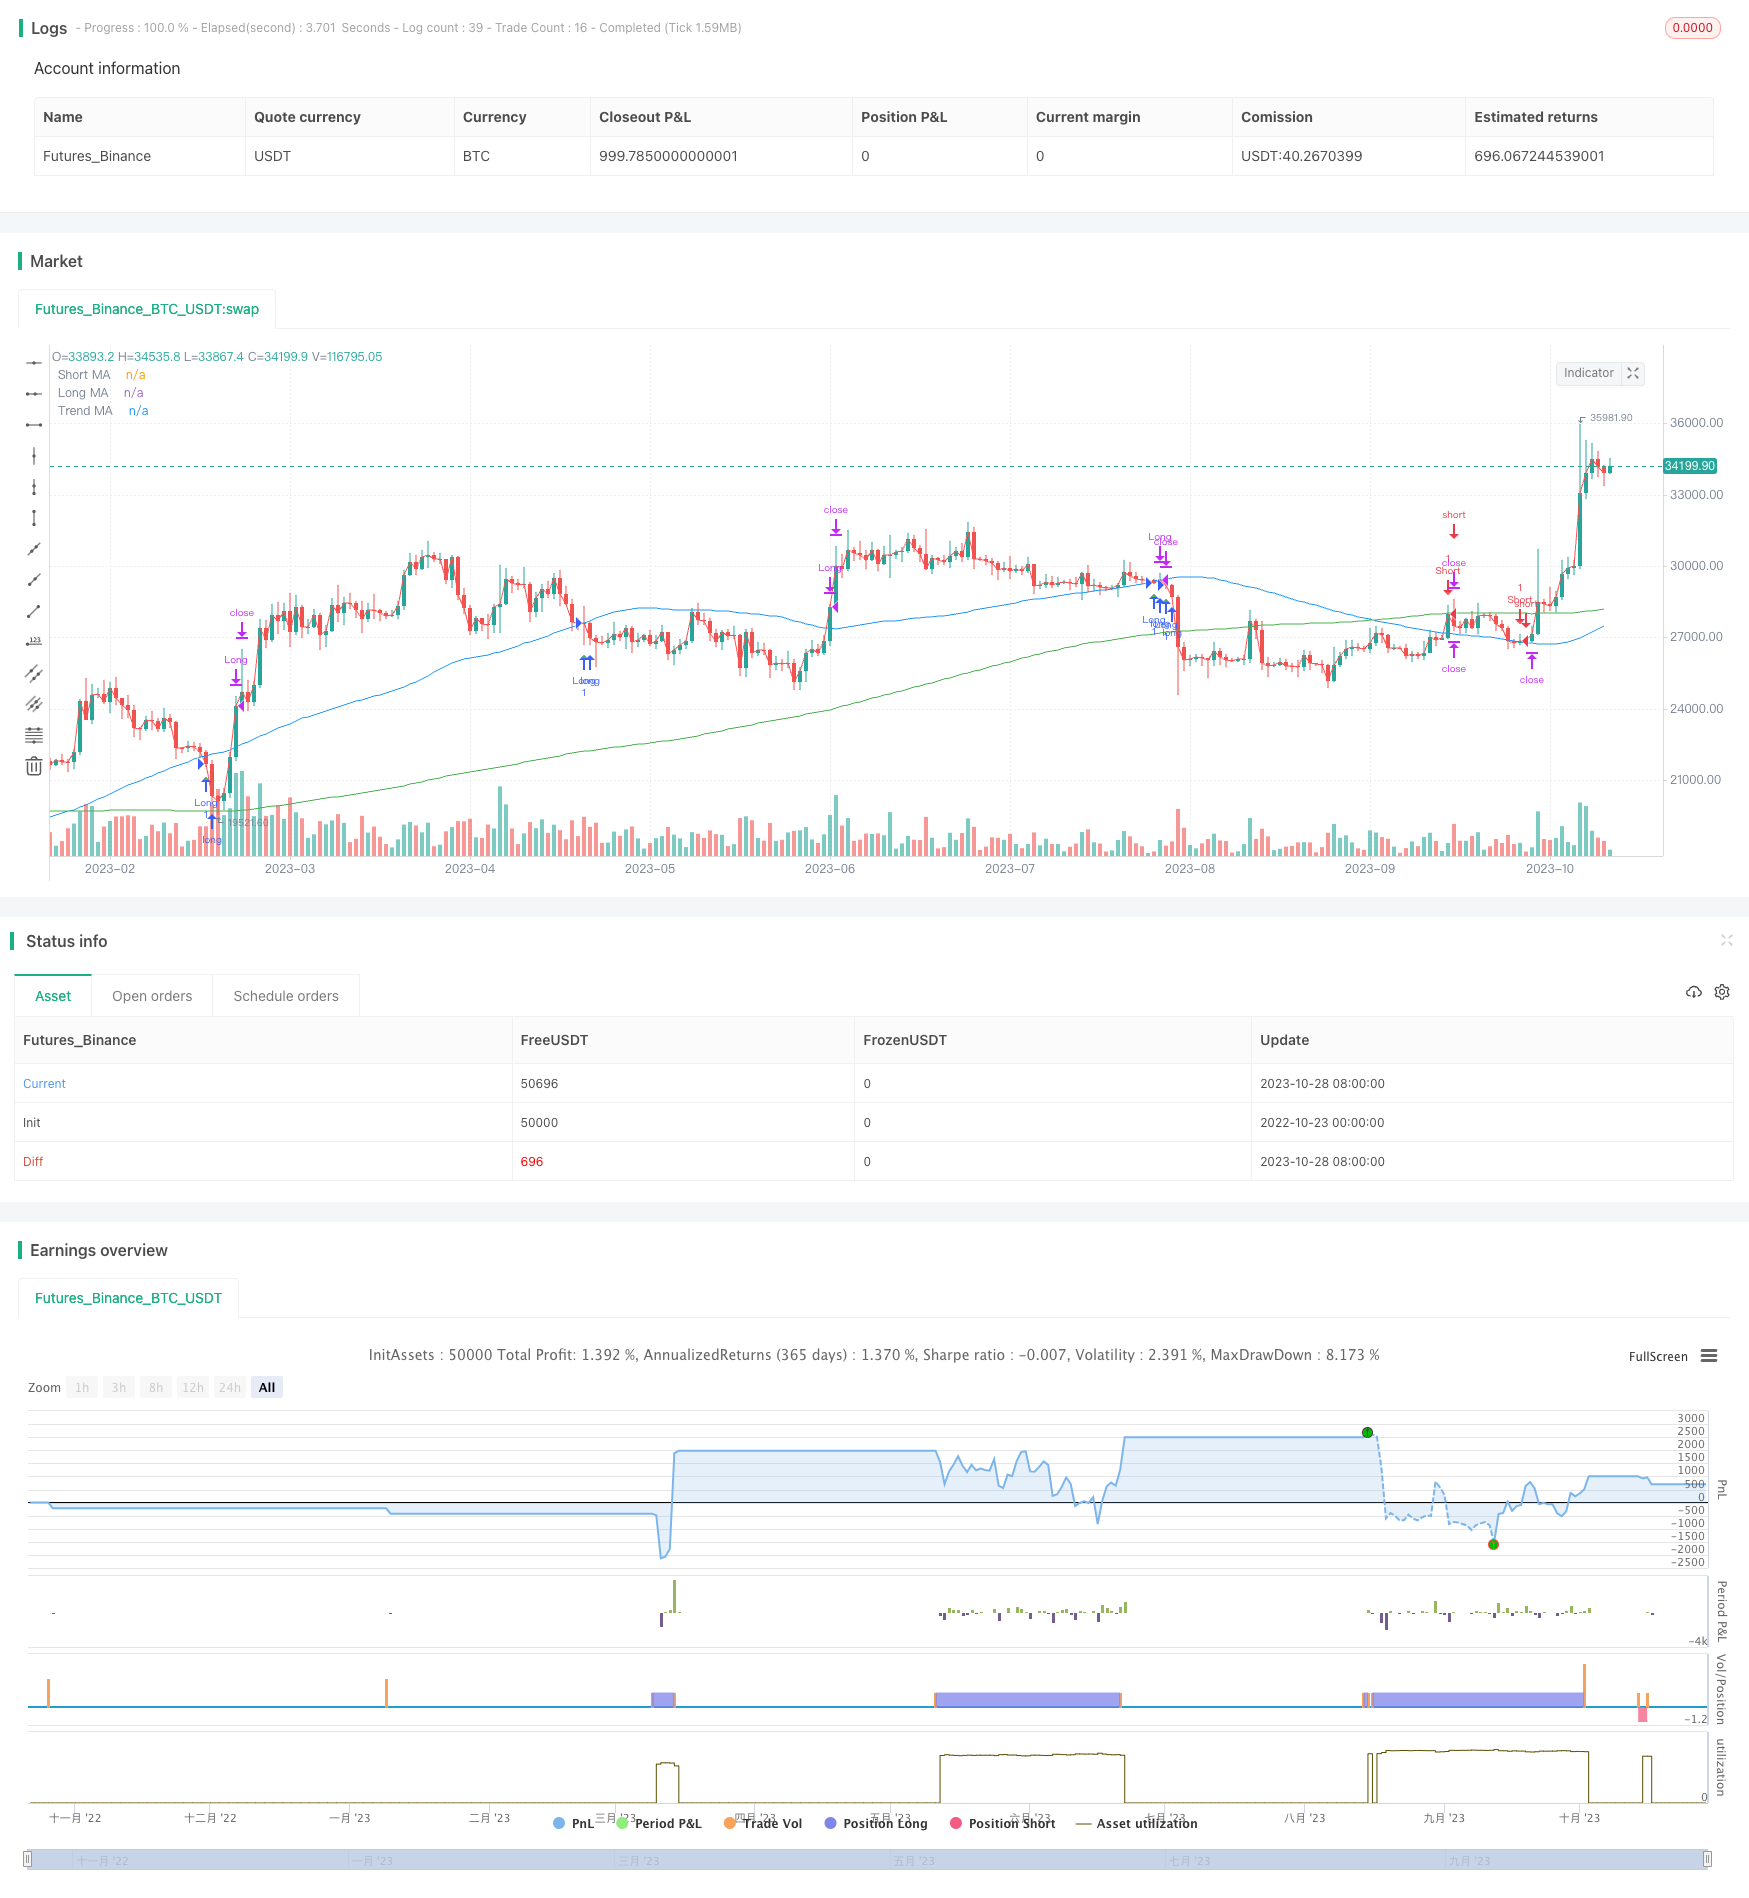
골든 크로스 데스 크로스 이동 평균 거래 전략
저자:차오장, 날짜: 2023-10-30 14:42:09태그:

개요: 이 전략은 서로 다른 기간의 3 개의 이동 평균을 기반으로 골든 크로스 및 데스 크로스 거래를 구현합니다. 짧은 기간 MA가 긴 기간 MA를 넘을 때 긴 기간 MA를 넘을 때 길고 짧은 기간 MA가 긴 기간 MA를 넘을 때 짧습니다. 트렌드 방향은 트렌드 MA 라인에 의해 결정됩니다.
전략 논리:
-
3개의 MA를 정의합니다. 짧은 기간 MA, 긴 기간 MA 및 트렌드 MA. 기간은 각각 20, 200 및 50입니다.
-
구매 신호는 짧은 기간 MA가 긴 기간 MA를 넘을 때 생성됩니다. 판매 신호는 짧은 기간 MA가 긴 기간 MA를 넘을 때 생성됩니다.
-
짧은 MAs와 긴 MAs가 트렌드 MA보다 높는지 확인합니다. 그렇지 않으면 트렌드에 반대하는 거래를 피하기 위해 신호가 필터됩니다.
-
스톱 로스를 설정하고 엔트리 가격의 비율로 이익을 취합니다. 백테스팅에 기반한 매개 변수를 최적화하십시오.
-
입구 신호를 시각화하기 위해 MA 교차점을 그래프로 그려라.
장점:
-
간단하고 직관적인 전략 논리, 이해하기 쉽고 실행하기 쉽습니다.
-
중장기 동향을 효과적으로 파악하고 동력을 따라 거래할 수 있습니다.
-
트렌드에 따라 필터링 MA는 트렌드에 반대하는 거래를 피합니다.
-
MA 기간은 다른 시장 조건에 따라 조정될 수 있습니다.
-
리스크를 통제하기 위해 사용자 정의 가능한 스톱 손실 및 수익을 취합니다.
위험성:
-
급격한 변동은 스톱 로드를 유발할 수 있습니다.
-
트렌드가 역전되면 더 큰 손실이 발생합니다.
-
부적절한 매개 변수 조정은 오버 트레이딩 또는 놓친 기회로 이어질 수 있습니다.
-
거래 비용도 고려해야 합니다.
개선 사항:
-
잘못된 신호를 피하기 위해 ATR 같은 변동성 필터를 추가합니다.
-
매개 변수를 동적으로 최적화하기 위해 기계 학습을 사용하세요.
-
트렌드를 결정하기 위해 MACD와 같은 더 많은 지표를 추가합니다.
-
수익을 확보하기 위해 후속 스톱 손실을 구현합니다.
-
최적의 스톱 로스 및 수익 수준을 찾기 위한 백테스트
결론:
이 전략은 명확한 논리 및 쉬운 실행으로 트렌드를 효과적으로 캡처합니다. 트렌드 필터, 스톱 로스 및 수익을 통해 위험을 제어합니다. 매개 변수 조정에는 시장 조건에 대한 최적화가 필요합니다. 더 많은 지표가 성능을 향상시킬 수 있습니다. 중장기 트렌드 거래에 적합합니다. 백테스트 및 데모 거래에서 잘 수행됩니다. 라이브 거래에서 윙사 및 트렌드 역전 위험에 주의하십시오. 전반적으로 실용적인 가치가 있습니다.
/*backtest
start: 2022-10-23 00:00:00
end: 2023-10-29 00:00:00
period: 1d
basePeriod: 1h
exchanges: [{"eid":"Futures_Binance","currency":"BTC_USDT"}]
*/

//@version=5
strategy("XAU M15", overlay=true)

// Define input parameters
long_length = input.int(64, title="Long MA Length")
short_length = input.int(1, title="Short MA Length")
trend_length = input.int(200, title="Trend MA Length")

// Calculate moving averages
long_ma = ta.sma(close, long_length)
short_ma = ta.sma(close, short_length)
trend_ma = ta.sma(close, trend_length)

// Plot moving averages on chart
plot(long_ma, color=color.blue, title="Long MA")
plot(short_ma, color=color.red, title="Short MA")
plot(trend_ma, color=color.green, title="Trend MA")

// Entry conditions
enterLong = ta.crossover(long_ma, short_ma) and long_ma > trend_ma and short_ma > trend_ma
enterShort = ta.crossunder(long_ma, short_ma) and long_ma < trend_ma and short_ma < trend_ma

if (enterLong)
    strategy.entry("Long", strategy.long)

if (enterShort)
    strategy.entry("Short", strategy.short)

// Exit conditions
exitLong = ta.crossunder(long_ma, short_ma)
exitShort = ta.crossover(long_ma, short_ma)

if (exitLong)
    strategy.close("Long")

if (exitShort)
    strategy.close("Short")

// Set stop loss and take profit levels
long_stop_loss_percentage = input(1, title="Long Stop Loss (%)") / 100
long_take_profit_percentage = input(3, title="Long Take Profit (%)") / 100

short_stop_loss_percentage = input(1, title="Short Stop Loss (%)") / 100
short_take_profit_percentage = input(3, title="Short Take Profit (%)") / 100

strategy.exit("Take Profit/Stop Loss", "Long", stop=close * (1 - long_stop_loss_percentage), limit=close * (1 + long_take_profit_percentage))
strategy.exit("Take Profit/Stop Loss", "Short", stop=close * (1 + short_stop_loss_percentage), limit=close * (1 - short_take_profit_percentage))

plotshape(series=enterLong, title="Buy Entry", location=location.belowbar, color=color.green, style=shape.triangleup, size=size.tiny)
plotshape(series=enterShort, title="Sell Entry", location=location.abovebar, color=color.red, style=shape.triangledown, size=size.tiny)
- 이동 평균에 기초한 트렌드 거래 전략
- RSI 긴 짧은 잔액 거래 전략
- 테슬라 슈퍼트렌드 전략
- 세 가지 내부 상향 역전 전략
- 이중 이동 평균 크로스오버 알고리즘 거래 전략
- 트렌드를 따르는 전략
- RSI 임계 거래 전략
- 강한 트렌드 브레이크 전략
- 지그자그 기반 트렌드 다음 전략
- 이치모쿠 균형 전략
- HULL SMA와 EMA 크로스오버에 기초한 트렌드 전략
- 이중 EMA 크로스오버 전략
- 유동평균 파업에 기초한 트렌드 추종 전략
- MACD 폐업 하이브리드 전략
- 멀티 타임프레임 수익 전략
- 저점 반발 전략
- 모멘텀 역전 콤보 전략
- 부피 차이 델타 사이클 오시레이터 거래 전략
- MA 트렌드 라인 돌파구 전략
- 전략에 따른 추진 동향