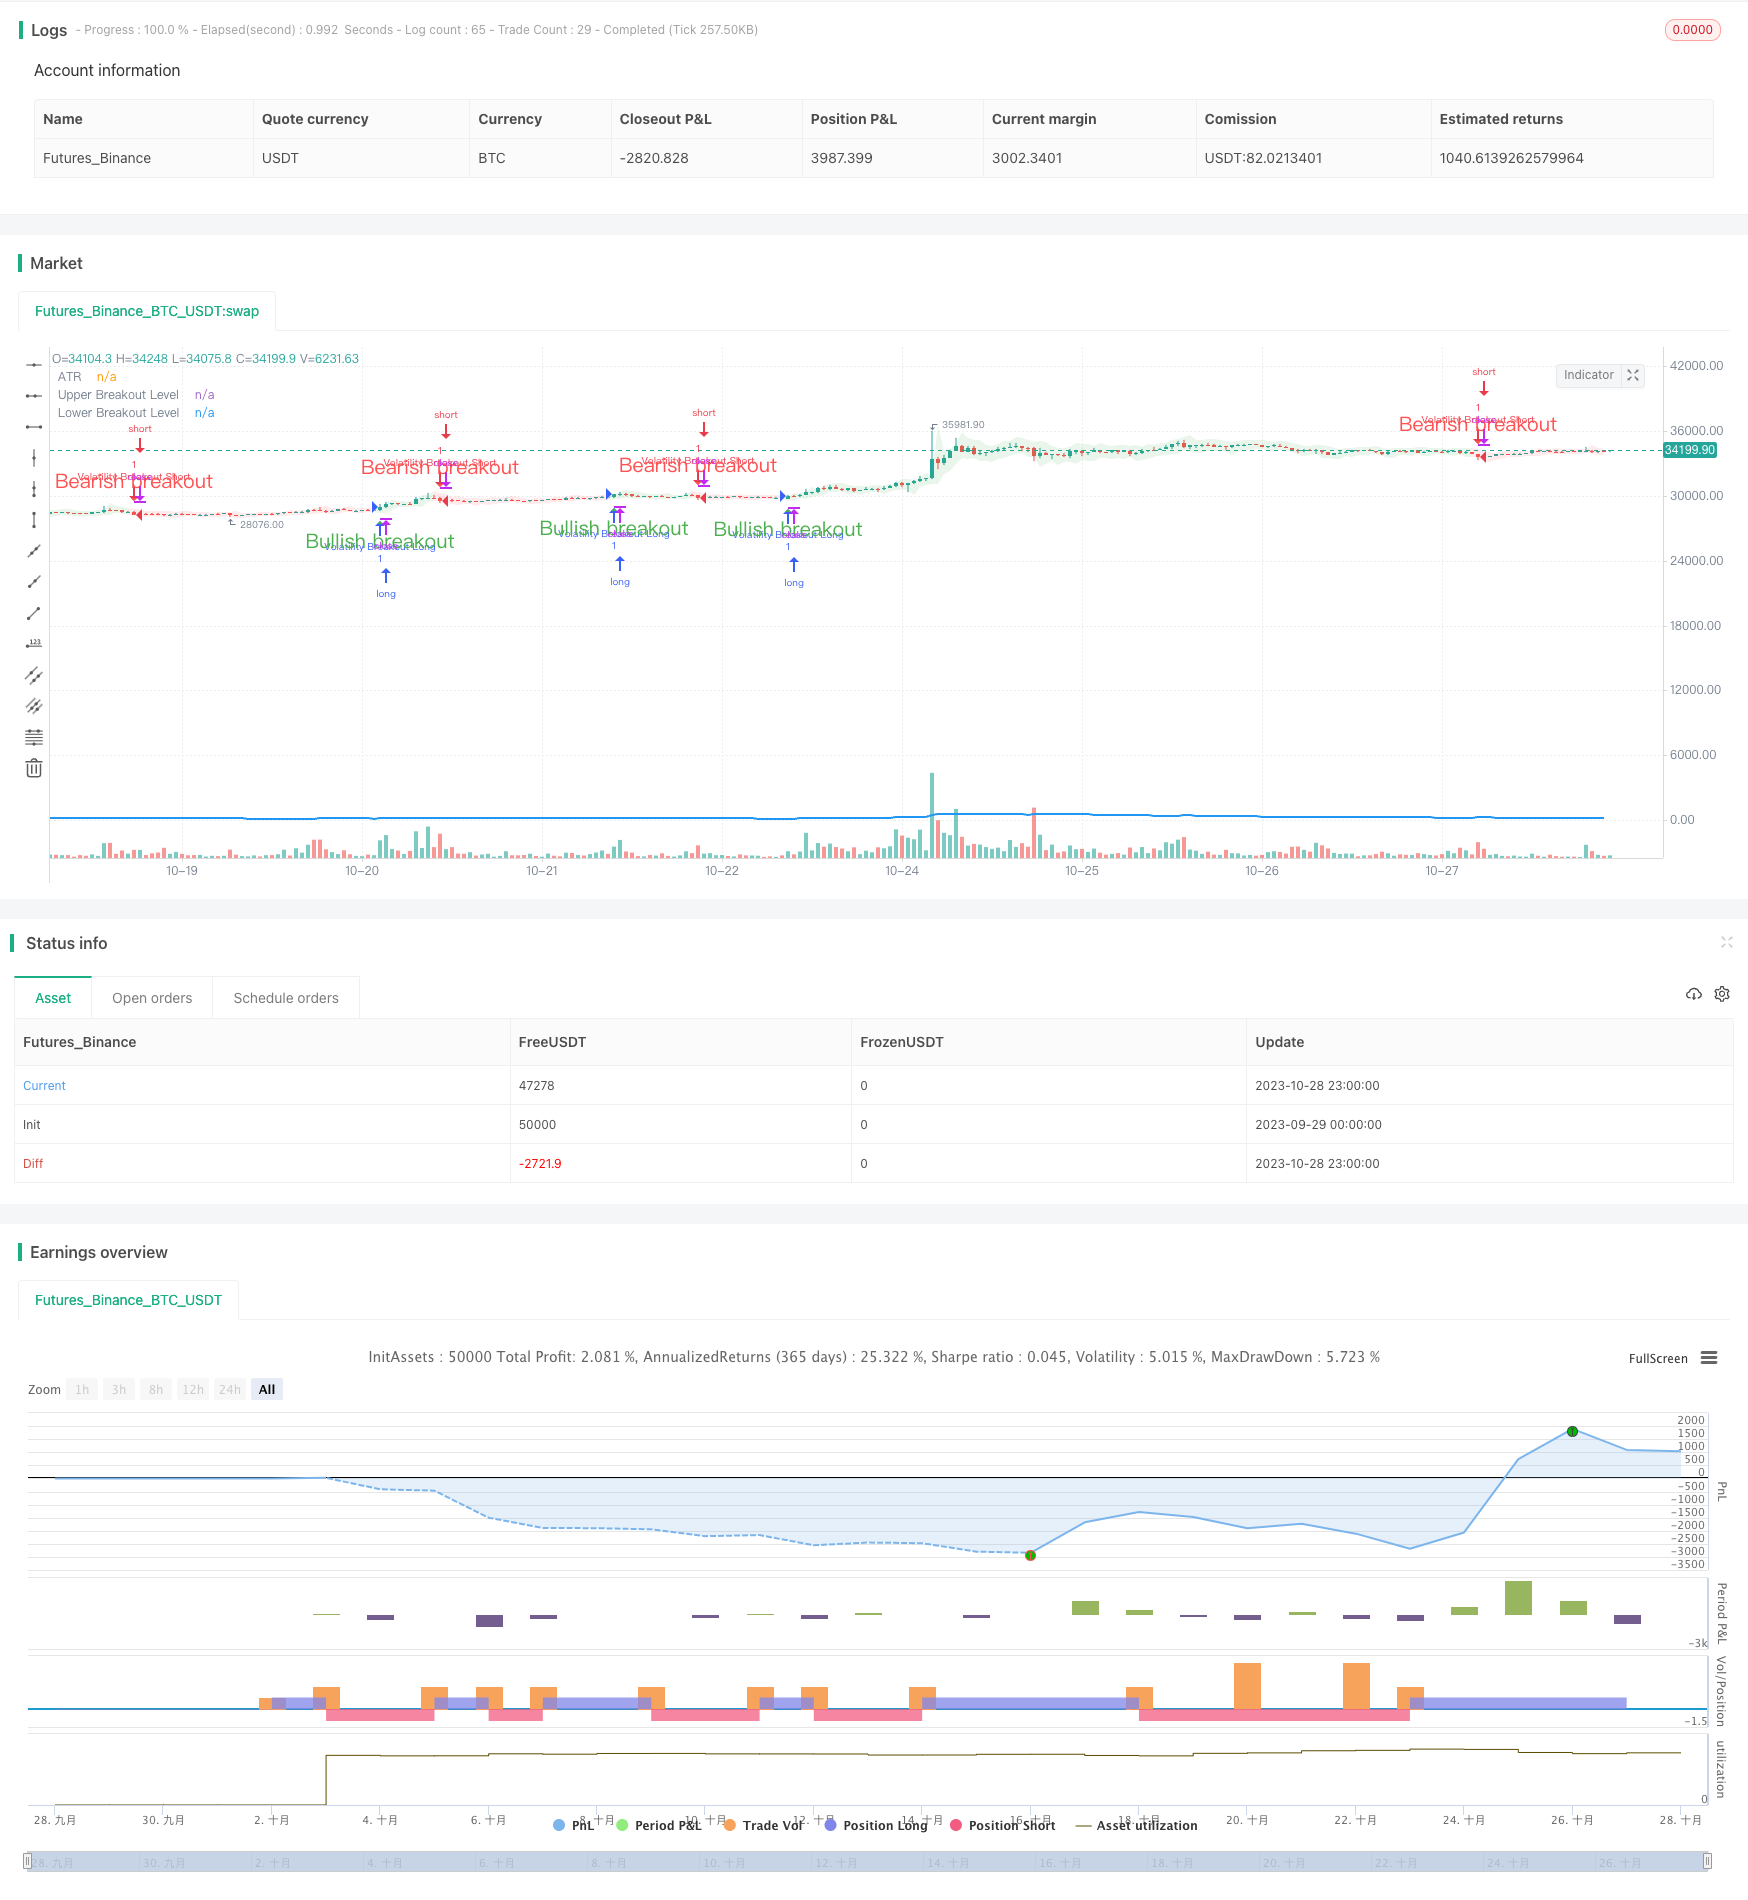
변동성 브레이크업 거래 전략
저자:차오장, 날짜: 2023-10-30 16:58:03태그:

전반적인 설명
변동성 유출 거래 전략은 시장 변동성 증가로 인한 가격 유출을 포착하는 것을 목표로합니다. 전략은 특정 기간 동안 자산의 변동성을 측정하기 위해 평균 진정한 범위 (ATR) 지표를 사용합니다. 가격이 ATR에 의해 결정된 두 레벨 이상 또는 아래로 돌파 할 때 길고 짧은 신호가 생성됩니다.
전략 논리
이 전략은 먼저 선택된 기간 동안 ATR을 계산합니다. 그 다음 ATR을 사용하여 상위 및 하위 브레이크 아웃 레벨을 계산합니다. 폐쇄 가격이 상위 레벨을 넘을 때 긴 신호가 생성됩니다. 폐쇄 가격이 하위 레벨을 넘을 때 짧은 신호가 생성됩니다. 신호를 추가로 확인하려면 현재 바가 몸 부분으로 닫아야합니다.
닫기 가격이 상위 또는 하위 수준을 넘으면, 브레이크오웃 영역은 브레이크오웃 방향을 나타내는 색으로 채워집니다. 이 기능은 지배적인 트렌드 방향을 빠르게 식별하는 데 도움이됩니다.
긴 신호가 생성되고 현재 위치가 없을 때 전략은 길게 됩니다. 짧은 신호가 생성되고 현재 위치가 없을 때 전략은 짧게 됩니다.
길이 입력값은 변동성이 측정되는 기간을 결정합니다. 더 높은 길이 값은 더 긴 가격 움직임에 초점을 맞추는 것을 의미합니다. 예를 들어, 길이 20로 설정되면 각 거래는 약 100 바에 걸쳐 여러 변동을 포착합니다.
길이 값을 낮추면 단기 가격 움직임을 타겟팅하고 거래 빈도를 증가시킬 수 있습니다. 길이 입력과 평균 거래 길이 사이에 엄격한 상관관계가 없습니다. 최적의 길이 값은 실험을 통해 찾아야 합니다.
이점 분석
이 전략은 시장 변동성으로 인해 발생하는 중요한 움직임을 파악하기 위해 브레이크아웃 원칙을 활용합니다. ATR 지표는 고정 매개 변수를 사용하는 대신 브레이크아웃 수준을 동적으로 계산합니다.
확증 신호를 막기 위해 단단한 막대기를 사용하면 잘못된 브레이크오웃을 필터링할 수 있습니다. 브레이크오웃 영역을 채우면 직관적으로 트렌드 방향을 보여줍니다.
길이 입력은 특정 시장 조건에 대한 전략을 최적화하는 유연성을 제공합니다.
위험 분석
브레이크업 거래는 중단 될 위험이 있습니다. 중지 손실은 개별 거래에서 손실을 제어 할 수 있습니다.
브레이크아웃 신호는 오버 트레이딩으로 이어지는 잘못된 신호를 생성할 수 있습니다. 잘못된 신호를 필터링하기 위해 길이 값을 조정할 수 있습니다.
매개 변수 최적화에는 충분한 거래 데이터가 필요합니다. 초기 매개 변수가 좋지 않으면 성능이 떨어질 수 있습니다.
최적화 기회
볼링거 밴드는 ATR 기간 내에 새로운 브레이크오웃 수준을 계산하기 위해 도입 될 수 있습니다. 볼링거 브레이크오웃은 잘못된 신호를 줄입니다.
트렌드는 즉시 멈추는 대신 브레이크 이후 더 추적 할 수 있습니다. 후속 스톱을 포함 할 수 있습니다.
다른 매개 변수 또는 거래를 완전히 피하는 것은 범위를 제한하는 시장에서 윙사 (whispsaws) 를 방지하기 위해 고려 될 수 있습니다.
결론
변동성 브레이크아웃 트레이딩 전략은 가격이 크게 돌파될 때 트렌드 움직임을 입력하기 위해 증가한 시장 변동성을 활용합니다. ATR 지표는 동적으로 브레이크아웃 수준을 설정하고 솔리드 바는 거짓 브레이크아웃을 필터합니다. 길이 입력은 전략의 기간을 조정하는 유연성을 제공합니다. 전략은 중장기 트렌드 추종에 적합하지만 패러미터 최적화를 통해 브레이크아웃 위험을 관리해야합니다.
/*backtest
start: 2023-09-29 00:00:00
end: 2023-10-29 00:00:00
period: 1h
basePeriod: 15m
exchanges: [{"eid":"Futures_Binance","currency":"BTC_USDT"}]
*/

// This source code is subject to the terms of the Mozilla Public License 2.0 at https://mozilla.org/MPL/2.0/

//@version=5
strategy("Volatility Breakout Strategy [Angel Algo]", overlay = true)

// Inputs
length = input(title="Length", defval=20)

// Calculate the average true range (ATR)
atr = ta.atr(length)

// Plot the ATR on the chart
plot(atr, color=color.blue, linewidth=2, title="ATR")

// Calculate the upper and lower breakouts
upper_breakout = high + atr
lower_breakout = low - atr

// Plot the upper and lower breakouts on the chart
ul = plot(upper_breakout[1], color = color.new(color.green, 100), linewidth=2, title="Upper Breakout Level")
ll = plot(lower_breakout[1], color = color.new(color.red, 100), linewidth=2, title="Lower Breakout Level")

// Create the signals
long_entry = ta.crossover(close, upper_breakout[1]) and barstate.isconfirmed
short_entry = ta.crossunder(close, lower_breakout[1]) and barstate.isconfirmed

active_signal_color =ta.barssince(long_entry) < ta.barssince(short_entry) ?
   color.new(color.green,85) : color.new(color.red,85)

// Plot the signals on the chart
plotshape(long_entry and ta.barssince(long_entry[1]) > ta.barssince(short_entry[1]), location=location.belowbar, style=shape.triangleup,
   color=color.green, size=size.normal, text = "Bullish breakout", textcolor = color.green)
plotshape(short_entry and ta.barssince(long_entry[1]) < ta.barssince(short_entry[1]), location=location.abovebar, style=shape.triangledown,
   color=color.red, size=size.normal,text = "Bearish breakout",  textcolor = color.red)

// Fill the space between the upper and lower levels with the color that indicates the latest signal direction
fill(ul,ll, color=active_signal_color)

long_condition = long_entry and strategy.position_size <= 0 and barstate.isconfirmed
short_condition = short_entry and strategy.position_size >= 0 and barstate.isconfirmed

if long_condition
    strategy.entry("Volatility Breakout Long", strategy.long)


if short_condition
    strategy.entry("Volatility Breakout Short", strategy.short)
- EMA 및 MAMA 지표에 기반한 거래 전략
- 에일러스 선도 지표 거래 전략
- 유동평균에 기반한 트렌드를 따르는 전략
- 레레덱 DEC 전략
- 자동 구매 스칼퍼 전략과 함께 스토카스틱 RSI
- 확장성 있는 브레이크아웃 거래 전략
- 볼링거 밴드 및 스톡RSI 모멘텀 전략
- RSI 긴 짧은 자동 거래 전략
- 트렌드 없는 MACD 전략
- 부피 밸런스에 기반한 VB 전략
- 삼중 이동 평균 크로스오버 전략
- MACD LONG의 지원 및 저항 전략
- 이동 평균에 기초한 트렌드 거래 전략
- RSI 긴 짧은 잔액 거래 전략
- 테슬라 슈퍼트렌드 전략
- 세 가지 내부 상향 역전 전략
- 이중 이동 평균 크로스오버 알고리즘 거래 전략
- 트렌드를 따르는 전략
- RSI 임계 거래 전략
- 강한 트렌드 브레이크 전략