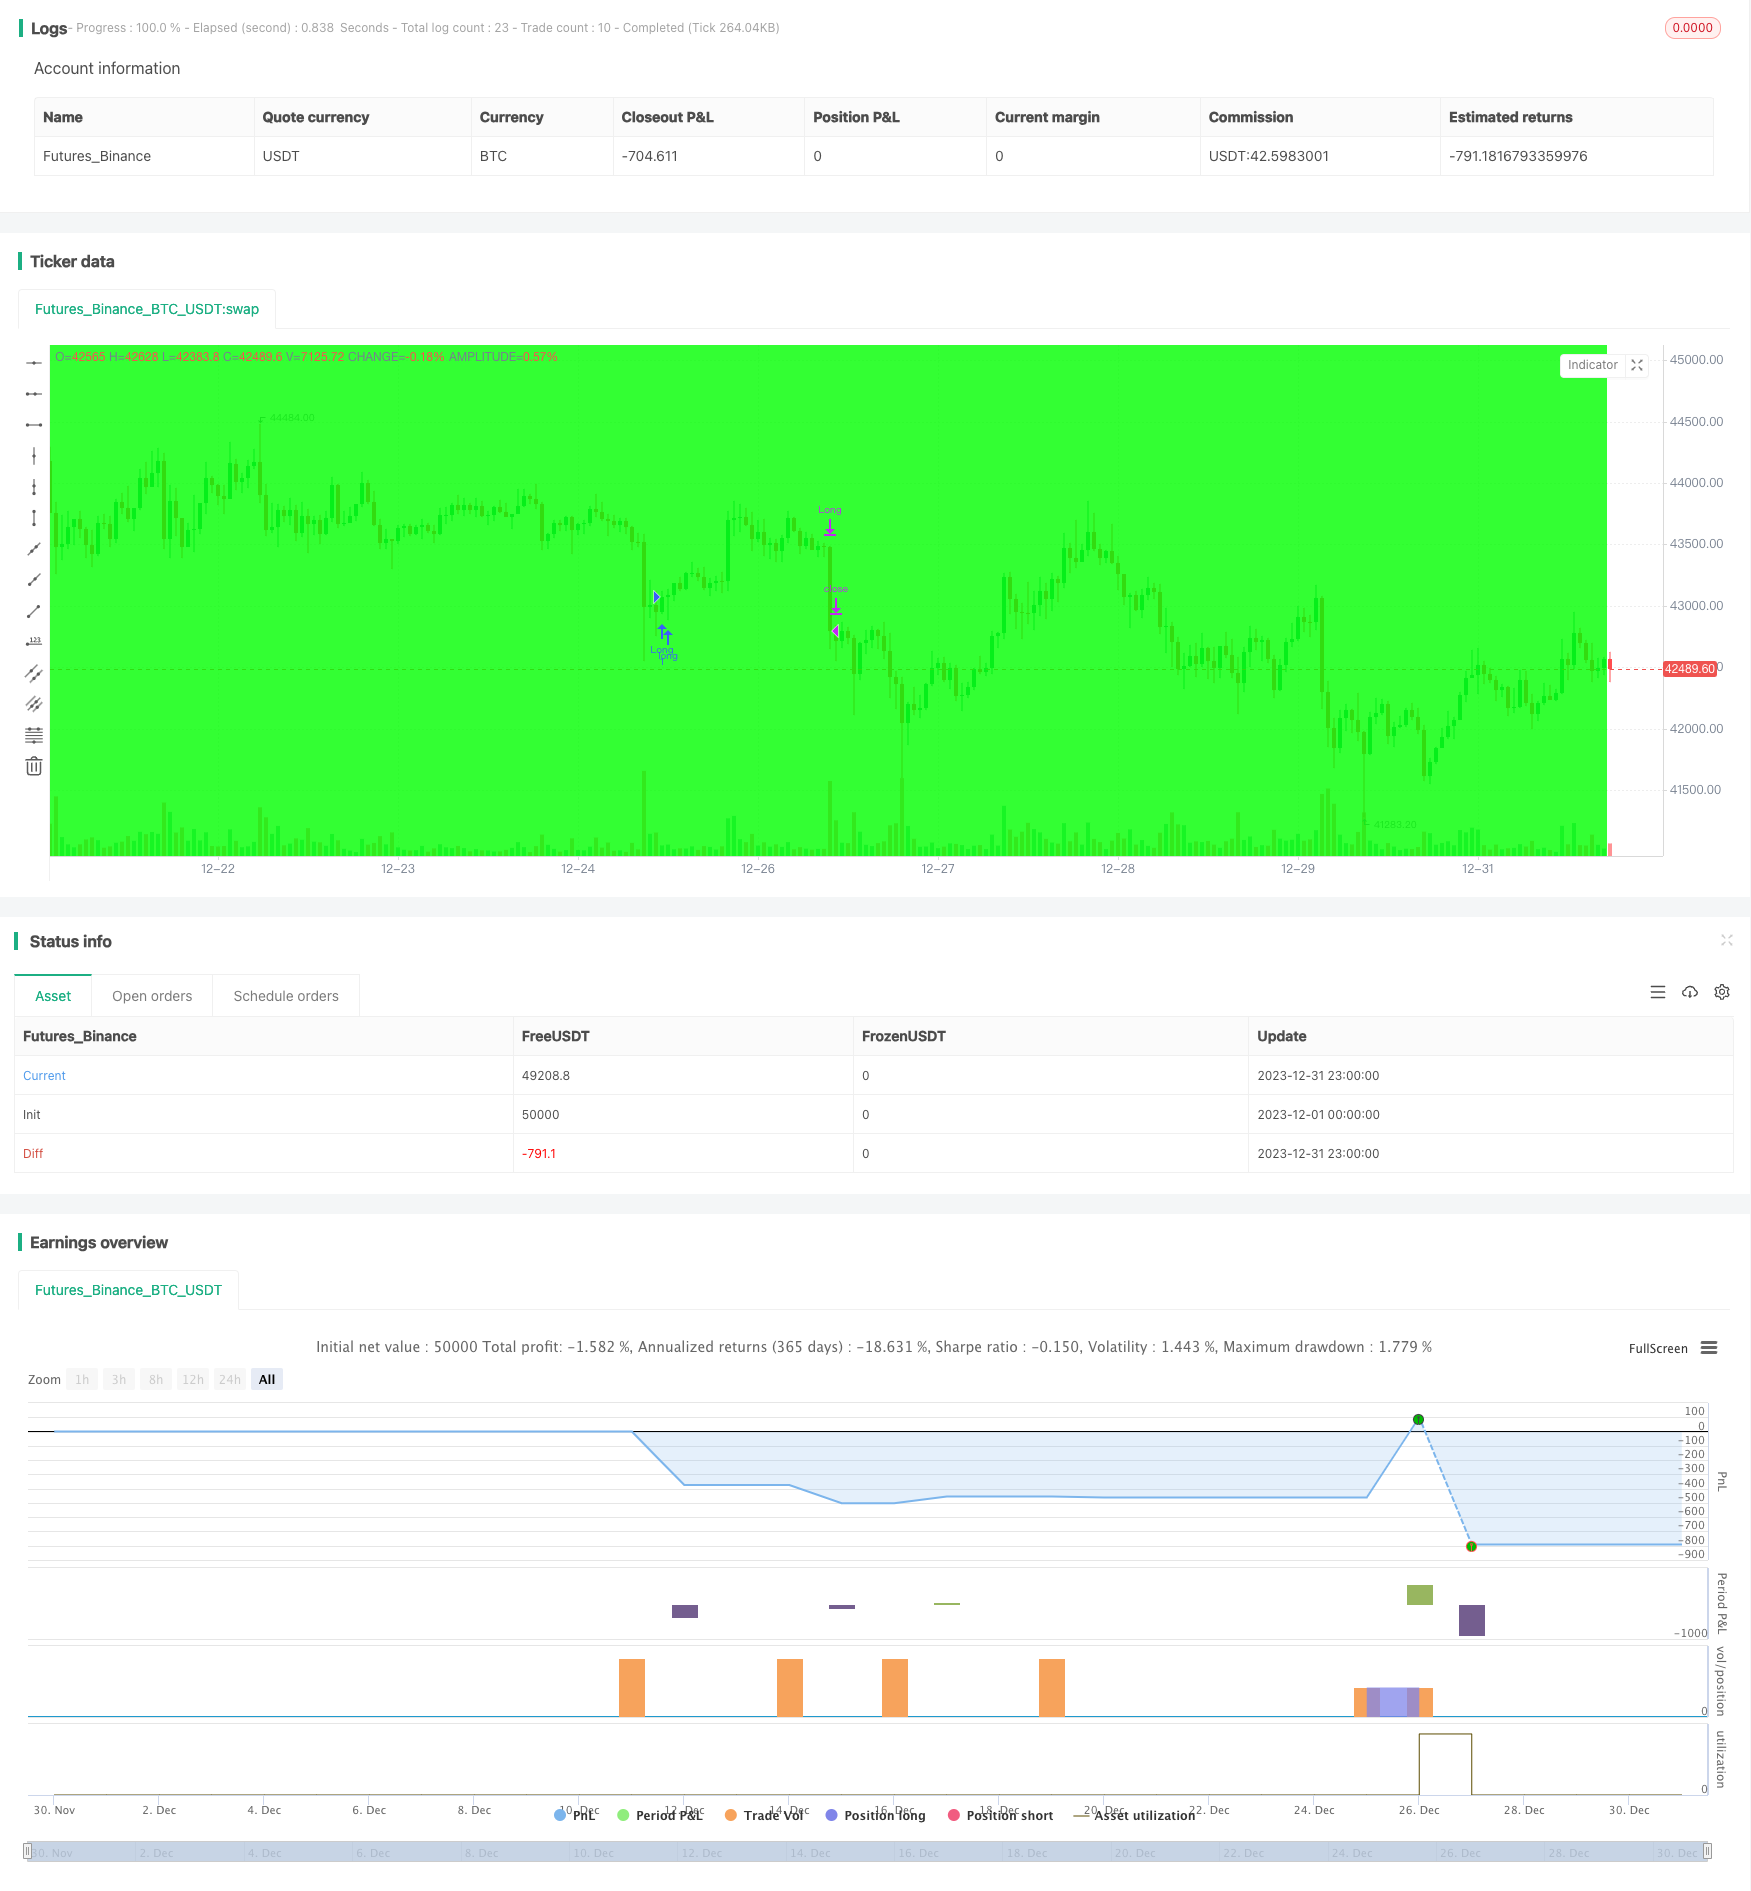
개요
이 전략은 RSI 지표를 사용하여 주식 과매매 시장 상태를 식별하고, 과매구역에서 사다리 하락을 형성하고, 과매구역에서 골드 포크를 형성하고, 지표 기반의 반전 거래 전략에 속한다. 이 전략은 트렌드 추적 중지, 고정 중지 중지 손실과 결합하여 거래 위험을 효과적으로 제어 할 수 있습니다.
전략 원칙
이 전략의 거래 신호는 RSI 지표에 기반한 황금 포크 사각지대에 의해 생성된다. RSI 지표는 일반적으로 30을 초과 판매 라인, 70을 초과 구매 라인으로 사용합니다. RSI 지표 상의 초과 판매 라인을 통과하면 구매 신호가 발생하고, RSI 지표 아래의 초과 구매 라인을 통과하면 판매 신호가 발생합니다.
진입 후, 전략은 백분율 추적 중지 방법을 채택하고, 지속적으로 최고 가격 또는 최저 가격을 업데이트하고, 특정 백분율을 중단 지점으로 떠납니다. 또한 고정 된 중지 중지 거리를 채택하고, 목표 이익 또는 최대 손실을 달성했을 때 중지합니다. 이러한 조합은 거래 위험을 잘 제어 할 수 있습니다.
우위 분석
이 전략은 다음과 같은 장점을 가지고 있습니다.
RSI 지표를 사용하여 오버 바이 오버 셀 영역을 판단하는 것은 비교적 성숙한 거래 기법이며 시장의 전환점을 더 정확하게 포착 할 수 있습니다.
골드 포크 데드 포크 방식은 거래 신호의 일부 잡음을 필터링하여 거래를 더 안정적으로 만듭니다.
트렌드 트래킹 스톱로 결합하여 수익을 최대한 고정시킬 수 있으며, 단편 손실을 줄이기 위해 신속하게 스톱을 할 수 있습니다.
고정 스톱 스톱 손실 거리는 단일 거래 위험을 효과적으로 제어 할 수 있습니다.
전체적으로, 이 전략 규칙은 명확하고 이해하기 쉽고 실행이 가능하며, 양자 거래 초보자를 위한 학습에 적합합니다.
위험 분석
이 전략에는 다음과 같은 위험도 있습니다.
RSI 지표는 잘못된 신호를 유발할 수 있으며, 기술적인 형태가 깨질 가능성이 높으며, 스톱 손실이 유발될 수 있다.
고정 스톱 스톱 손실 거리는 시장의 변동 정도에 따라 조정할 수 없으며, 조기 스톱 또는 확장 스톱 손실이 발생할 수 있습니다.
지분 추적 스톱은 가격의 최고점이나 최저점만을 추적할 수 있으며, 너무 급진적이어서 수익성이 떨어질 수 있다.
데이터 적합성 위험을 추적한다. 이 전략의 매개 변수는 역사 데이터에 대해 최적화되어 실제 응용에서 열등한 성능을 발휘할 수 있다.
거래 빈도가 너무 높을 수 있으며, 거래 수수료와 슬라이드 포인트 위험을 증가시킬 수 있습니다.
최적화 방향
이 전략은 다음과 같은 방향으로 최적화될 수 있습니다.
RSI 파라미터를 최적화하여 최적의 지표 파라미터 조합을 찾고 신호 품질을 향상시킵니다.
다른 지표의 필터를 추가하여, 다중 지표 공진을 형성하고, 신호의 정확도를 높인다.
시장의 변동에 따라 자동으로 스톱스트로프를 조정하는 적응 스톱스트로프 메커니즘을 사용합니다.
거래 빈도 제어 모듈을 추가하고 거래 횟수를 줄이고 거래 비용을 줄입니다.
자금 관리 모듈을 추가하여 단일 거래 규모를 제어하고 단일 손실을 줄입니다.
더 긴 시간 주기로 재검토하여 변수 안정성을 검사한다.
요약하다
이 전략은 전체적으로 전형적인 역전 거래 전략으로, RSI 지표를 이용하여 과매도 과매도 영역을 판단하고, 골드 포크 (金叉死叉) 방식을 취하여 거래 신호를 생성한다. 그리고 트렌드 추적 스톱 손실과 고정 스톱 손실을 사용하여 위험을 제어한다. 이 전략은 논리적으로 명확하고, 구현하기 쉬운, 양적 거래 초보자 학습 및 연습에 적합하다. 그러나 또한 특정 가짜 신호 위험과 변수 최적화 위험도 존재하며, 실제 사용되기 전에 전략에 대한 검증과 최적화가 계속되어야 한다.
/*backtest
start: 2023-12-01 00:00:00
end: 2023-12-31 23:59:59
period: 1h
basePeriod: 15m
exchanges: [{"eid":"Futures_Binance","currency":"BTC_USDT"}]
*/

// LOVE JOY PEACE PATIENCE KINDNESS GOODNESS FAITHFULNESS GENTLENESS SELF-CONTROL
// This source code is subject to the terms of the Mozilla Public License 2.0 at https://mozilla.org/MPL/2.0/
// Author: © JoshuaMcGowan
// Taken from https://www.tradingview.com/script/GbZGYi6l-Adding-some-essential-components-to-a-prebuilt-RSI-strategy/
// Just updated to compile in version 4.

//@version=4

strategy("Adding some essential components to a prebuilt RSI strategy", overlay=true)

/////////////// Component Code Start ///////////////

testStartYear = input(2011, "Backtest Start Year")
testStartMonth = input(8, "Backtest Start Month")
testStartDay = input(1, "Backtest Start Day")
testPeriodStart = timestamp(testStartYear,testStartMonth,testStartDay,0,0)

testStopYear = input(2100, "Backtest Stop Year")
testStopMonth = input(9, "Backtest Stop Month")
testStopDay = input(29, "Backtest Stop Day")
// testStopDay = testStartDay + 1
testPeriodStop = timestamp(testStopYear,testStopMonth,testStopDay,0,0)

// A switch to control background coloring of the test period
testPeriodBackground = input(title="Color Background?", type=input.bool, defval=true)
testPeriodBackgroundColor = testPeriodBackground and (time >= testPeriodStart) and (time <= testPeriodStop) ? #00FF00 : na
bgcolor(testPeriodBackgroundColor, transp=97)

testPeriod() => true

/////////////// Component Code Stop ///////////////

// Replace RSI Component, Long/Short, and Long Signal/Short Signal conditions with your trade setup components.
///////////// RSI component /////////////

length = input( 14 )
overSold = input( 30 )
overBought = input( 70 )
price = close

vrsi = rsi(price, length)
notna = not na(vrsi)

/////////////// STRATEGY ///////////////

ts = input(99999, "Trailing Stop") / 100
tp = input(99999, "Take Profit") / 100
sl = input(99999, "Stop Loss") / 100

// Update this with your setup.
long = notna and crossover(vrsi, overSold)
short = notna and crossunder(vrsi, overBought)

last_long = 0
last_short = 0
last_long := long ? time : nz(last_long[1])
last_short := short ? time : nz(last_short[1])

// Update this to reflect your setup.
long_signal = crossover(last_long, last_short)
short_signal = crossover(last_short, last_long)

float last_open_long_signal = 0
float last_open_short_signal = 0
last_open_long_signal := long_signal ? open : nz(last_open_long_signal[1])
last_open_short_signal := short_signal ? open : nz(last_open_short_signal[1])

last_long_signal = 0
last_short_signal = 0
last_long_signal := long_signal ? time : nz(last_long_signal[1])
last_short_signal := short_signal ? time : nz(last_short_signal[1])

in_long_signal = last_long_signal > last_short_signal
in_short_signal = last_short_signal > last_long_signal

float last_high = 0
float last_low = 0
last_high := not in_long_signal ? na : in_long_signal and (na(last_high[1]) or high > nz(last_high[1])) ? high : nz(last_high[1])
last_low := not in_short_signal ? na : in_short_signal and (na(last_low[1]) or low < nz(last_low[1])) ? low : nz(last_low[1])

long_ts = not na(last_high) and high <= (last_high - ts) //and high >= last_open_long_signal
short_ts = not na(last_low) and low >= (last_low + ts) //and low <= last_open_short_signal

long_tp = high >= (last_open_long_signal + tp)
short_tp = low <= (last_open_short_signal - tp)

long_sl = low <= (last_open_long_signal - sl)
short_sl = high >= (last_open_short_signal + sl)

leverage = input(200, "Leverage")
long_call = last_open_long_signal - (0.8 + 0.2 * (1/leverage)) / leverage * last_open_long_signal
short_call = last_open_short_signal + (0.78 + 0.2 * (1/leverage)) / leverage * last_open_short_signal
long_call_signal = low <= long_call
short_call_signal = high >= short_call

if testPeriod()
    strategy.entry("Long", strategy.long, when=long_signal)
    strategy.entry("Short", strategy.short, when=short_signal)

    // plot(long_call, color=color.red)
    // plot(short_call, color=color.green)
    strategy.close("Long", when=long_call_signal)
    strategy.close("Short", when=short_call_signal)
    strategy.close("Long", when=long_tp)
    strategy.close("Short", when=short_tp)
    strategy.close("Long", when=long_sl)
    strategy.close("Short", when=short_sl)
    strategy.close("Long", when=long_ts)
    strategy.close("Short", when=short_ts)