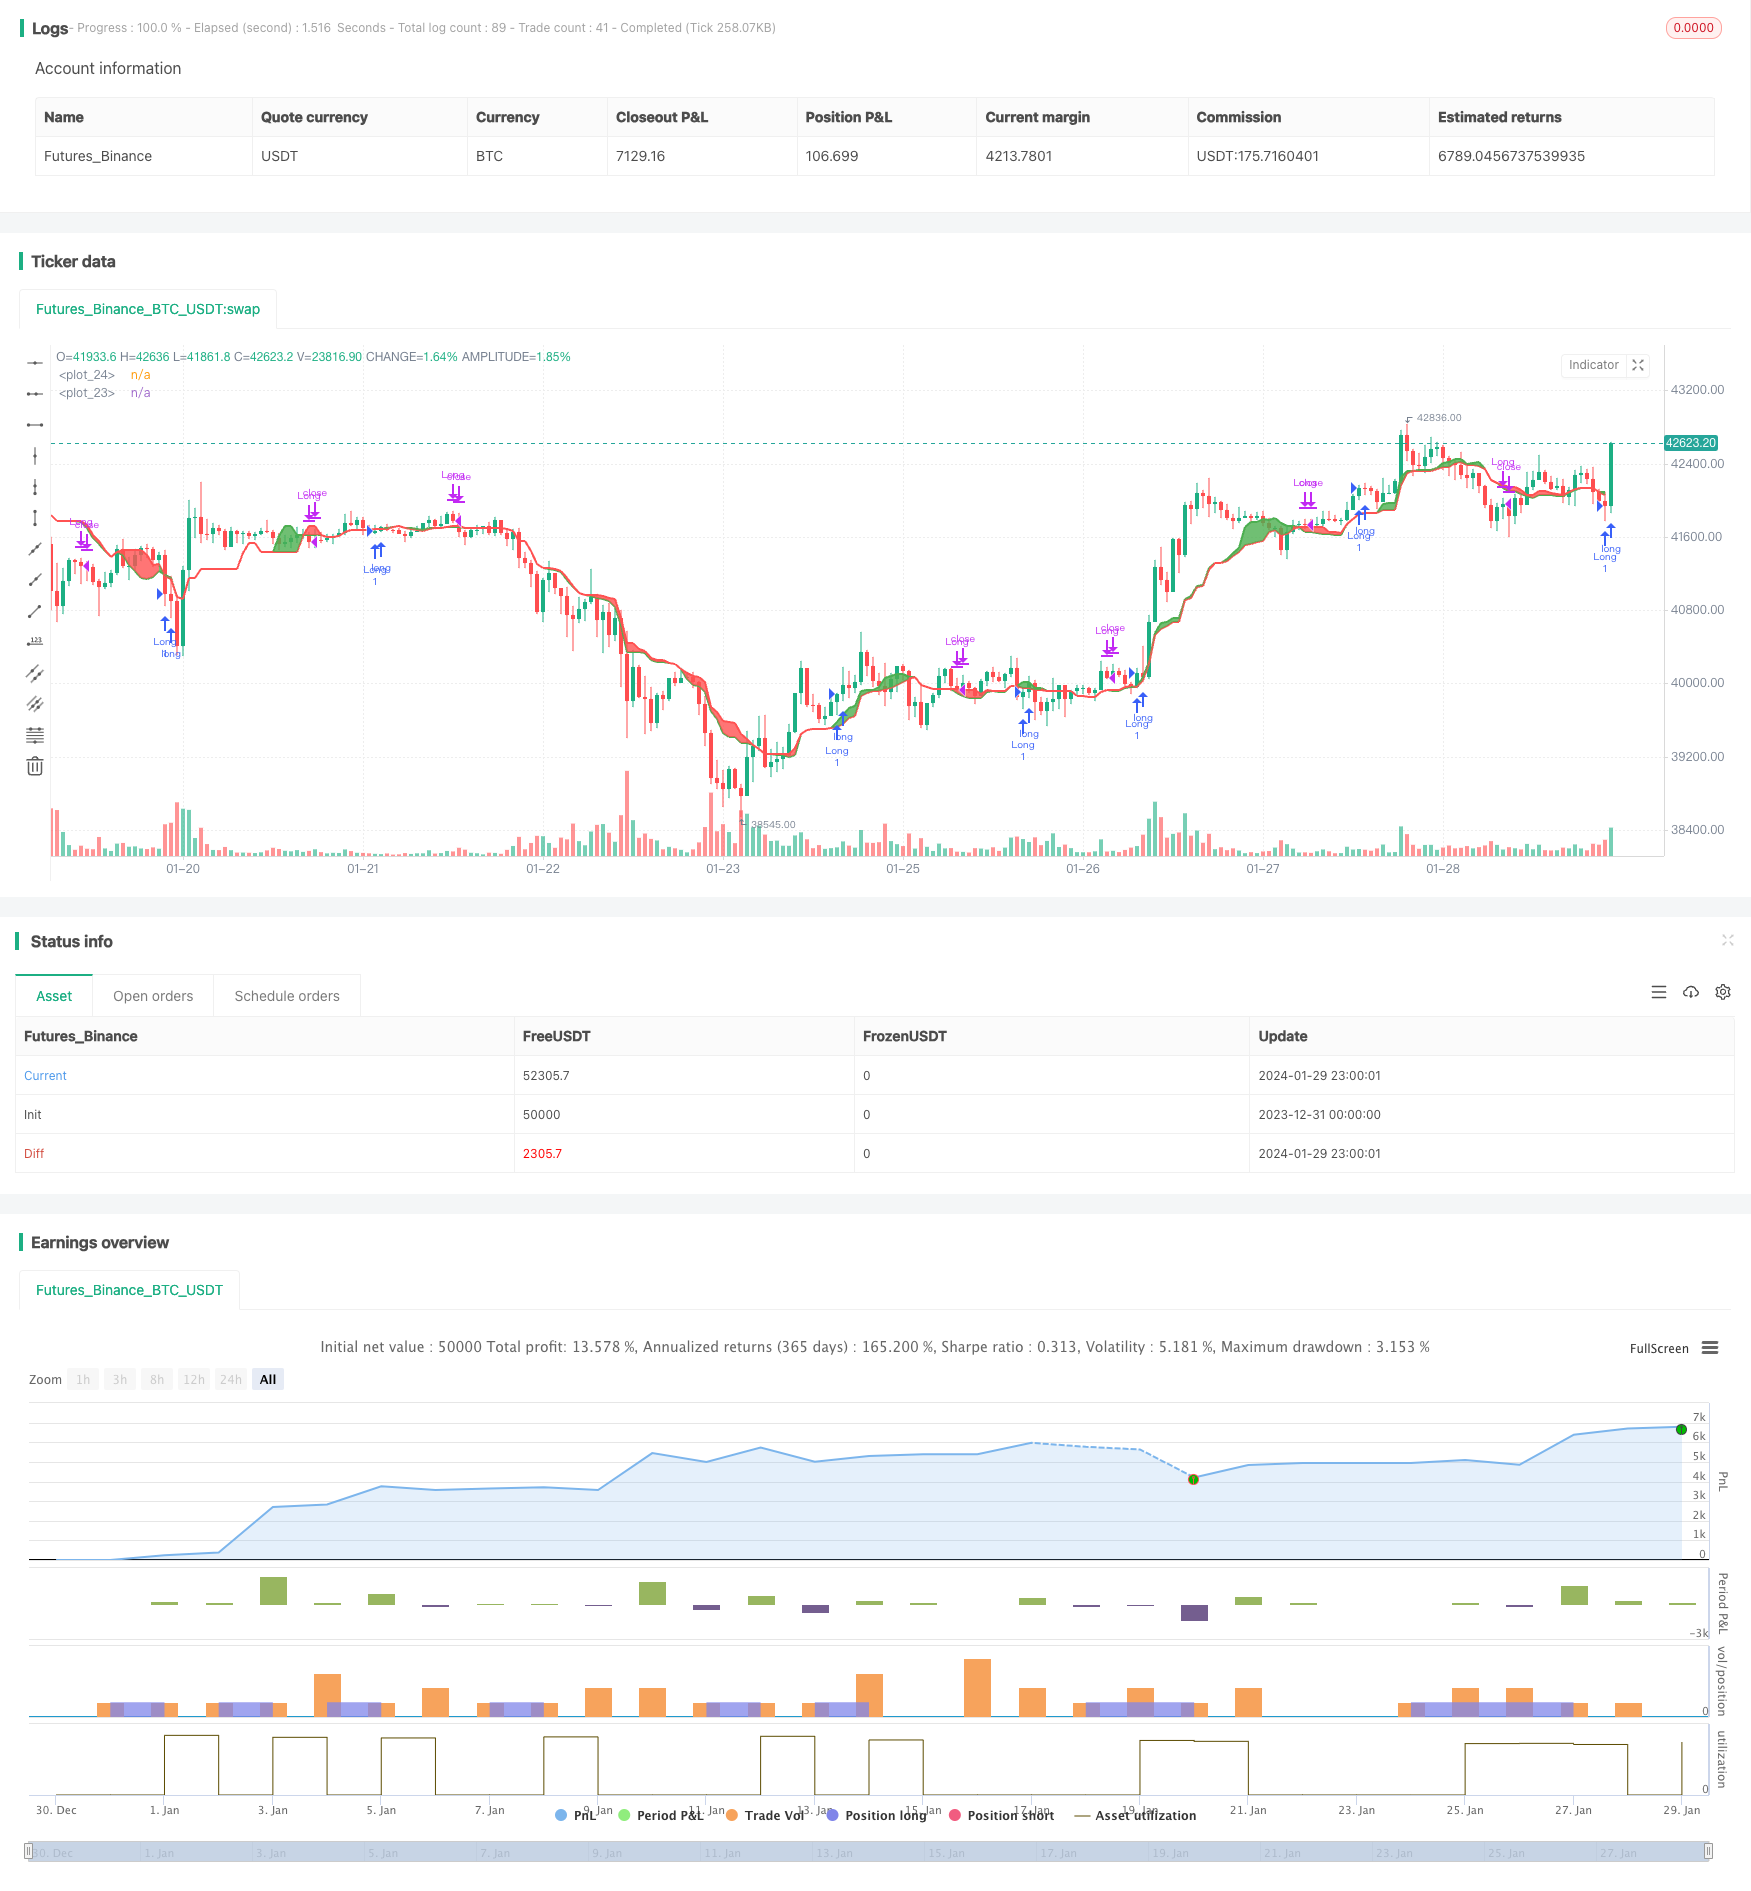
이치모쿠 클라우드 기반의 비트코인 거래 전략
저자:차오장, 날짜: 2024-01-31 11:06:02태그:

전반적인 설명
이 전략은 이치모쿠 클라우드 지표에 기반하여 설계된 비트코인 거래 전략이다. 단기선이 장기선을 넘을 때 다른 기간 동안의 평형 가격을 계산하여 거래 신호를 생성한다.
전략 논리
이 전략은 이치모쿠 클라우드 지표를 사용합니다. 구체적인 공식은 다음과 같습니다:
Lmax = 기간_max에서 가장 높은 가격
Smax = 기간_max에서 가장 낮은 가격
Lmed = 기간 중 가장 높은 가격
Smed = 기간 중 가장 낮은 가격
Lmin = 기간_min 중 가장 높은 가격
Smin = 기간_min 중 최저 가격
HL1 = (Lmax + Smax + Lmed + Smed) /4
HL2 = (Lmed + Smed + Lmin + Smin)/4
HL2가 HL1를 넘을 때 긴 신호가 생성됩니다. HL2가 HL1을 넘을 때 가까운 신호가 생성됩니다.
이점 분석
이 전략의 장점은 다음과 같습니다.
- 이치모쿠 클라우드를 사용하면 시장 소음을 필터하고 트렌드를 효과적으로 식별합니다.
- 서로 다른 기간 선의 크로스오버는 거래 신호를 생성하고 잘못된 신호를 감소시킵니다.
- 이 논리는 간단하고 이해하기 쉽고 실행하기 쉽습니다.
- 사용자 정의 가능한 기간 매개 변수는 다른 시장 환경에 적응합니다.
위험 분석
또한 몇 가지 위험이 있습니다.
- 이치모쿠 클라우드는 지연이 있고 단기 신호를 놓칠 수 있습니다.
- 장기 및 단기 라인의 크로스오버는 중재에 취약할 수 있습니다.
- 높은 변동성 상태에서 신호는 신뢰할 수 없게 될 수 있습니다.
이러한 위험은 매개 변수를 최적화하거나 다른 지표를 포함함으로써 줄일 수 있습니다.
최적화 방향
이 전략은 다음과 같은 측면에서 최적화 될 수 있습니다.
- 시장 변화에 적응하기 위해 장기 및 단기 기간을 최적화하십시오.
- 스톱 손실을 제어 손실에 추가합니다.
- MACD와 같은 다른 지표를 포함해서 정확도를 높일 수 있습니다.
- 큰 손실을 피하기 위해 높은 변동성 기간에 거래를 중단하십시오.
결론
이 전략은 이치모쿠 클라우드를 기반으로 한 단기 균형선이 장기선을 넘을 때 신호를 생성합니다. 단일 지표와 비교하면 잘못된 신호를 효과적으로 필터합니다. 매개 변수 및 위험 통제에 대한 추가 개선은 안정성과 수익성을 향상시킬 수 있습니다.
/*backtest
start: 2023-12-31 00:00:00
end: 2024-01-30 00:00:00
period: 1h
basePeriod: 15m
exchanges: [{"eid":"Futures_Binance","currency":"BTC_USDT"}]
*/

// This source code is subject to the terms of the Mozilla Public License 2.0 at https://mozilla.org/MPL/2.0/
// © Alferow

//@version=4
strategy("BTC_ISHIMOKU", overlay=true)

period_max = input(20, minval = 1)
period_med = input(10, minval = 1)
period_min = input(16, minval = 1)

Lmax = highest(high, period_max)
Smax = lowest(low, period_max)

Lmed = highest(high, period_med)
Smed = lowest(low, period_med)

Lmin = highest(high, period_min)
Smin = lowest(low, period_min)

HL1 = (Lmax + Smax + Lmed + Smed)/4
HL2 = (Lmed + Smed + Lmin + Smin)/4

p1 = plot(HL1, color = color.red, linewidth = 2)
p2 = plot(HL2, color = color.green, linewidth = 2)

fill(p1, p2, color = HL1 < HL2 ? color.green : color.red, transp = 90)

start = timestamp(input(2020, minval=1), 01, 01, 00, 00)
finish = timestamp(input(2025, minval=1),01, 01, 00, 00)
trig = time > start and time < finish ? true : false

strategy.entry("Long", true, when = crossover(HL2, HL1) and trig)
// strategy.entry("Short", false, when = crossunder(HL2, HL1) and trig)
strategy.close("Long", when = crossunder(HL2, HL1) and trig)
더 많은
- 양자 W 패턴 마스터 전략
- 슈퍼트렌드 BarUpDn 융합 전략
- ATR 트렌드 트래킹 전략
- 이동평균선과 저항 레벨 파업의 크로스오버 전략
- 매끄러운 이동 평균 스톱 로스 전략
- 모멘텀 볼링거 밴드 이중 이동 평균 DCA 전략
- 모멘텀 브레이크업 거래 전략
- 다중 요인 양적 거래 전략
- 이중 이동 평균의 크로스오버 전략
- 이중 메커니즘 동적 트렌드 추적 전략
- 황소시장 추적 시스템
- 렌코 로프 포인트 리트레이싱에 기반한 주식 내 하루 거래 전략
- 트렌드 트레이딩 전략, 이중 이동 평균의 가격 채널을 기반으로
- 이중 MA 모멘텀 브레이크업 전략
- SMART 전문 양적 거래 전략
- 이중 파업 변동성 채널 전략
- 여러 지표에 기초한 전략에 따른 경향
- 멀티 타임프레임 MACD 거래 전략
- 벤치마크와 함께 월간 수익 전략
- 스프레시 모멘텀 브레이크업 전략