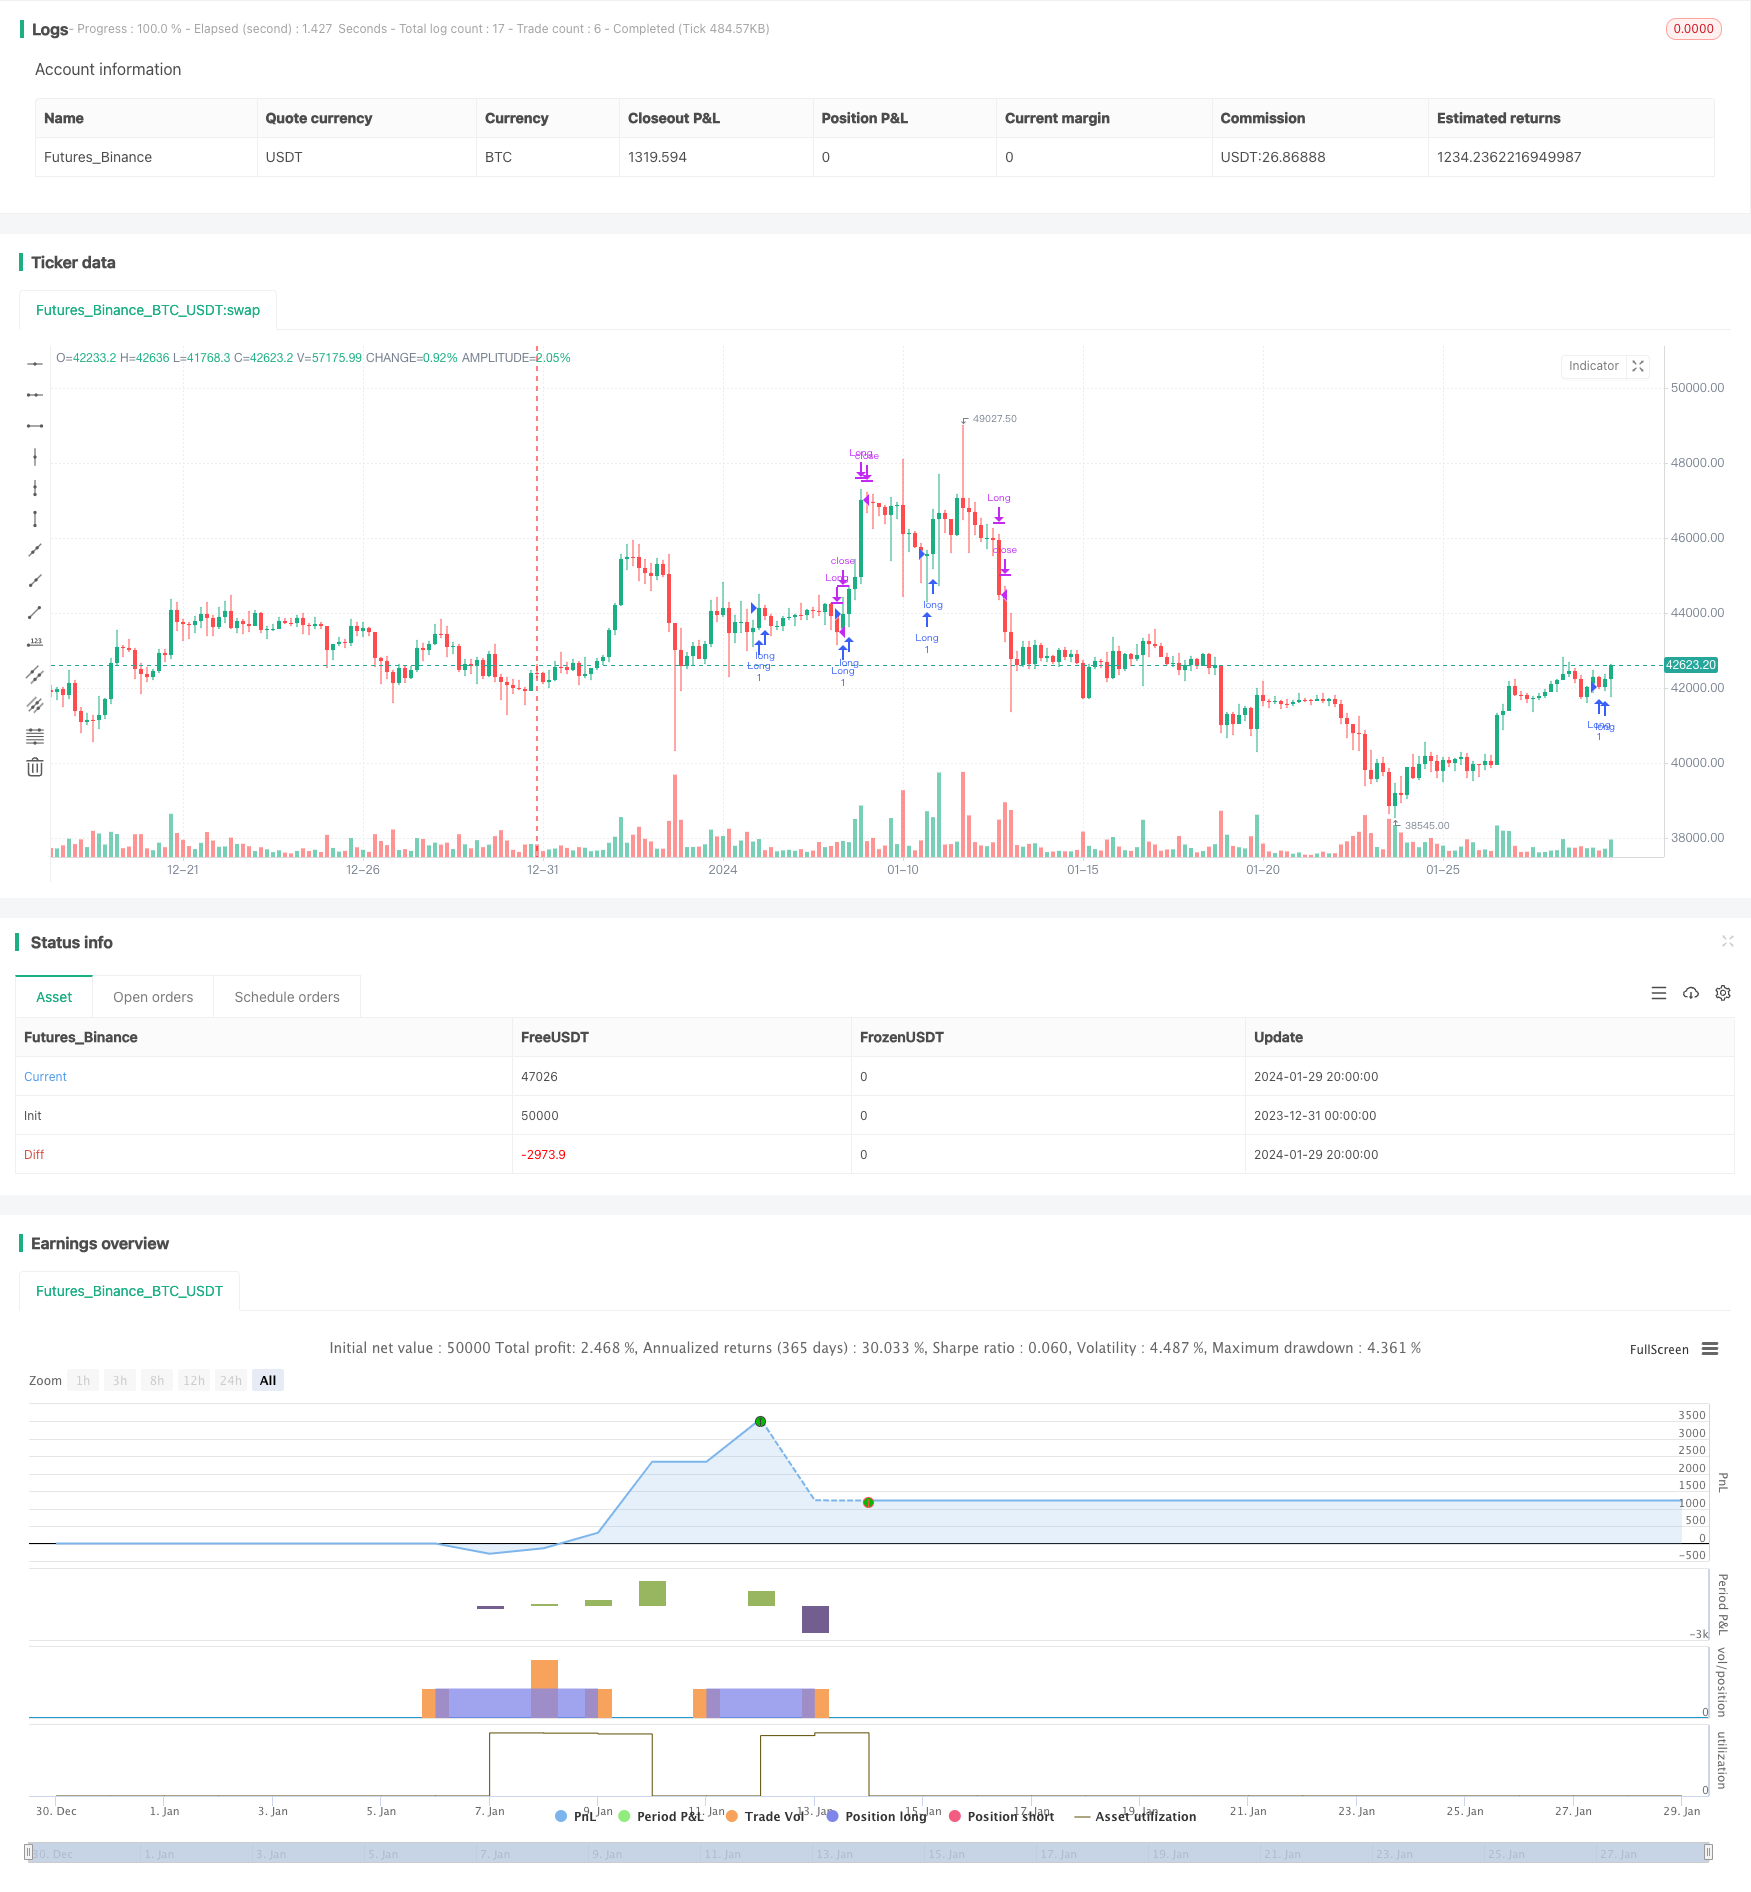
概述
该策略是一个结合多种技术指标的量化交易策略。它融合了移动平均线、MACD、布林带、RSI等多种指标,实现多因子模型驱动的自动化交易。
策略原理
该策略的交易信号来源于以下几个部分:
- 双移动平均线形成金叉死叉
- MACD形成零轴上穿和零轴下穿
- 布林带上下轨反转
- RSI过买过卖区反转
当上述多个指标同时发出买入或卖出信号时,该策略会进行相应的买入开仓或卖出平仓操作。
具体来说,当快速移动平均线上穿慢速移动平均线,并且MACD histograms出现柱状线增长,RSI从超卖区反弹上涨,并且价格接近布林带下轨时,认为行情有所反转,这样产生买入信号。
而当快速移动平均线下穿慢速移动平均线,MACD histograms出现柱状线减少,RSI从超买区下跌,并且价格接近布林带上轨时,认为行情即将见顶,这样产生卖出信号。
通过这样多指标组合发出信号,可以有效过滤假信号,提高策略稳定性。
优势分析
该策略最大的优势在于利用多因子模型进行交易,可以提高信号的可靠性,增强策略的稳定性和收益率。
多因子模型可以互相验证交易信号,有效减少假信号的干扰。
不同类别的指标可以捕捉市场行情的更全面特征,做出更准确判断。
多因子组合可以平滑单一指标存在的震荡特性,保证收益更加稳定。
可以灵活调整组合中的指标以及各指标的权重,针对不同市场个性化策略。
风险分析
该策略也存在一些风险需要注意:
复杂的多指标组合,参数设置和指标选择需要精确计算和测试,否则容易产生失效信号。
单一品种效果可能不稳定,需要选取合适的品种组合进行跨品种交易,分散单一品种风险。
需要严格控制仓位规模和止损策略,防止极端行情带来的亏损扩大。
优化方向
该策略有以下几个可优化的方向:
测试更多指标的组合,寻找最优参数。例如波动率,成交量等其他指标引入组合中。
利用机器学习方法自动生成最优策略组合及参数配置。
在更长时间尺度上测试和优化,针对不同市场阶段调整权重。
结合风险管理工具,严格控制单笔止损和整体仓位。
总结
该策略综合运用多种交易指标形成多因子模型,有效利用了不同指标的优势,增强了信号判断能力。同时也需要注意风险防控,通过参数优化和更新可以不断提高策略的稳定性和收益性。
/*backtest
start: 2023-12-31 00:00:00
end: 2024-01-30 00:00:00
period: 4h
basePeriod: 15m
exchanges: [{"eid":"Futures_Binance","currency":"BTC_USDT"}]
*/

//@version=5
strategy("Математическая Торговая Система с Ишимоку, TP/SL, ADX, RSI, OBV", shorttitle="МТС Ишимоку TP/SL ADX RSI OBV", overlay=true)

is_short_enable = input(0, title="Короткие сделки")
is_long_enable = input(1, title="Длинные сделки")

// Входные параметры для скользящих средних
fast_length = input(21, title="Быстрый период")
slow_length = input(26, title="Медленный период")

// Входные параметры для Ишимоку
tenkan_length = input(9, title="Тенкан-сен")
kijun_length = input(26, title="Киджун-сен")
senkou_length = input(52, title="Сенкоу-спан B")

// Входные параметры для ADX
adx_length = input(14, title="ADX период")
adx_level = input(30, title="ADX уровень")

// Входные параметры для RSI
rsi_length = input(14, title="RSI период")
rsi_overbought = input(70, title="RSI перекупленность")
rsi_oversold = input(30, title="RSI перепроданность")

// Входные параметры для OBV
obv_length = input(14, title="OBV период")

// Вычисление скользящих средних
fast_ma = ta.sma(close, fast_length)
slow_ma = ta.sma(close, slow_length)

// Вычисление Ишимоку
tenkan_sen = ta.sma(high + low, tenkan_length) / 2
kijun_sen = ta.sma(high + low, kijun_length) / 2
senkou_span_a = (tenkan_sen + kijun_sen) / 2
senkou_span_b = ta.sma(close, senkou_length)

// Вычисление ADX
[diplus, diminus, adx_value] = ta.dmi(14, adx_length)

// Вычисление RSI
rsi_value = ta.rsi(close, rsi_length)

// Вычисление OBV
f_obv() => ta.cum(math.sign(ta.change(close)) * volume)
f_obv_1() => ta.cum(math.sign(ta.change(close[1])) * volume[1])
f_obv_2() => ta.cum(math.sign(ta.change(close[2])) * volume[2])
f_obv_3() => ta.cum(math.sign(ta.change(close[3])) * volume[3])
obv_value = f_obv()

price_is_up = close[1] > close[3]
price_crossover_fast_ma = close > fast_ma
fast_ma_is_up = ta.sma(close[1], fast_length) > ta.sma(close[3], fast_length)
rsi_is_trand_up = ta.rsi(close[1], rsi_length) > ta.rsi(close[3], rsi_length)
rsi_is_upper_50 = rsi_value > 50
obv_is_trand_up = f_obv_1() > f_obv_3() and obv_value > ta.sma(obv_value, obv_length)
is_up = price_is_up and price_crossover_fast_ma and fast_ma_is_up and rsi_is_trand_up and rsi_is_upper_50 and obv_is_trand_up

fast_ma_is_down = close < fast_ma
rsi_is_trend_down =  ta.rsi(close[1], rsi_length) < ta.rsi(close[2], rsi_length)
rsi_is_crossover_sma = rsi_value < ta.sma(rsi_value, rsi_length)
obv_is_trend_down =  f_obv_1() < f_obv_2()
obv_is_crossover_sma = obv_value < ta.sma(obv_value, obv_length)
is_down = fast_ma_is_down and rsi_is_trend_down and rsi_is_crossover_sma and obv_is_trend_down and obv_is_crossover_sma

//----------//
// MOMENTUM //
//----------//
ema8 = ta.ema(close, 8)
ema13 = ta.ema(close, 13)
ema21 = ta.ema(close, 21)
ema34 = ta.ema(close, 34)
ema55 = ta.ema(close, 55)

longEmaCondition = ema8 > ema13 and ema13 > ema21 and ema21 > ema34 and ema34 > ema55
exitLongEmaCondition = ema13 < ema55

shortEmaCondition = ema8 < ema13 and ema13 < ema21 and ema21 < ema34 and ema34 < ema55
exitShortEmaCondition = ema13 > ema55

// ----------  //
// OSCILLATORS //
// ----------- //
rsi = ta.rsi(close, 14)
longRsiCondition = rsi < 70 and rsi > 40
exitLongRsiCondition = rsi > 70

shortRsiCondition = rsi > 30 and rsi < 60
exitShortRsiCondition = rsi < 30

// Stochastic
length = 14, smoothK = 3, smoothD = 3
kFast = ta.stoch(close, high, low, 14)
dSlow = ta.sma(kFast, smoothD)

longStochasticCondition = kFast < 80
exitLongStochasticCondition = kFast > 95

shortStochasticCondition = kFast > 20
exitShortStochasticCondition = kFast < 5

// Логика входа и выхода
longCondition = longEmaCondition and longRsiCondition and longStochasticCondition and strategy.position_size == 0
exitLongCondition = (exitLongEmaCondition or exitLongRsiCondition or exitLongStochasticCondition) and strategy.position_size > 0

shortCondition = shortEmaCondition and shortRsiCondition and shortStochasticCondition and strategy.position_size == 0
exitShortCondition = (exitShortEmaCondition or exitShortRsiCondition or exitShortStochasticCondition) and strategy.position_size < 0

enter_long = (ta.crossover(close, senkou_span_a) or is_up) and longCondition
enter_short = (ta.crossunder(close, senkou_span_a) or is_down) and shortCondition

exit_long = ((ta.crossunder(fast_ma, slow_ma) or ta.crossunder(close, senkou_span_b) or enter_short) or exitLongCondition)
exit_short = ((ta.crossover(fast_ma, slow_ma) or ta.crossover(close, senkou_span_b) or enter_long) or exitShortCondition)

// Выполнение сделок
if is_long_enable == 1
    strategy.entry("Long", strategy.long, when=enter_long)
    strategy.close("Long", when=exit_long)

if is_short_enable == 1
    strategy.entry("Short", strategy.short, when=enter_short)
    strategy.close("Short", when=exit_short)