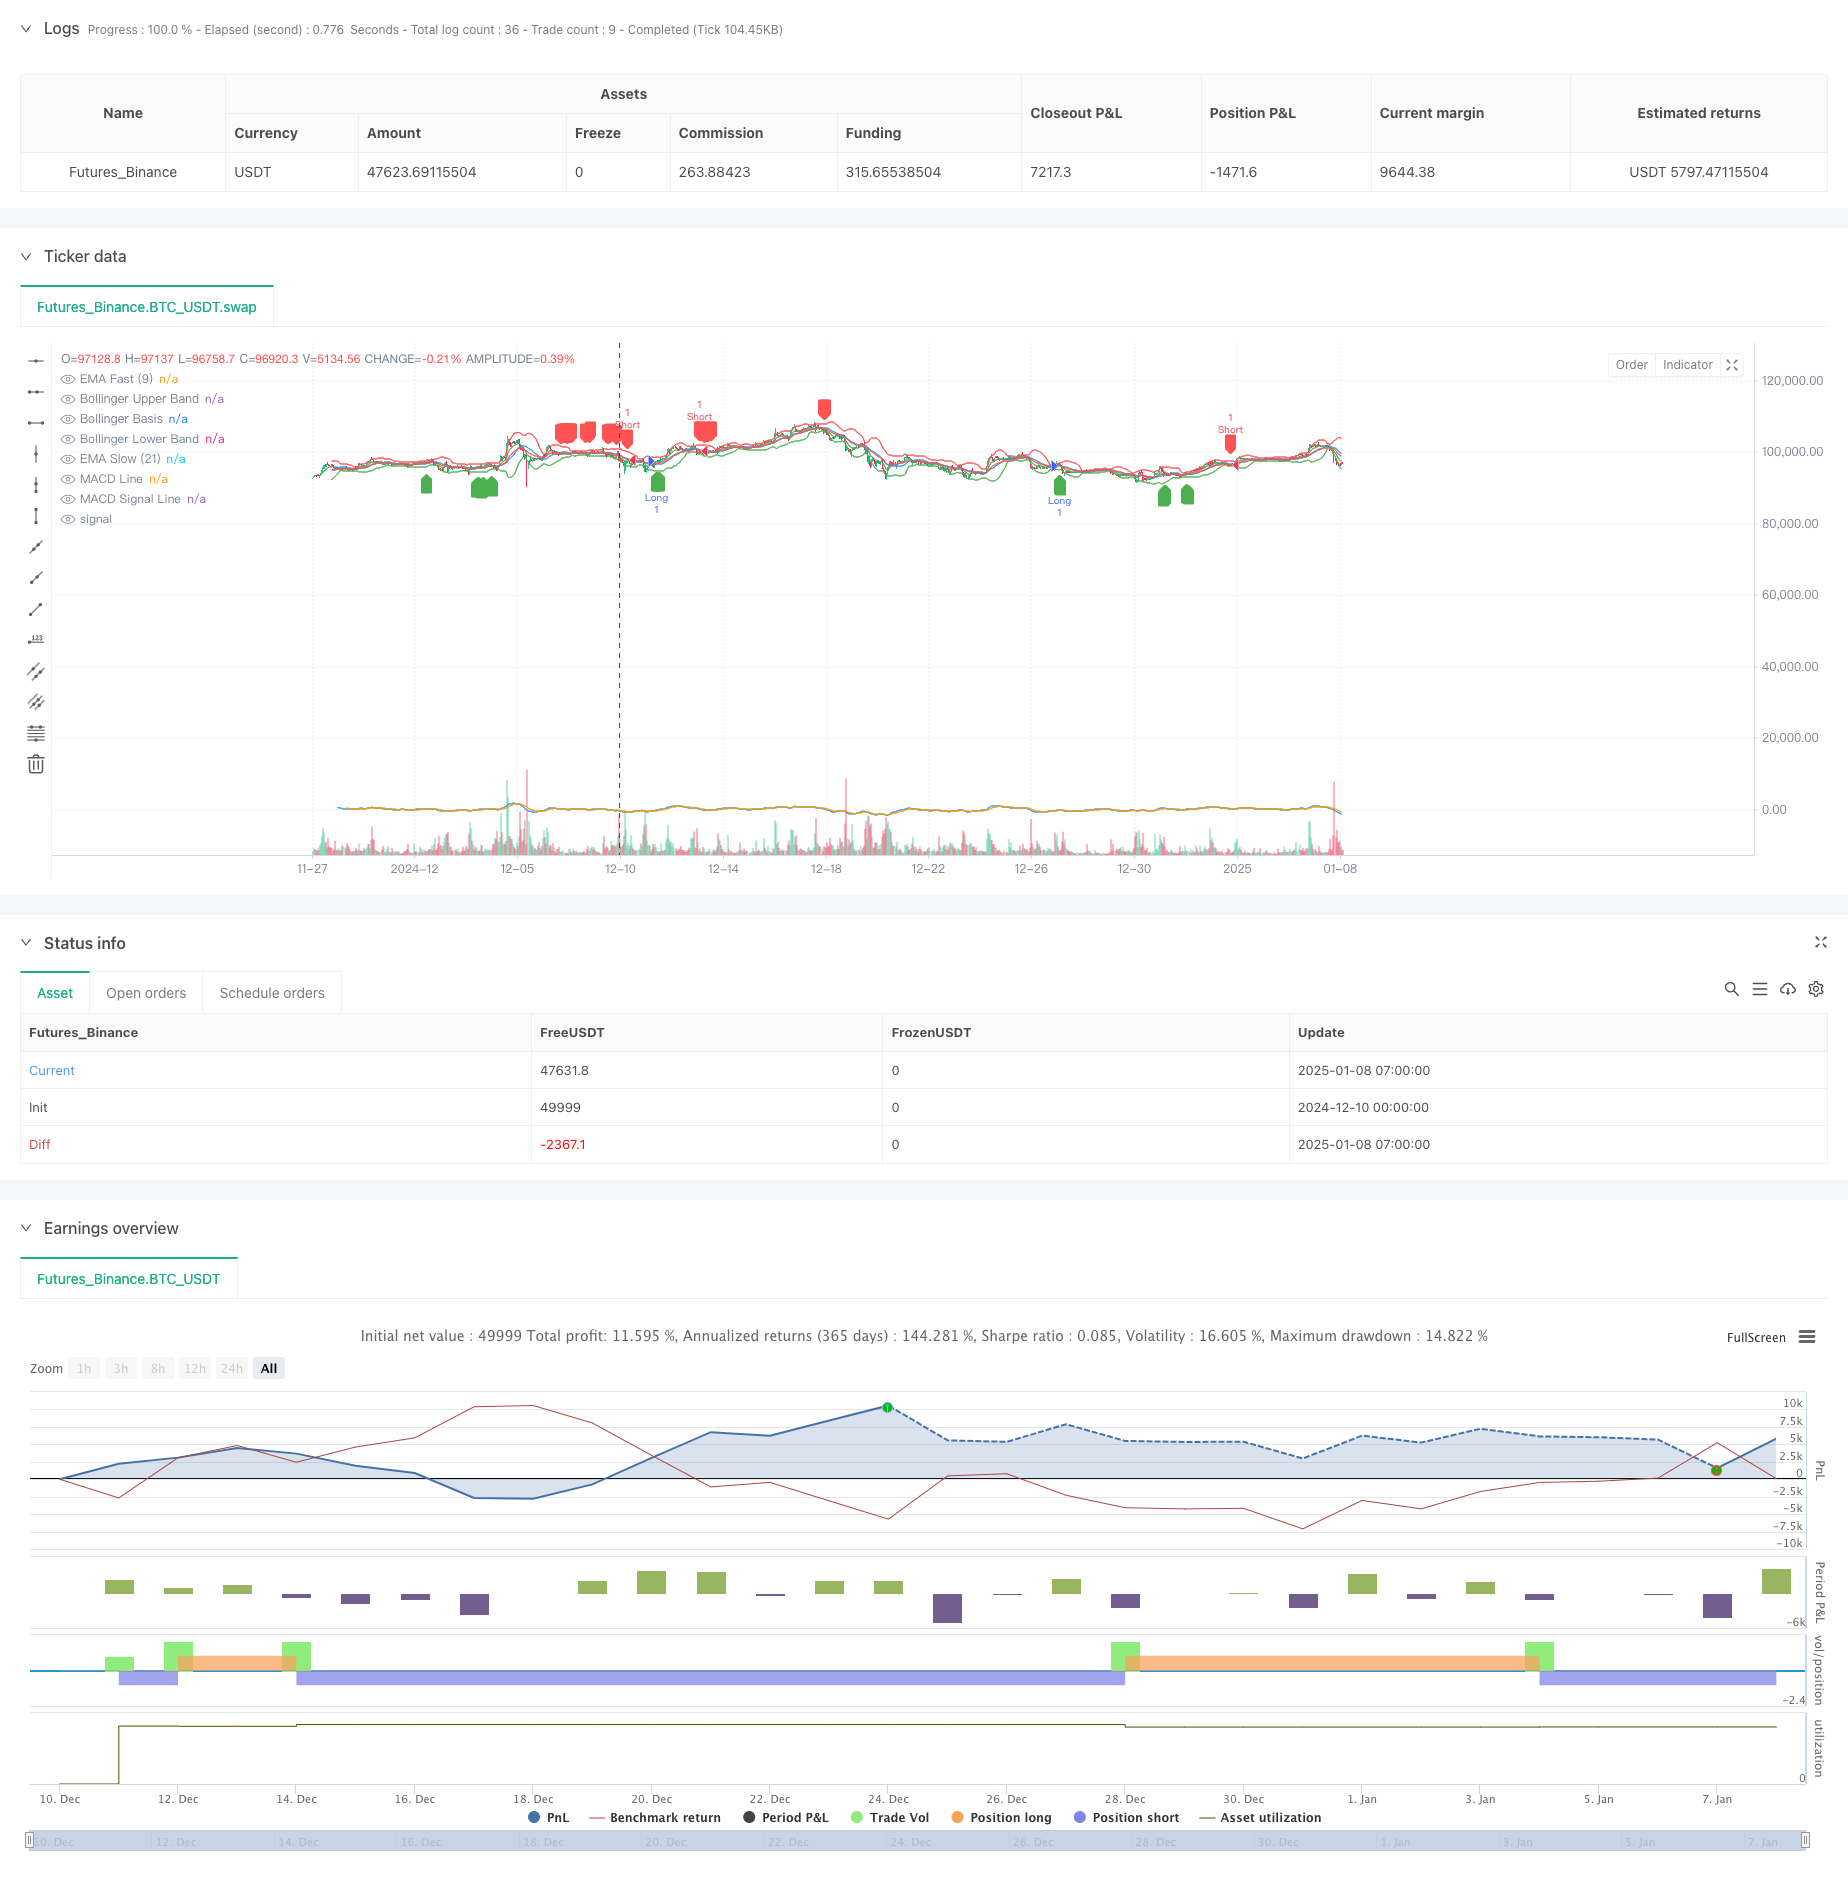
다중 지표 트렌드 모멘텀 거래 전략: 볼링거 밴드, 피보나치 및 ATR에 기반한 최적화된 양적 거래 시스템
저자:차오장, 날짜: 2025-01-10 16:22:55태그:MACDRSIEMABBATRFIBOSMAMSD

전반적인 설명
이 전략은 다차원 기술 분석 거래 시스템으로, 추진량 지표 (RSI, MACD), 트렌드 지표 (EMA), 변동성 지표 (볼린거 밴드, ATR), 가격 구조 지표 (피보나치 리트레이싱) 를 결합하여 다차원 신호 조정을 통해 시장 기회를 포착합니다. 이 전략은 15분 시간 프레임에 최적화되어 있으며, ATR 기반의 동적 스톱 로스 및 영업 수준을 사용하여 강력한 리스크 제어 기능을 보여줍니다.
전략 원칙
핵심 논리는 다음과 같은 차원을 포함합니다. 1. 추세 확인: 사용9⁄21트렌드 방향을 결정하기 위한 기간 EMA 크로스오버 모멘텀 검증: RSI 과잉 구매/ 과잉 판매를 결합 (55⁄45) 및 모멘텀 검증을 위한 MACD 히스토그램 변동성 참조: 가격 변동성을 측정하기 위해 볼링거 밴드 (20 기간, 2 표준편차) 를 사용 4. 지원/저항: 피보나치 0.382⁄0.618⁄0.786 수준은 100주기 최고/하위 기준으로 계산됩니다. 5. 리스크 관리: 14기 ATR에 기초한 ATR의 스톱 로스 1.5배, ATR의 영업이익 3배
거래는 다차원 신호가 정렬될 때만 이루어지며 거래의 정확성을 향상시킵니다.
전략적 장점
- 다차원 신호 교차 검증으로 잘못된 신호가 감소합니다.
- 동적 ATR 기반의 스톱 로스 및 취리 수익은 다른 시장 조건에 적응합니다.
- 클래식 기술 지표의 통합은 이해하기 쉽고 유지하기 쉽다
- 정확한 출입 시기는 승률을 향상시킵니다.
- 1: 2의 위험/이익 비율은 전문적인 거래 기준을 충족합니다.
- 매우 변동적인 시장 환경에 적합합니다
전략 위험
- 매개 변수 최적화는 과도한 부착으로 이어질 수 있습니다.
- 여러 신호 조건이 시장 움직임을 놓칠 수 있습니다.
- 고정 곱셈 스톱은 극단적인 시장 조건에서 실패 할 수 있습니다.
- 높은 컴퓨팅 자원 요구 사항
- 거래 비용은 전략 성과에 영향을 줄 수 있습니다.
전략 최적화 방향
- 신호 강도를 확인하기 위해 부피 인수를 입력
- 다른 시장에 대한 RSI 임계값을 동적으로 조정합니다.
- 트렌드 강도 필터를 추가
- 스톱 로스 및 취업 이윤 곱셈을 최적화
- 시장의 범위를 피하기 위해 시간 필터를 추가
- 동적 매개 변수 최적화를 위해 기계 학습을 구현하는 것을 고려하십시오.
요약
이 전략은 다차원 기술 지표의 조화를 통해 견고한 거래 시스템을 구축합니다. 그것의 핵심 장점은 신호의 교차 검증과 동적 위험 통제에 있습니다. 그러나 매개 변수 최적화 및 시장 환경 적응성에주의를 기울여야합니다. 미래 최적화는 동적 매개 변수 조정 및 신호 품질 개선에 초점을 맞추어야합니다.
/*backtest
start: 2024-12-10 00:00:00
end: 2025-01-08 08:00:00
period: 1h
basePeriod: 1h
exchanges: [{"eid":"Futures_Binance","currency":"BTC_USDT","balance":49999}]
*/

//@version=5
strategy("Optimized Advanced Strategy", overlay=true)

// Bollinger Bandı
length = input(20, title="Bollinger Band Length")
src = close
mult = input.float(2.0, title="Bollinger Band Multiplier")
basis = ta.sma(src, length)
dev = mult * ta.stdev(src, length)
upper = basis + dev
lower = basis - dev

// RSI
rsi = ta.rsi(close, 14)

// MACD
[macdLine, signalLine, _] = ta.macd(close, 12, 26, 9)

// EMA
emaFast = ta.ema(close, 9)
emaSlow = ta.ema(close, 21)

// ATR
atr = ta.atr(14)

// Fibonacci Seviyeleri
lookback = input(100, title="Fibonacci Lookback Period")
highPrice = ta.highest(high, lookback)
lowPrice = ta.lowest(low, lookback)
fiboLevel618 = lowPrice + (highPrice - lowPrice) * 0.618
fiboLevel382 = lowPrice + (highPrice - lowPrice) * 0.382
fiboLevel786 = lowPrice + (highPrice - lowPrice) * 0.786

// Kullanıcı Ayarlı Stop-Loss ve Take-Profit
stopLossATR = atr * 1.5
takeProfitATR = atr * 3

// İşlem Koşulları
longCondition = (rsi < 55) and (macdLine > signalLine) and (emaFast > emaSlow) and (close >= fiboLevel382 and close <= fiboLevel618)
shortCondition = (rsi > 45) and (macdLine < signalLine) and (emaFast < emaSlow) and (close >= fiboLevel618 and close <= fiboLevel786)

// İşlem Girişleri
if (longCondition)
    strategy.entry("Long", strategy.long, stop=close - stopLossATR, limit=close + takeProfitATR, comment="LONG SIGNAL")

if (shortCondition)
    strategy.entry("Short", strategy.short, stop=close + stopLossATR, limit=close - takeProfitATR, comment="SHORT SIGNAL")

// Bollinger Bandını Çizdir
plot(upper, color=color.red, title="Bollinger Upper Band")
plot(basis, color=color.blue, title="Bollinger Basis")
plot(lower, color=color.green, title="Bollinger Lower Band")

// Fibonacci Seviyelerini Çizdir
// line.new(x1=bar_index[1], y1=fiboLevel382, x2=bar_index, y2=fiboLevel382, color=color.blue, width=1, style=line.style_dotted)
// line.new(x1=bar_index[1], y1=fiboLevel618, x2=bar_index, y2=fiboLevel618, color=color.orange, width=1, style=line.style_dotted)
// line.new(x1=bar_index[1], y1=fiboLevel786, x2=bar_index, y2=fiboLevel786, color=color.purple, width=1, style=line.style_dotted)

// Göstergeleri Görselleştir
plot(macdLine, color=color.blue, title="MACD Line")
plot(signalLine, color=color.orange, title="MACD Signal Line")
plot(emaFast, color=color.green, title="EMA Fast (9)")
plot(emaSlow, color=color.red, title="EMA Slow (21)")

// İşlem İşaretleri
plotshape(series=longCondition, location=location.belowbar, color=color.green, style=shape.labelup, title="Long Entry")
plotshape(series=shortCondition, location=location.abovebar, color=color.red, style=shape.labeldown, title="Short Entry")
관련
- 상위 윗부분의 윗부분의 윗부분의 윗부분의 윗부분의
- 다중 지표 동적 스톱 로스 동력 트렌드 거래 전략
- 다중 지표 포괄적 거래 전략: 모멘텀, 과잉 구매 / 과잉 판매 및 변동성의 완벽한 조합
- 옵션 거래 제안 시스템과 함께 다 기간 기하급수적 이동 평균 크로스오버 전략
- 골든 모멘텀 캡처 전략: 멀티 타임프레임 기하급수적 이동 평균 크로스오버 시스템
- RSI 모멘텀 필터와 함께 전략에 따른 다기술 지표 트렌드
- 다중 EMA 트렌드 동적 ATR 목표와 함께 전략에 따라
- 유동성 높은 통화 쌍을 위한 단기 단기 판매 전략
- 멀티테크니컬 인디케이터 시너지 거래 시스템
- 다기술 지표 동적 적응 거래 전략 (MTDAT)
더 많은
- 양적 거래 전략에 따른 멀티 EMA 크로스오버 트렌드
- 다단계 지표 중복 RSI 거래 전략
- 볼링거 밴드 및 피보나치 내일 트렌드 전략
- 리스크 관리 시스템과 함께 두 개의 이동 평균 채널 전략을 따르는 동적 경향
- EMA, 마드리드 리본 및 돈치안 채널에 기반한 전략에 따른 다중 모드 영업/손실 중단 트렌드
- 동적 RSI 가격 격차 탐지 및 적응형 거래 전략 시스템
- 피라미드 거래 전략을 따르는 다차원적 경향
- 트리플 바닥 리바운드 모멘텀 돌파구 전략
- 듀얼 타임프레임 트렌드 역전 촛불 패턴 양적 거래 전략
- 부피 분석 적응 전략과 함께 높은 주파수 가격-용량 트렌드
- 증강된 가격-용량 트렌드 동력 전략
- 동적 수익/손실 관리 시스템으로 지능적인 이동 평균 크로스오버 전략
- 적응형 멀티-MA 모멘텀 돌파구 거래 전략
- 적응 동력 평균 역전 크로스오버 전략
- 역 거래 최적화 전략과 함께 적응 가능한 양방향 EMA 트렌드 거래 시스템