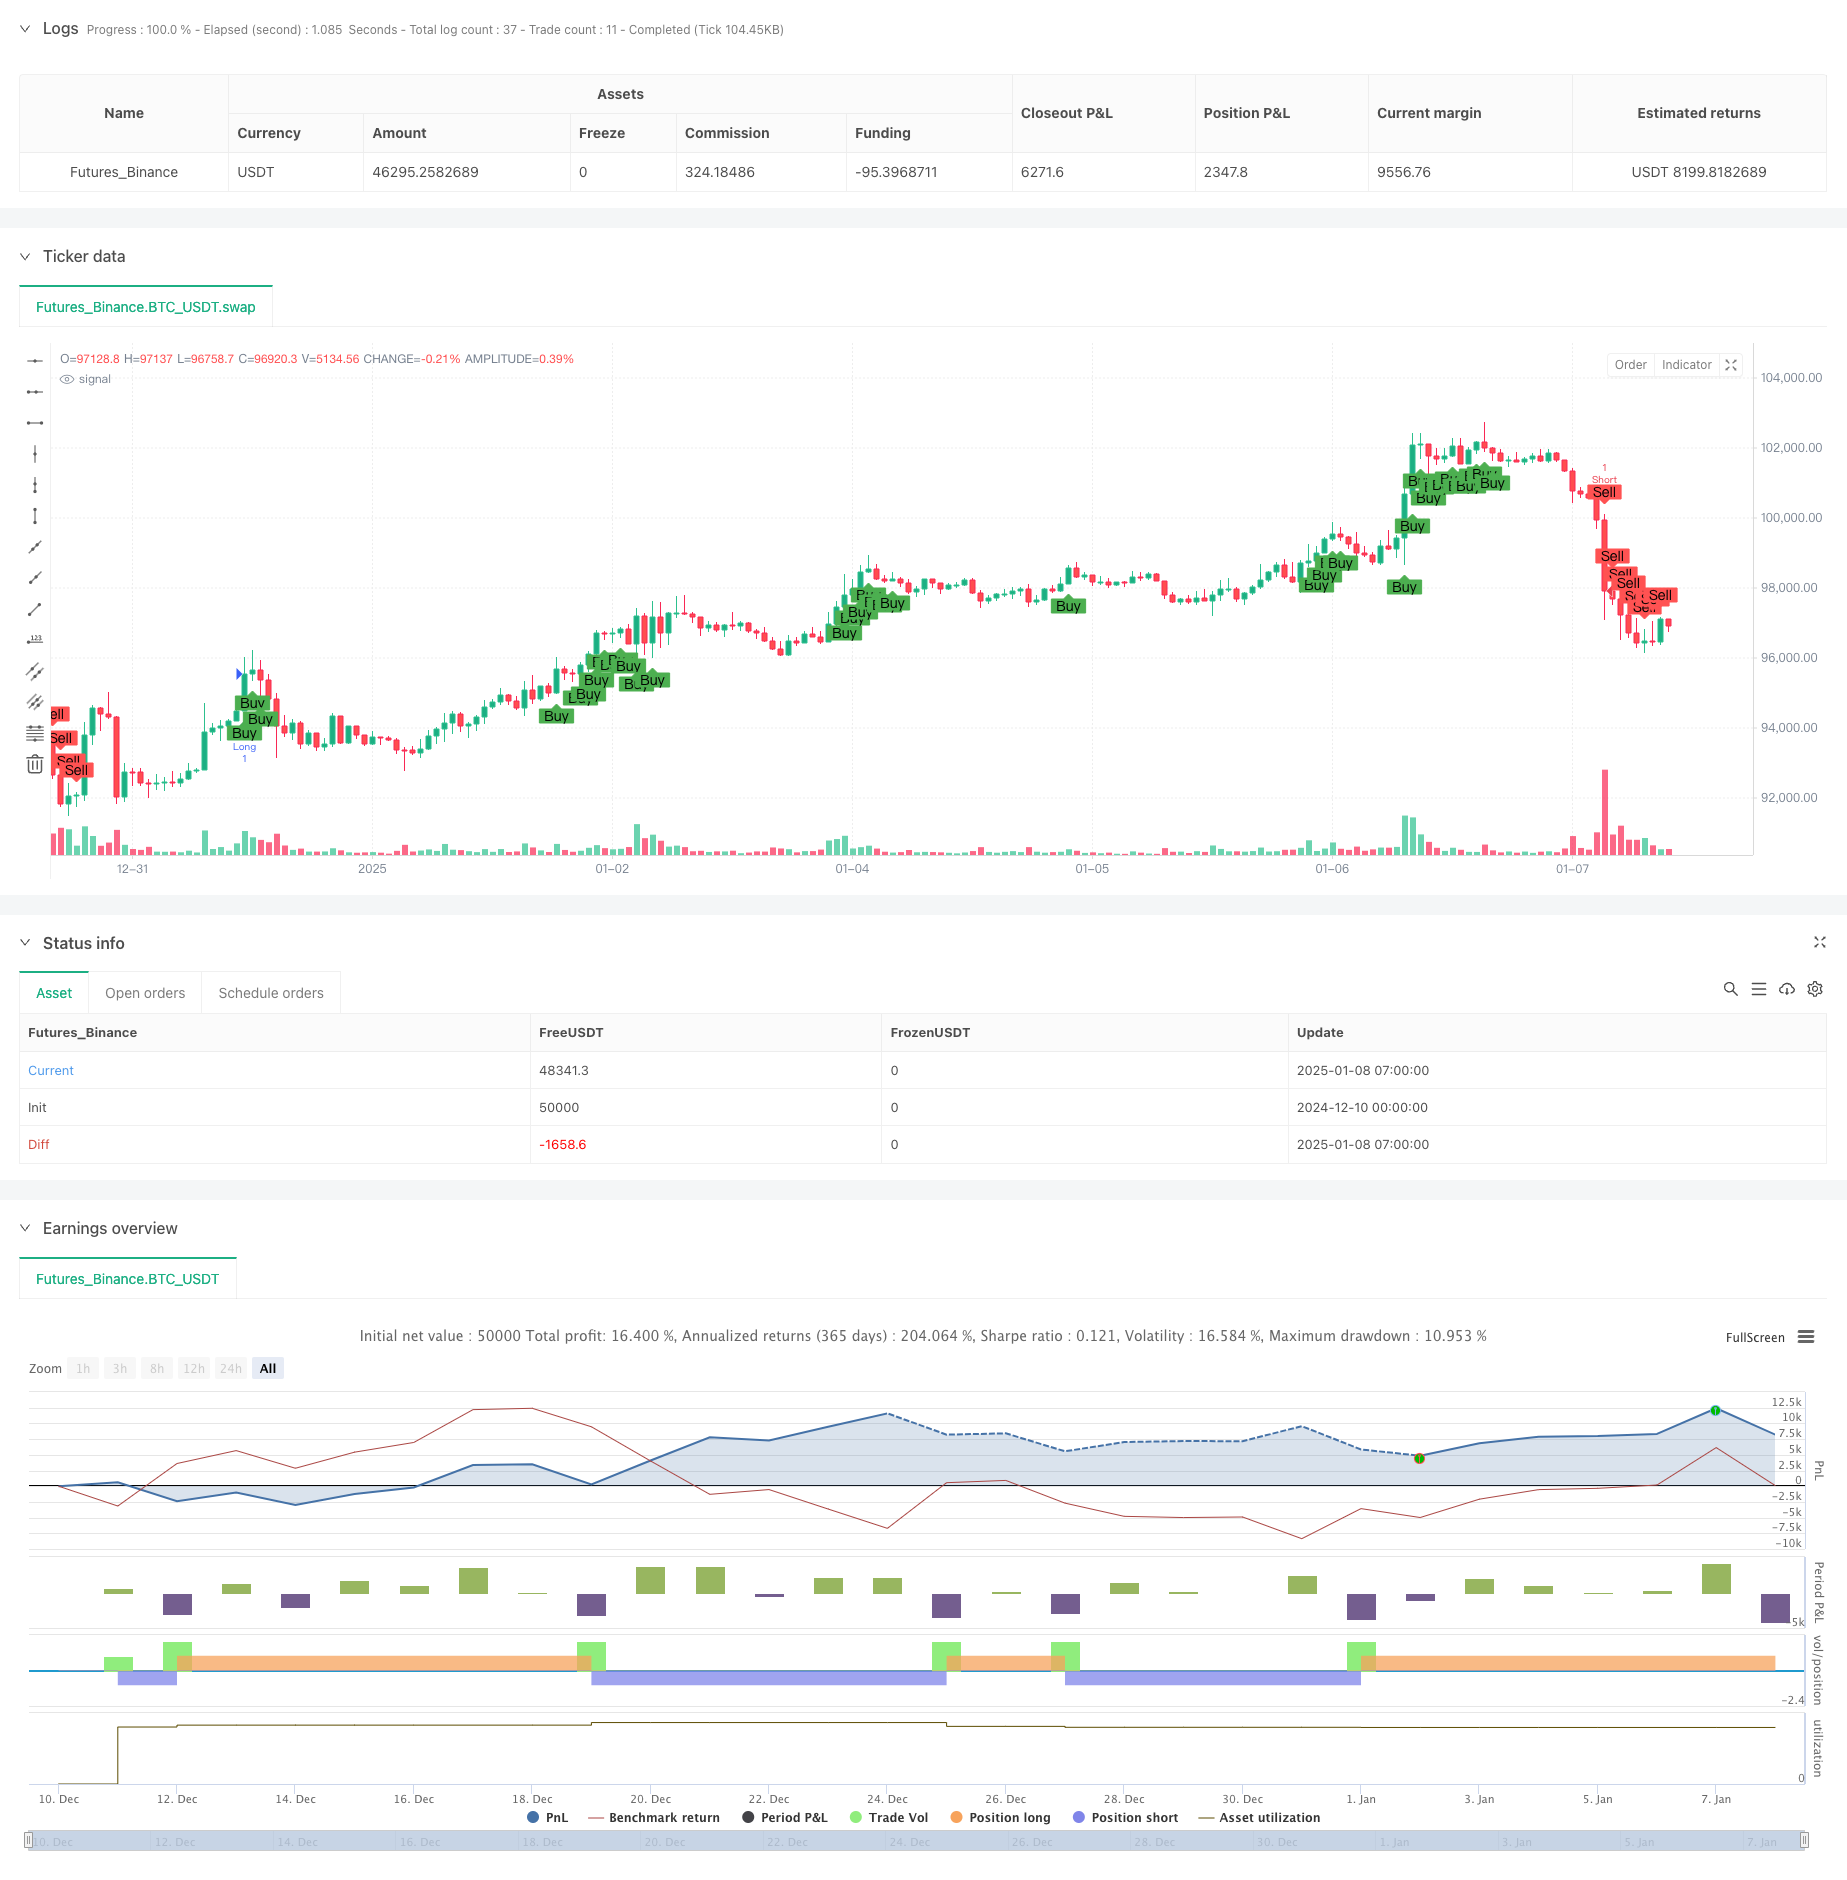
Strategi Perbezaan EMA-RSI Berganda: Sistem Penangkapan Trend Berdasarkan Purata Bergerak Eksponensial dan Kekuatan Relatif
Penulis:ChaoZhang, Tarikh: 2025-01-10 15:03:06Tag:EMARSI

Ringkasan
Ini adalah strategi trend berikut yang menggabungkan Exponential Moving Average (EMA) dan Relative Strength Index (RSI). Strategi ini mengenal pasti isyarat perdagangan dengan memantau persilangan EMA yang cepat dan perlahan sambil menggabungkan tahap overbought / oversold RSI dan divergensi RSI untuk menangkap trend pasaran dengan berkesan.
Prinsip Strategi
Logik teras merangkumi elemen utama berikut: 1. Menggunakan EMA 9-period dan 26-period untuk menentukan arah trend, dengan uptrend ditunjukkan apabila garisan pantas di atas garisan perlahan 2. Menggunakan RSI 14 tempoh dengan 65 dan 35 sebagai ambang untuk isyarat panjang dan pendek 3. Mengesan perbezaan RSI pada jangka masa 1 jam dengan membandingkan harga tinggi / rendah dengan RSI tinggi / rendah 4. Masuk panjang memerlukan: EMA yang cepat di atas EMA yang perlahan, RSI di atas 65, dan tidak ada perbezaan RSI menurun 5. Pendaftaran pendek memerlukan: EMA yang cepat di bawah EMA yang perlahan, RSI di bawah 35, dan tidak ada perbezaan RSI menaik
Kelebihan Strategi
- Validasi silang beberapa penunjuk teknikal meningkatkan kebolehpercayaan isyarat
- Pengesanan perbezaan RSI mengurangkan risiko pecah palsu
- Menggabungkan faedah trend berikut dan keadaan overbought/oversold
- Parameter boleh dioptimumkan untuk ciri pasaran yang berbeza
- Logik strategi yang jelas yang mudah difahami dan dilaksanakan
Risiko Strategi
- EMA sebagai penunjuk yang ketinggalan mungkin membawa kepada titik kemasukan suboptimal
- RSI boleh menghasilkan isyarat berlebihan di pasaran pelbagai
- Pengesanan perbezaan boleh menghasilkan bacaan yang salah, terutamanya di pasaran yang tidak menentu
- Pengurangan yang signifikan mungkin semasa pembalikan pasaran yang cepat Langkah-langkah pengurangan:
- Tambah tetapan stop-loss dan mengambil keuntungan
- Pertimbangkan untuk menambah pengesahan penunjuk jumlah
- Penyesuaian ambang RSI dalam pasaran yang berbeza
Arahan pengoptimuman
- Memperkenalkan ambang RSI adaptif berdasarkan turun naik pasaran
- Masukkan penunjuk jumlah untuk pengesahan isyarat
- Membangunkan algoritma pengesanan perbezaan yang lebih tepat
- Tambahkan mekanisme pengurusan stop-loss dan keuntungan
- Pertimbangkan untuk menambah penapis turun naik pasaran
Ringkasan
Strategi ini membina sistem perdagangan yang agak lengkap dengan menggabungkan purata bergerak, penunjuk momentum, dan analisis perbezaan. Ia menekankan pengesahan isyarat berbilang untuk mengurangkan risiko pertimbangan palsu dengan berkesan. Walaupun terdapat beberapa kelewatan yang melekat, strategi ini mempunyai nilai praktikal melalui pengoptimuman parameter dan penambahbaikan pengurusan risiko.
/*backtest
start: 2024-12-10 00:00:00
end: 2025-01-08 08:00:00
period: 1h
basePeriod: 1h
exchanges: [{"eid":"Futures_Binance","currency":"BTC_USDT"}]
*/

//@version=5
strategy("EMA9_RSI_Strategy_LongShort", overlay=true)

// Parameters
fastLength = input.int(9, minval=1, title="Fast EMA Length")
slowLength = input.int(26, minval=1, title="Slow EMA Length")
rsiPeriod = input.int(14, minval=1, title="RSI Period")
rsiLevelLong = input.int(65, minval=1, title="RSI Level (Long)")
rsiLevelShort = input.int(35, minval=1, title="RSI Level (Short)")

// Define 1-hour timeframe
timeframe_1h = "60"

// Fetch 1-hour data
high_1h = request.security(syminfo.tickerid, timeframe_1h, high)
low_1h = request.security(syminfo.tickerid, timeframe_1h, low)
rsi_1h = request.security(syminfo.tickerid, timeframe_1h, ta.rsi(close, rsiPeriod))

// Current RSI
rsi = ta.rsi(close, rsiPeriod)

// Find highest/lowest price and corresponding RSI in the 1-hour timeframe
highestPrice_1h = ta.highest(high_1h, 1) // ราคาสูงสุดใน 1 ช่วงของ timeframe 1 ชั่วโมง
lowestPrice_1h = ta.lowest(low_1h, 1)   // ราคาต่ำสุดใน 1 ช่วงของ timeframe 1 ชั่วโมง
highestRsi_1h = ta.valuewhen(high_1h == highestPrice_1h, rsi_1h, 0)
lowestRsi_1h = ta.valuewhen(low_1h == lowestPrice_1h, rsi_1h, 0)

// Detect RSI Divergence for Long
bearishDivLong = high > highestPrice_1h and rsi < highestRsi_1h
bullishDivLong = low < lowestPrice_1h and rsi > lowestRsi_1h
divergenceLong = bearishDivLong or bullishDivLong

// Detect RSI Divergence for Short (switch to low price for divergence check)
bearishDivShort = low > lowestPrice_1h and rsi < lowestRsi_1h
bullishDivShort = high < highestPrice_1h and rsi > highestRsi_1h
divergenceShort = bearishDivShort or bullishDivShort

// Calculate EMA
emaFast = ta.ema(close, fastLength)
emaSlow = ta.ema(close, slowLength)

// Long Conditions
longCondition = emaFast > emaSlow and rsi > rsiLevelLong and not divergenceLong

// Short Conditions
shortCondition = emaFast < emaSlow and rsi < rsiLevelShort and not divergenceShort

// Plot conditions
plotshape(longCondition, title="Buy", location=location.belowbar, color=color.green, style=shape.labelup, text="Buy")
plotshape(shortCondition, title="Sell", location=location.abovebar, color=color.red, style=shape.labeldown, text="Sell")

// Execute the strategy
if (longCondition)
    strategy.entry("Long", strategy.long, comment="entry long")

if (shortCondition)
    strategy.entry("Short", strategy.short, comment="entry short")

// Alert
alertcondition(longCondition, title="Buy Signal", message="Buy signal triggered!")
alertcondition(shortCondition, title="Sell Signal", message="Sell signal triggered!")
- RSI Multi-Periode Momentum dan Tren EMA Tiga Berikutan Strategi Komposit
- Dual Exponential Moving Average dan Indeks Kekuatan Relatif Crossover Strategy
- Trend Purata Bergerak Dinamik Mengikuti dengan RSI Strategi Perdagangan Pengesahan
- Pencari rendah
- EMA Crossover Fibonacci Reversal Strategi
- EMA, RSI, Trend Harga Volume, corak meluap
- EMA Bullish Crossover Strategi
- Strategi Dagangan Momentum RSI-EMA Berbilang Jangka Masa dengan Scaling Posisi
- Sistem Dagangan Pembalikan Trend Momentum RSI Dual EMA - Strategi Terobosan Momentum Berdasarkan EMA dan RSI Crossover
- Strategi Dagangan Kuantitatif Berbilang Tempoh yang Dinamis Menggabungkan RSI dan EMA
- Strategi Momentum Trend Harga-Jumlah yang Dipertingkatkan
- Strategi silang purata bergerak pintar dengan sistem pengurusan keuntungan / kerugian dinamik
- Strategi Dagangan Penembusan Multi-MA
- Adaptive Momentum Mean-Reversion Crossover Strategy
- Sistem Dagangan Trend EMA Beradaptif Dua Arah dengan Strategi Optimum Dagangan Berbalik
- Sistem Dagangan Pullback EMA Dual dengan Optimisasi Stop-Loss Dinamik berasaskan ATR
- Perpindahan fasa berbilang tempoh dengan EMA Trend Following Strategy
- Trend silang purata bergerak berbilang mengikut strategi osilasi RSI
- Strategi Penembusan Trend Bollinger Bands Berbilang Tempoh dengan Model Kawalan Risiko Volatiliti
- Strategi Dagangan Pivot Beradaptasi Sokongan dan Rintangan Dinamik
- Strategi Perdagangan Piramida Dinamik Supertrend Berbilang Tempoh
- Strategi Kuantitatif Melalui SMA Trend Jangka Panjang
- Trend Penggabungan Indikator Multi-Teknikalan Berikutan Strategi Dagangan Kuantitatif
- Indikator Multi-Teknik Momentum-MA Trend Mengikut Strategi
- Sistem Dagangan Crossover Triple EMA dengan Pengurusan Stop Loss berasaskan Smart R2R
- Strategi Kuantitatif EMA Rentas Frekuensi Tinggi Dinamis yang Dikendalikan oleh Volatiliti
- Strategi Dagangan Pembalikan Momentum Indikator Teknikal Berganda dengan Sistem Pengurusan Risiko
- Strategi Dagangan Kuantitatif Berbilang Jangka Masa Berdasarkan EMA-Smoothed RSI dan ATR Dynamic Stop-Loss/Take-Profit
- Analisis Strategi Fibonacci Bollinger Bands yang Sesuai
- Strategi Perdagangan corak candlestick pelbagai jangka masa