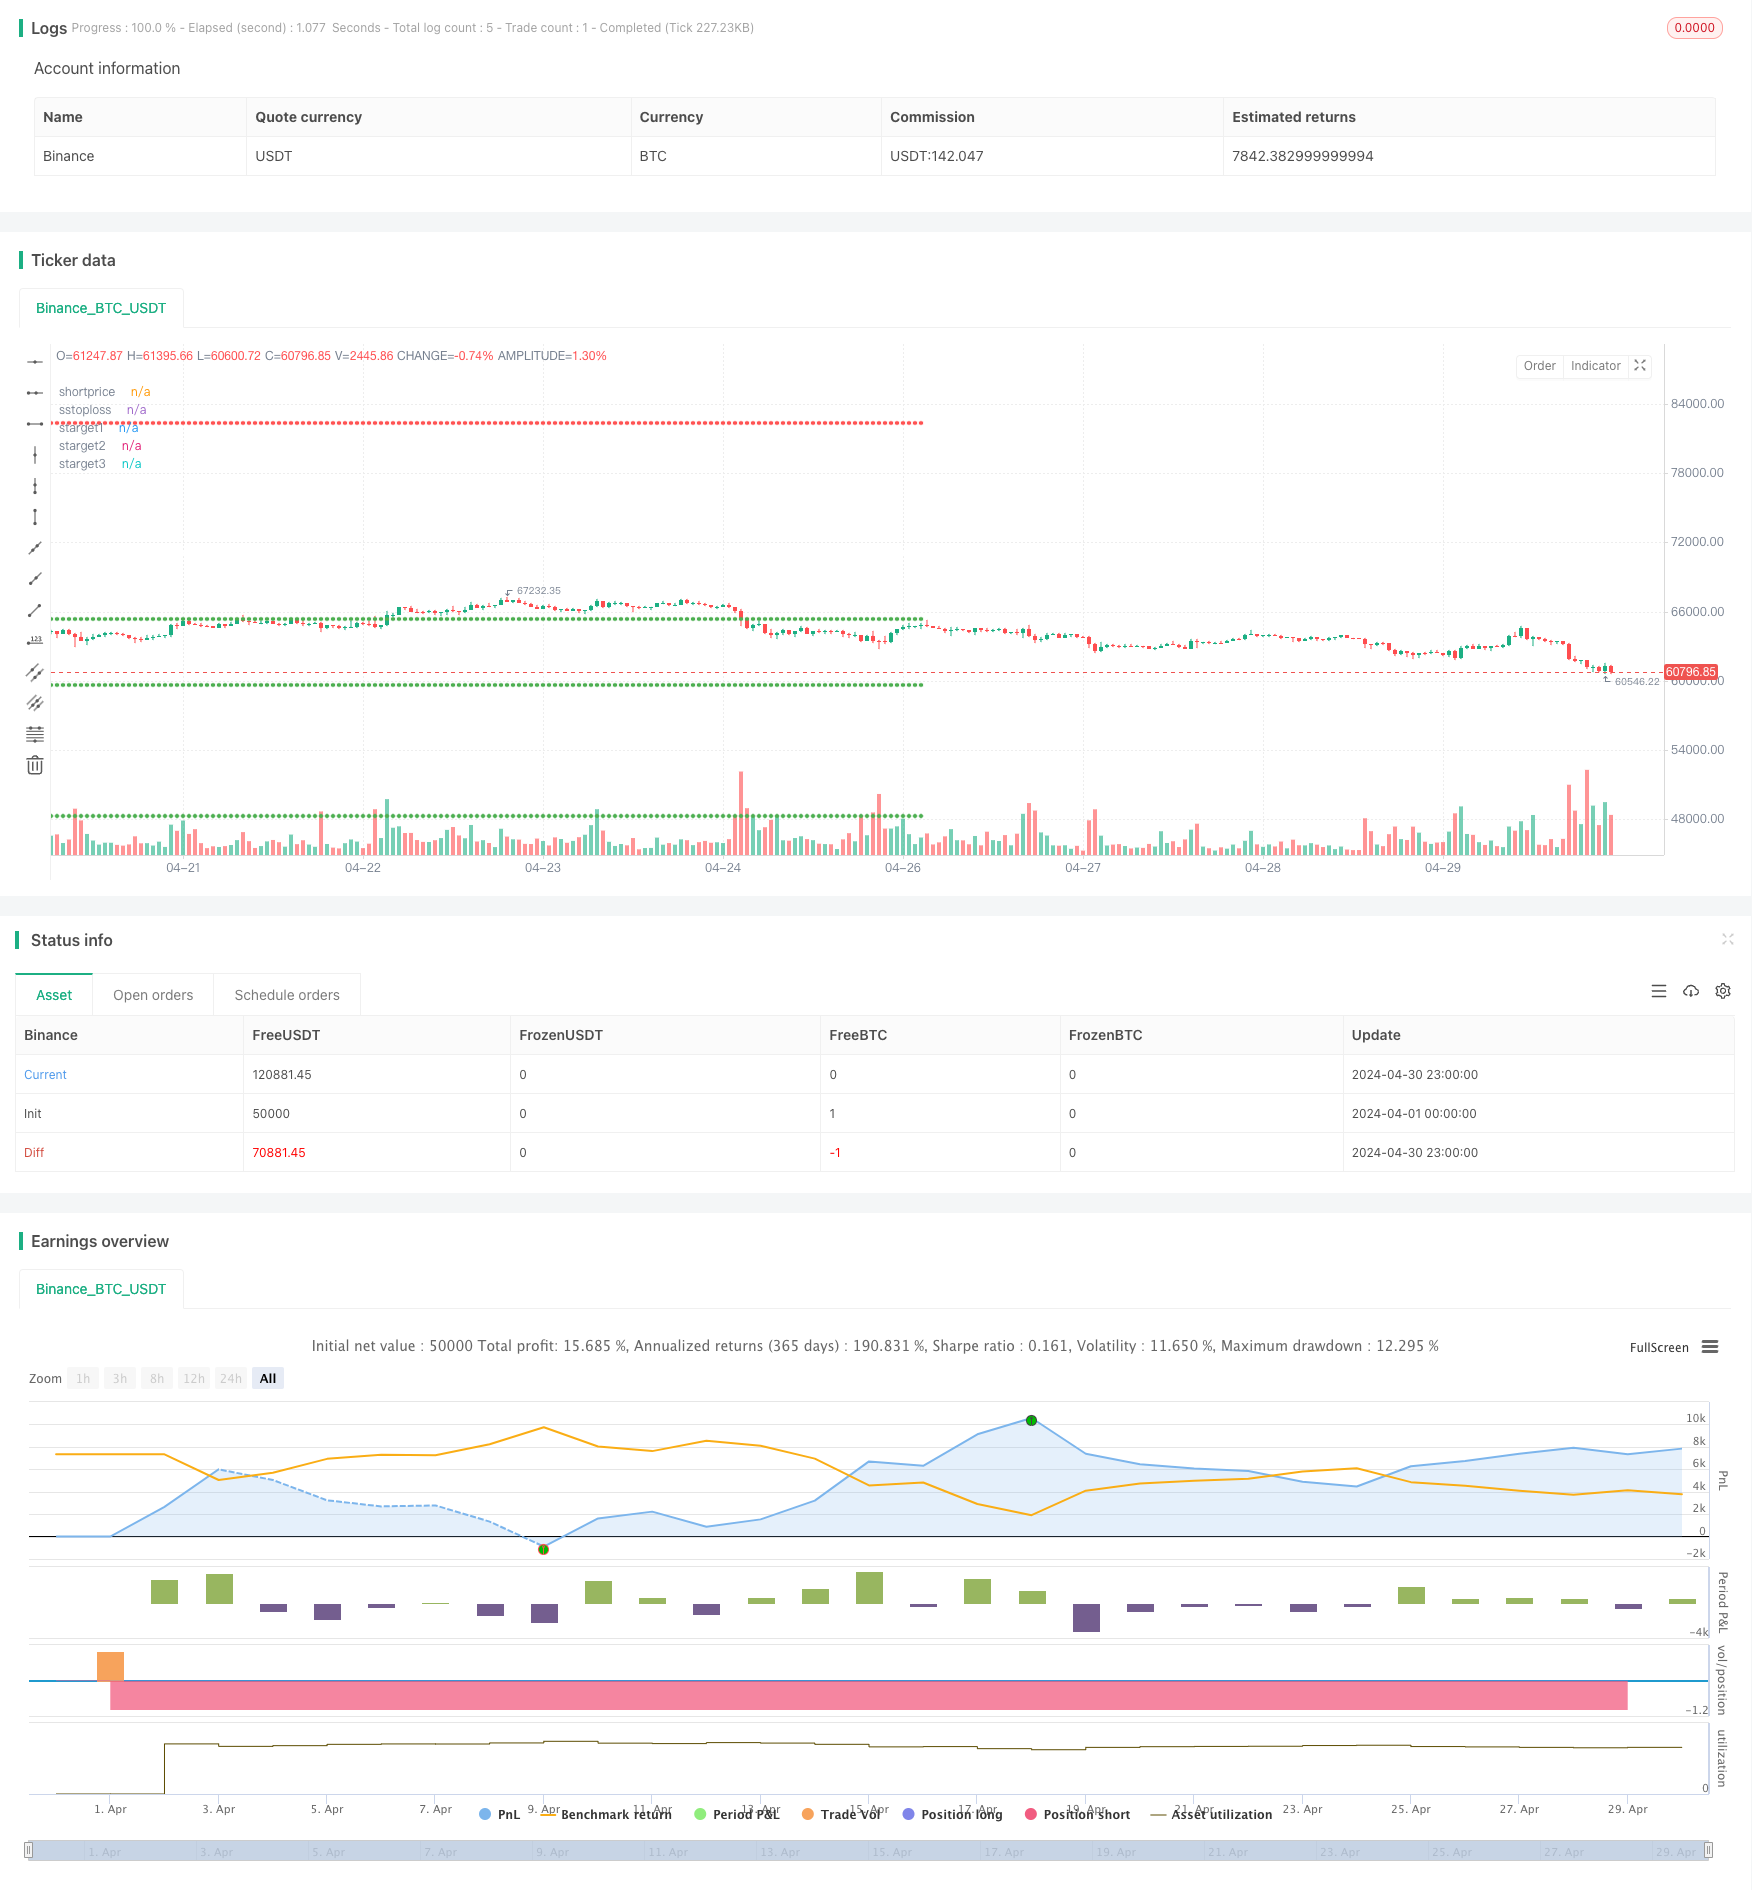
Visão geral
A estratégia de quantificação utiliza principalmente o sinal de cruzamento do indicador SAR paralelo (PSAR) e da média móvel do índice (EMA), em combinação com várias condições personalizadas, para produzir sinais de compra e venda. A principal idéia da estratégia é: quando o PSAR quebra a EMA a partir da parte inferior e satisfaz certas condições, produz um sinal de compra; quando o PSAR quebra a EMA a partir da parte superior e satisfaz certas condições, produz um sinal de venda.
Princípio da estratégia
- Calculação do PSAR e do EMA de 30 ciclos
- Determinar a relação entre o PSAR e o EMA e definir o ponto de referência correspondente
- Combinação de condições como a relação entre a posição do PSAR e a do EMA, a cor da linha K, para definir o IGC (Ideal Green Candle) e o IRC (Ideal Red Candle)
- O surgimento do IGC e do IRC para julgar os sinais de compra e venda
- Configurar stop-loss e stop-loss, com stop-loss de 8%, 16% e 32% do preço de compra e 16% do preço de venda, respectivamente; stop-loss de 8%, 16% e 32% do preço de venda e 16% do preço de venda
- Execução de operações de compra, venda ou liquidação, de acordo com o momento da transação e o estado da posição
Vantagens estratégicas
- A combinação de vários indicadores e condições aumenta a confiabilidade do sinal
- Múltiplos pontos de parada e de perda para controlar o risco e o lucro com flexibilidade
- Filtragem de compra e venda para diferentes condições de mercado, aumentando a adaptabilidade da estratégia
- Código altamente modular, fácil de entender e modificar
Risco estratégico
- A configuração de parâmetros da estratégia pode não ser adequada para todos os cenários de mercado e precisa ser ajustada de acordo com a realidade
- Em mercados turbulentos, a estratégia pode levar a sinais de negociação frequentes, o que aumenta os custos de negociação.
- A estratégia não tem discernimento sobre as tendências do mercado e pode perder oportunidades em mercados de forte tendência
- A configuração de stop loss pode não evitar completamente os riscos de eventos extremos
Direção de otimização da estratégia
- A introdução de mais indicadores técnicos ou de sentimento de mercado para aumentar a precisão e a confiabilidade dos sinais
- Optimizar a configuração do ponto de paragem e parada, pode considerar a introdução de paragem de parada dinâmica ou parada de parada baseada na taxa de flutuação
- Adaptabilidade de estratégias para diferentes condições de mercado, com diferentes parâmetros e regras de negociação
- Adição de módulos de gestão de fundos, ajustamento dinâmico de posições e exposição ao risco com base em fatores como equity ratio balance da conta
Resumir
A estratégia quantitativa é baseada nos indicadores PSAR e EMA, gerando sinais de compra e venda através de várias condições e regras personalizadas. A estratégia possui uma certa adaptabilidade e flexibilidade, além de estabelecer um ponto de parada para controlar o risco. No entanto, há espaço para otimização na configuração de parâmetros e controle de risco da estratégia.
/*backtest
start: 2024-04-01 00:00:00
end: 2024-04-30 23:59:59
period: 1h
basePeriod: 15m
exchanges: [{"eid":"Binance","currency":"BTC_USDT"}]
*/

// This Pine Script™ code is subject to the terms of the Mozilla Public License 2.0 at https://mozilla.org/MPL/2.0/
// © SwapnilRaykar

//@version=5
strategy("aj sir second project", overlay=true, margin_long=100, margin_short=100)

start=input("0915-1515","session time")
st11=time(timeframe.period,start)
st=st11>0
et= not st

psar=ta.sar(0.02,0.02,0.2)
emared=ta.ema(close,30)
//plot(psar,"psar",color.yellow,style = plot.style_cross)
//plot(emared,"emared",color.red)
var crodownflag=0
var croupflag=0

var igcflag=0

var ircflag=0

cdown1=ta.crossunder(psar,emared)  and not (psar<close and psar[1]>close[1])
cup1=ta.crossover(psar,emared) and not (psar>close and psar[1]<close[1])

cdown=ta.crossunder(psar,emared)
cup=ta.crossover(psar,emared)


green_candle=close>open
red_candle=close<open

if ta.crossunder(psar,emared) and crodownflag==0  and not (psar<close and psar[1]>close[1])
    crodownflag:=1
else if cdown and crodownflag==1
    crodownflag:=0


if crodownflag==1 and green_candle and igcflag==0
    igcflag:=1
else if cdown and igcflag==1
    igcflag:=0

//plot(igcflag,"igcflag",color.lime)

if ta.crossover(psar,emared) and croupflag==0 and not (psar>close and psar[1]<close[1])
    croupflag:=1
else if cdown and croupflag==1
    croupflag:=0

//plot(crodownflag,"crodownflag",color.white)
irc_cond=croupflag==1 or cup

if (croupflag==1 and red_candle and ircflag==0)
    ircflag:=1
else if cup and croupflag==1
    ircflag:=0

igc_candle1=(igcflag==1 and igcflag[1]==0) or (cdown1 and green_candle)
irc_candle1=(ircflag==1 and ircflag[1]==0) or (cup1 and red_candle)
///////////////////////////
dm=dayofmonth(time)
newday=dm!=dm[1]
dmc=dm==ta.valuewhen(bar_index==last_bar_index,dm,0)

///////////////////////////////////////////
var irc_there=0

if irc_candle1[1] and irc_there==0
    irc_there:=1
else if cdown and irc_there==1
    irc_there:=0

irc_candle=irc_candle1 and irc_there==0// and dmc

var igc_there=0

if igc_candle1[1] and igc_there==0
    igc_there:=1
else if cup and igc_there ==1
    igc_there:=0

igc_candle=igc_candle1 and igc_there==0// and dmc
/////////// to get rid of irc being valid even after crossdown
var valid_igc_low=0
var valid_irc_high=0

if irc_candle[1] and valid_irc_high==0
    valid_irc_high:=1
else if igc_candle and valid_irc_high==1
    valid_irc_high:=0

if igc_candle and valid_igc_low==0
    valid_igc_low:=1
else if irc_candle and valid_igc_low==1
    valid_igc_low:=0


igc_low=ta.valuewhen(igc_candle,low,0)
irc_high=ta.valuewhen(irc_candle,high,0)
//////////////////////////////
//plot(irc_high,"irc_high",color.red)

//plot(valid_irc_high,"valid_irc_high",color.purple)

buy12=ta.crossunder(close,igc_low) and valid_igc_low==1
buy1=buy12[1]

short12=ta.crossover(close,irc_high) and valid_irc_high==1
short1=short12[1]
//plotshape(short12,"short12",shape.arrowdown,color=color.purple)

// plotshape(igc_candle,"igc_candle",shape.arrowdown,color=color.green)
// plotshape(irc_candle,"irc_candle",shape.arrowdown,color=color.red)
//plotshape((psar<close and psar[1]>close[1]) ,"croup",shape.arrowdown,color=color.red)
//plotshape(cup ,"croup",shape.arrowdown,color=color.orange)

buyprice=ta.valuewhen(buy1 and strategy.position_size[1]==0,open,0)
shortprice=ta.valuewhen(short1 and strategy.position_size[1]==0,open,0)

btarget1=buyprice+(buyprice*0.08)
btarget2=buyprice+(buyprice*0.16)
btarget3=buyprice+(buyprice*0.32)
bstoploss=buyprice-(buyprice*0.16)

starget1=shortprice-(shortprice*0.08)
starget2=shortprice-(shortprice*0.16)
starget3=shortprice-(shortprice*0.32)
sstoploss=shortprice+(shortprice*0.16)

if buy12 and strategy.position_size==0 and st11
    strategy.entry("buy",strategy.long)

if strategy.position_size >0
    strategy.exit("sell",from_entry = "buy",stop=bstoploss,limit=btarget3)

if short12 and strategy.position_size==0 and st11
    strategy.entry("short",strategy.short)

if strategy.position_size<0
    strategy.exit("cover",from_entry = "short",stop = sstoploss,limit = starget3)

if et
    strategy.close_all(comment = "timeover")

plot(strategy.position_size>0?buyprice:na,"buyprice",color.white, style=plot.style_circles )
plot(strategy.position_size>0?bstoploss:na,"bstoploss",color.red, style=plot.style_circles )
plot(strategy.position_size>0?btarget1:na,"btarget1",color.green, style=plot.style_circles )
plot(strategy.position_size>0?btarget2:na,"btarget2",color.green, style=plot.style_circles )
plot(strategy.position_size>0?btarget3:na,"btarget3",color.green, style=plot.style_circles )

plot(strategy.position_size<0?shortprice:na,"shortprice",color.white, style=plot.style_circles )
plot(strategy.position_size<0?sstoploss:na,"sstoploss",color.red, style=plot.style_circles )
plot(strategy.position_size<0?starget1:na,"starget1",color.green, style=plot.style_circles )
plot(strategy.position_size<0?starget2:na,"starget2",color.green, style=plot.style_circles )
plot(strategy.position_size<0?starget3:na,"starget3",color.green, style=plot.style_circles )