三重指数移动平均线与支撑阻力动态交易策略
Author: ChaoZhang, Date: 2024-07-31 11:58:57Tags: EMA
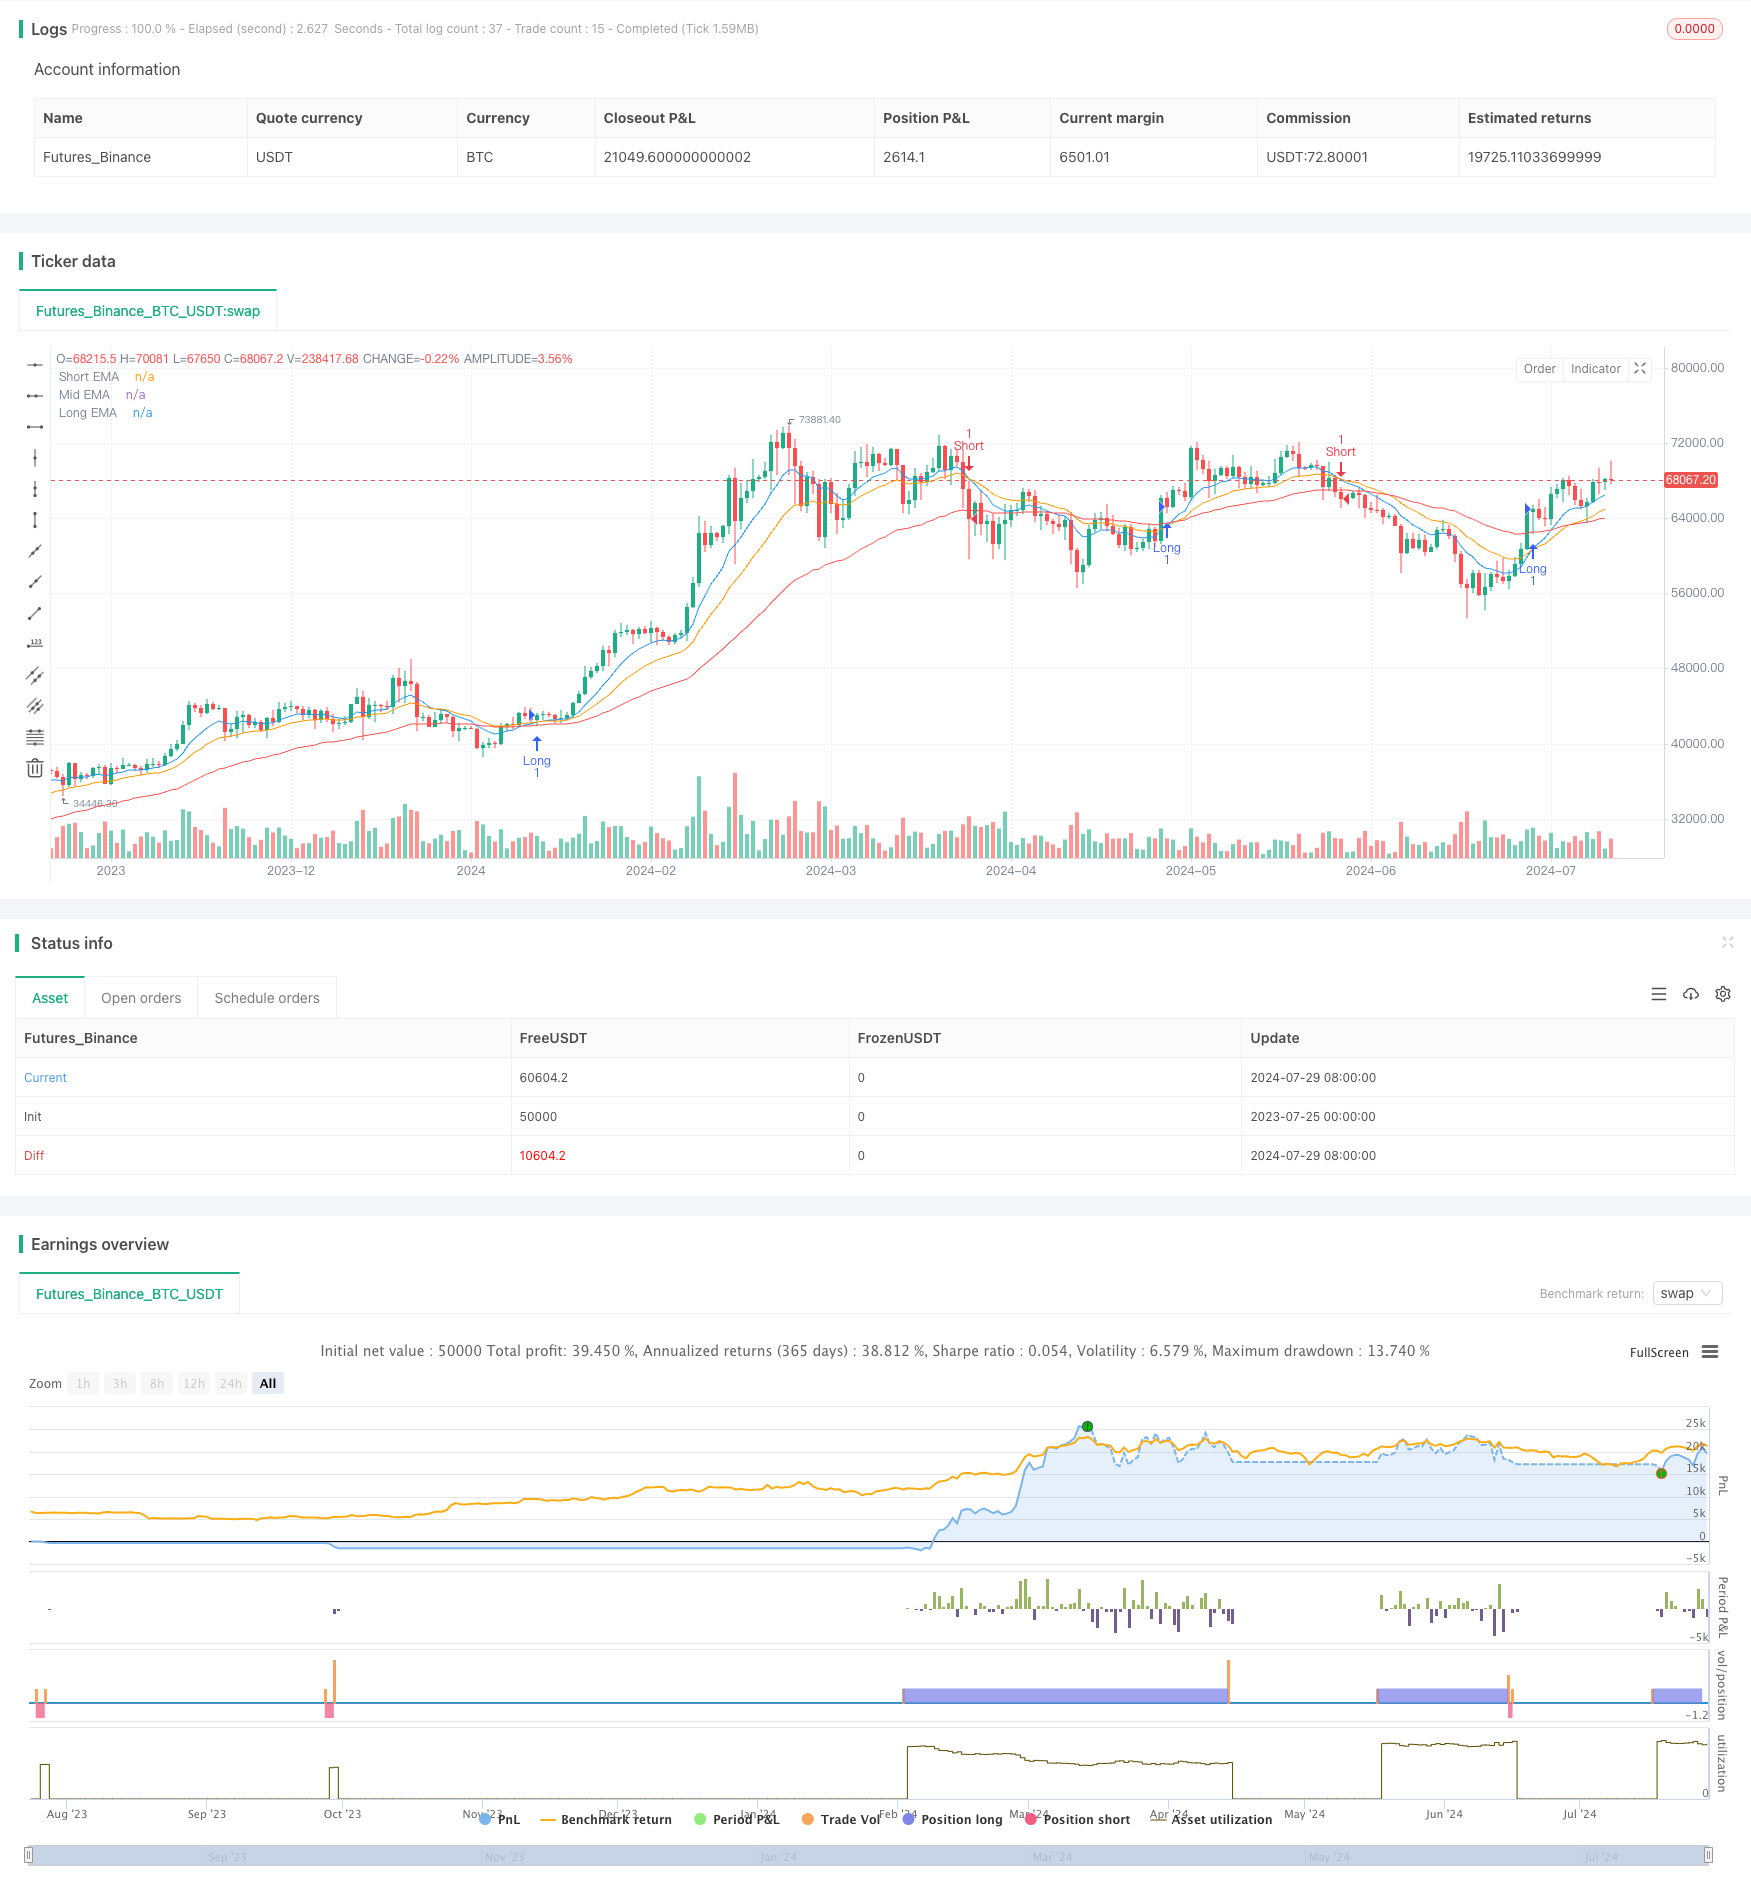
概述
三重指数移动平均线与支撑阻力动态交易策略是一种结合了多重技术指标的量化交易方法。该策略利用三条不同周期的指数移动平均线(EMA)来判断市场趋势,同时结合动态支撑和阻力水平来优化入场时机。此外,策略还设置了止损和止盈机制,以控制风险和锁定利润。这种多维度的分析方法旨在提高交易的准确性和盈利能力。
策略原理
三重EMA交叉:
- 短期EMA(10周期)与中期EMA(20周期)的交叉用于产生交易信号。
- 长期EMA(50周期)用于确认整体趋势方向。
动态支撑阻力:
- 系统动态识别20个周期内的最高价和最低价,作为实时的阻力和支撑水平。
入场条件:
- 做多条件:短期EMA上穿中期EMA,且收盘价高于长期EMA和支撑水平。
- 做空条件:短期EMA下穿中期EMA,且收盘价低于长期EMA和阻力水平。
风险管理:
- 设置基于百分比的止损和止盈水平,分别为入场价格的1%和2%。
策略优势
多重确认机制:通过结合多个技术指标,提高了交易信号的可靠性。
趋势跟踪:利用长期EMA确保交易方向与主要趋势一致。
动态支撑阻力:实时调整的支撑阻力水平提供了更准确的市场结构洞察。
风险控制:预设的止损和止盈机制有助于管理每笔交易的风险和收益。
灵活性:策略参数可根据不同市场和时间框架进行调整。
策略风险
震荡市场表现:在横盘或震荡市场中,可能会产生频繁的虚假信号。
滞后性:EMA作为滞后指标,可能在快速反转的市场中反应不及时。
固定百分比止损:在波动性较大的市场中,固定百分比的止损可能过于紧密。
过度依赖技术指标:忽视了基本面因素和市场情绪的影响。
参数敏感性:策略性能可能对EMA周期和止损止盈百分比的选择高度敏感。
策略优化方向
引入波动性调整:
- 考虑使用ATR(平均真实范围)来动态调整止损和止盈水平,以适应不同的市场波动状况。
增加趋势强度过滤:
- 引入ADX(平均方向指数)等指标,只在趋势强度足够时才开仓,减少震荡市场中的虚假信号。
优化支撑阻力识别:
- 考虑使用更复杂的支撑阻力识别算法,如基于分形理论或供需区域的方法。
加入成交量分析:
- 结合成交量指标,如OBV(能量潮)或CMF(资金流量指标),以确认价格移动的有效性。
实现动态参数优化:
- 开发自适应机制,根据近期市场表现自动调整EMA周期和其他参数。
考虑多时间框架分析:
- 引入更长时间周期的趋势确认,以提高交易方向的准确性。
整合市场情绪指标:
- 加入VIX等波动性指数或情绪指标,以更好地捕捉市场转折点。
总结
三重指数移动平均线与支撑阻力动态交易策略是一个综合性的技术分析交易系统,它通过多重指标的结合来识别潜在的交易机会。该策略的核心优势在于其多维度的市场分析方法,包括趋势跟踪、动态支撑阻力和风险管理。然而,像所有的交易策略一样,它也面临着一些固有的风险和局限性。
通过建议的优化方向,如引入波动性调整、增加趋势强度过滤和优化支撑阻力识别等,可以进一步提升策略的稳健性和适应性。特别是,考虑市场波动性和多时间框架分析可能会显著改善策略在不同市场条件下的表现。
最终,成功应用这一策略需要交易者持续监控和调整,以适应不断变化的市场环境。通过细致的回测和前瞻性的优化,这个策略有潜力成为一个可靠的交易工具,为量化交易者提供有价值的市场洞察和交易机会。
/*backtest
start: 2023-07-25 00:00:00
end: 2024-07-30 00:00:00
period: 1d
basePeriod: 1h
exchanges: [{"eid":"Futures_Binance","currency":"BTC_USDT"}]
*/

// This Pine Script™ code is subject to the terms of the Mozilla Public License 2.0 at https://mozilla.org/MPL/2.0/
// © AnubhavKumar

//@version=5
strategy("3 EMA Strategy with Support/Resistance", overlay=true)

// Input parameters
emaShortPeriod = input.int(10, title="Short EMA Period")
emaMidPeriod = input.int(20, title="Mid EMA Period")
emaLongPeriod = input.int(50, title="Long EMA Period")
stopLossPercent = input.float(1.0, title="Stop Loss (%)", minval=0.0, step=0.1)
targetProfitPercent = input.float(2.0, title="Target Profit (%)", minval=0.0, step=0.1)

// Calculate EMAs
emaShort = ta.ema(close, emaShortPeriod)
emaMid = ta.ema(close, emaMidPeriod)
emaLong = ta.ema(close, emaLongPeriod)

// Support and Resistance levels
var float supportLevel = na
var float resistanceLevel = na

if ta.lowest(close, 20) == close
    supportLevel := close

if ta.highest(close, 20) == close
    resistanceLevel := close

// Plot EMAs
plot(emaShort, color=color.blue, title="Short EMA")
plot(emaMid, color=color.orange, title="Mid EMA")
plot(emaLong, color=color.red, title="Long EMA")

// Plot dynamic support and resistance levels
// var line supportLine = na
// var line resistanceLine = na

// if not na(supportLevel)
    // line.delete(supportLine)
    // supportLine := line.new(x1=bar_index, y1=supportLevel, x2=bar_index[1], y2=supportLevel, color=color.green, width=2)

// if not na(resistanceLevel)
    // line.delete(resistanceLine)
    // resistanceLine := line.new(x1=bar_index, y1=resistanceLevel, x2=bar_index[1], y2=resistanceLevel, color=color.red, width=2)

// Define strategy logic
longCondition = ta.crossover(emaShort, emaMid) and close > emaLong and close > supportLevel
shortCondition = ta.crossunder(emaShort, emaMid) and close < emaLong and close < resistanceLevel

if (longCondition)
    strategy.entry("Long", strategy.long)
    stopLossPrice = close * (1 - stopLossPercent / 100)
    takeProfitPrice = close * (1 + targetProfitPercent / 100)
    strategy.exit("Take Profit/Stop Loss", "Long", stop=stopLossPrice, limit=takeProfitPrice)

if (shortCondition)
    strategy.entry("Short", strategy.short)
    stopLossPrice = close * (1 + stopLossPercent / 100)
    takeProfitPrice = close * (1 - targetProfitPercent / 100)
    strategy.exit("Take Profit/Stop Loss", "Short", stop=stopLossPrice, limit=takeProfitPrice)
- 多维度趋势判断与ATR动态止盈止损策略
- 高级多指标趋势确认交易策略
- 自适应趋势跟踪与多重确认交易策略
- 动态均线系统结合RSI动量指标的日内交易优化策略
- 多重技术指标交叉动量趋势跟踪策略
- EMA趋势结合轮回位突破交易策略
- 多均线交叉辅助RSI动态参数量化交易策略
- 动态趋势判定RSI指标交叉策略
- 双重交叉趋势追踪策略:指数均线与MACD协同交易系统
- 多指标多维度趋势交叉高级量化策略
- 多重平滑均线动态交叉趋势跟踪与多重确认量化交易策略
- 动态支撑阻力突破均线交叉策略
- 动态趋势追踪与精准止盈止损策略
- 一目均衡图趋势跟踪与支撑阻力策略
- 布林带均值回归交易策略与动态支撑
- 早晨蜡烛突破与反转策略
- 基于斐波那契回撤的自适应趋势跟踪策略
- 高级马尔可夫模型技术指标融合交易策略
- 多层波动带交易策略
- 多周期均线交叉与波动率过滤动态策略
- 多重指标综合动量交易策略
- 双重RSI策略:结合背离与交叉的高级趋势捕捉系统
- 基于洛伦兹分类法的多时间框架交易策略
- 双均线趋势捕捉策略结合动态止损和过滤器
- 多指标趋势跟踪与成交量确认策略
- 双均线交叉带止盈止损的自适应量化交易策略
- 基于艾略特波浪与汤姆·德马克顺势交易策略
- 基于量化动量和收敛发散的多时间框架统一策略
- RSI超卖定期投资策略与冷却期优化
- HMA优化多周期量化交易策略与动态止损结合
- 布林带交叉与滑点价格影响组合策略