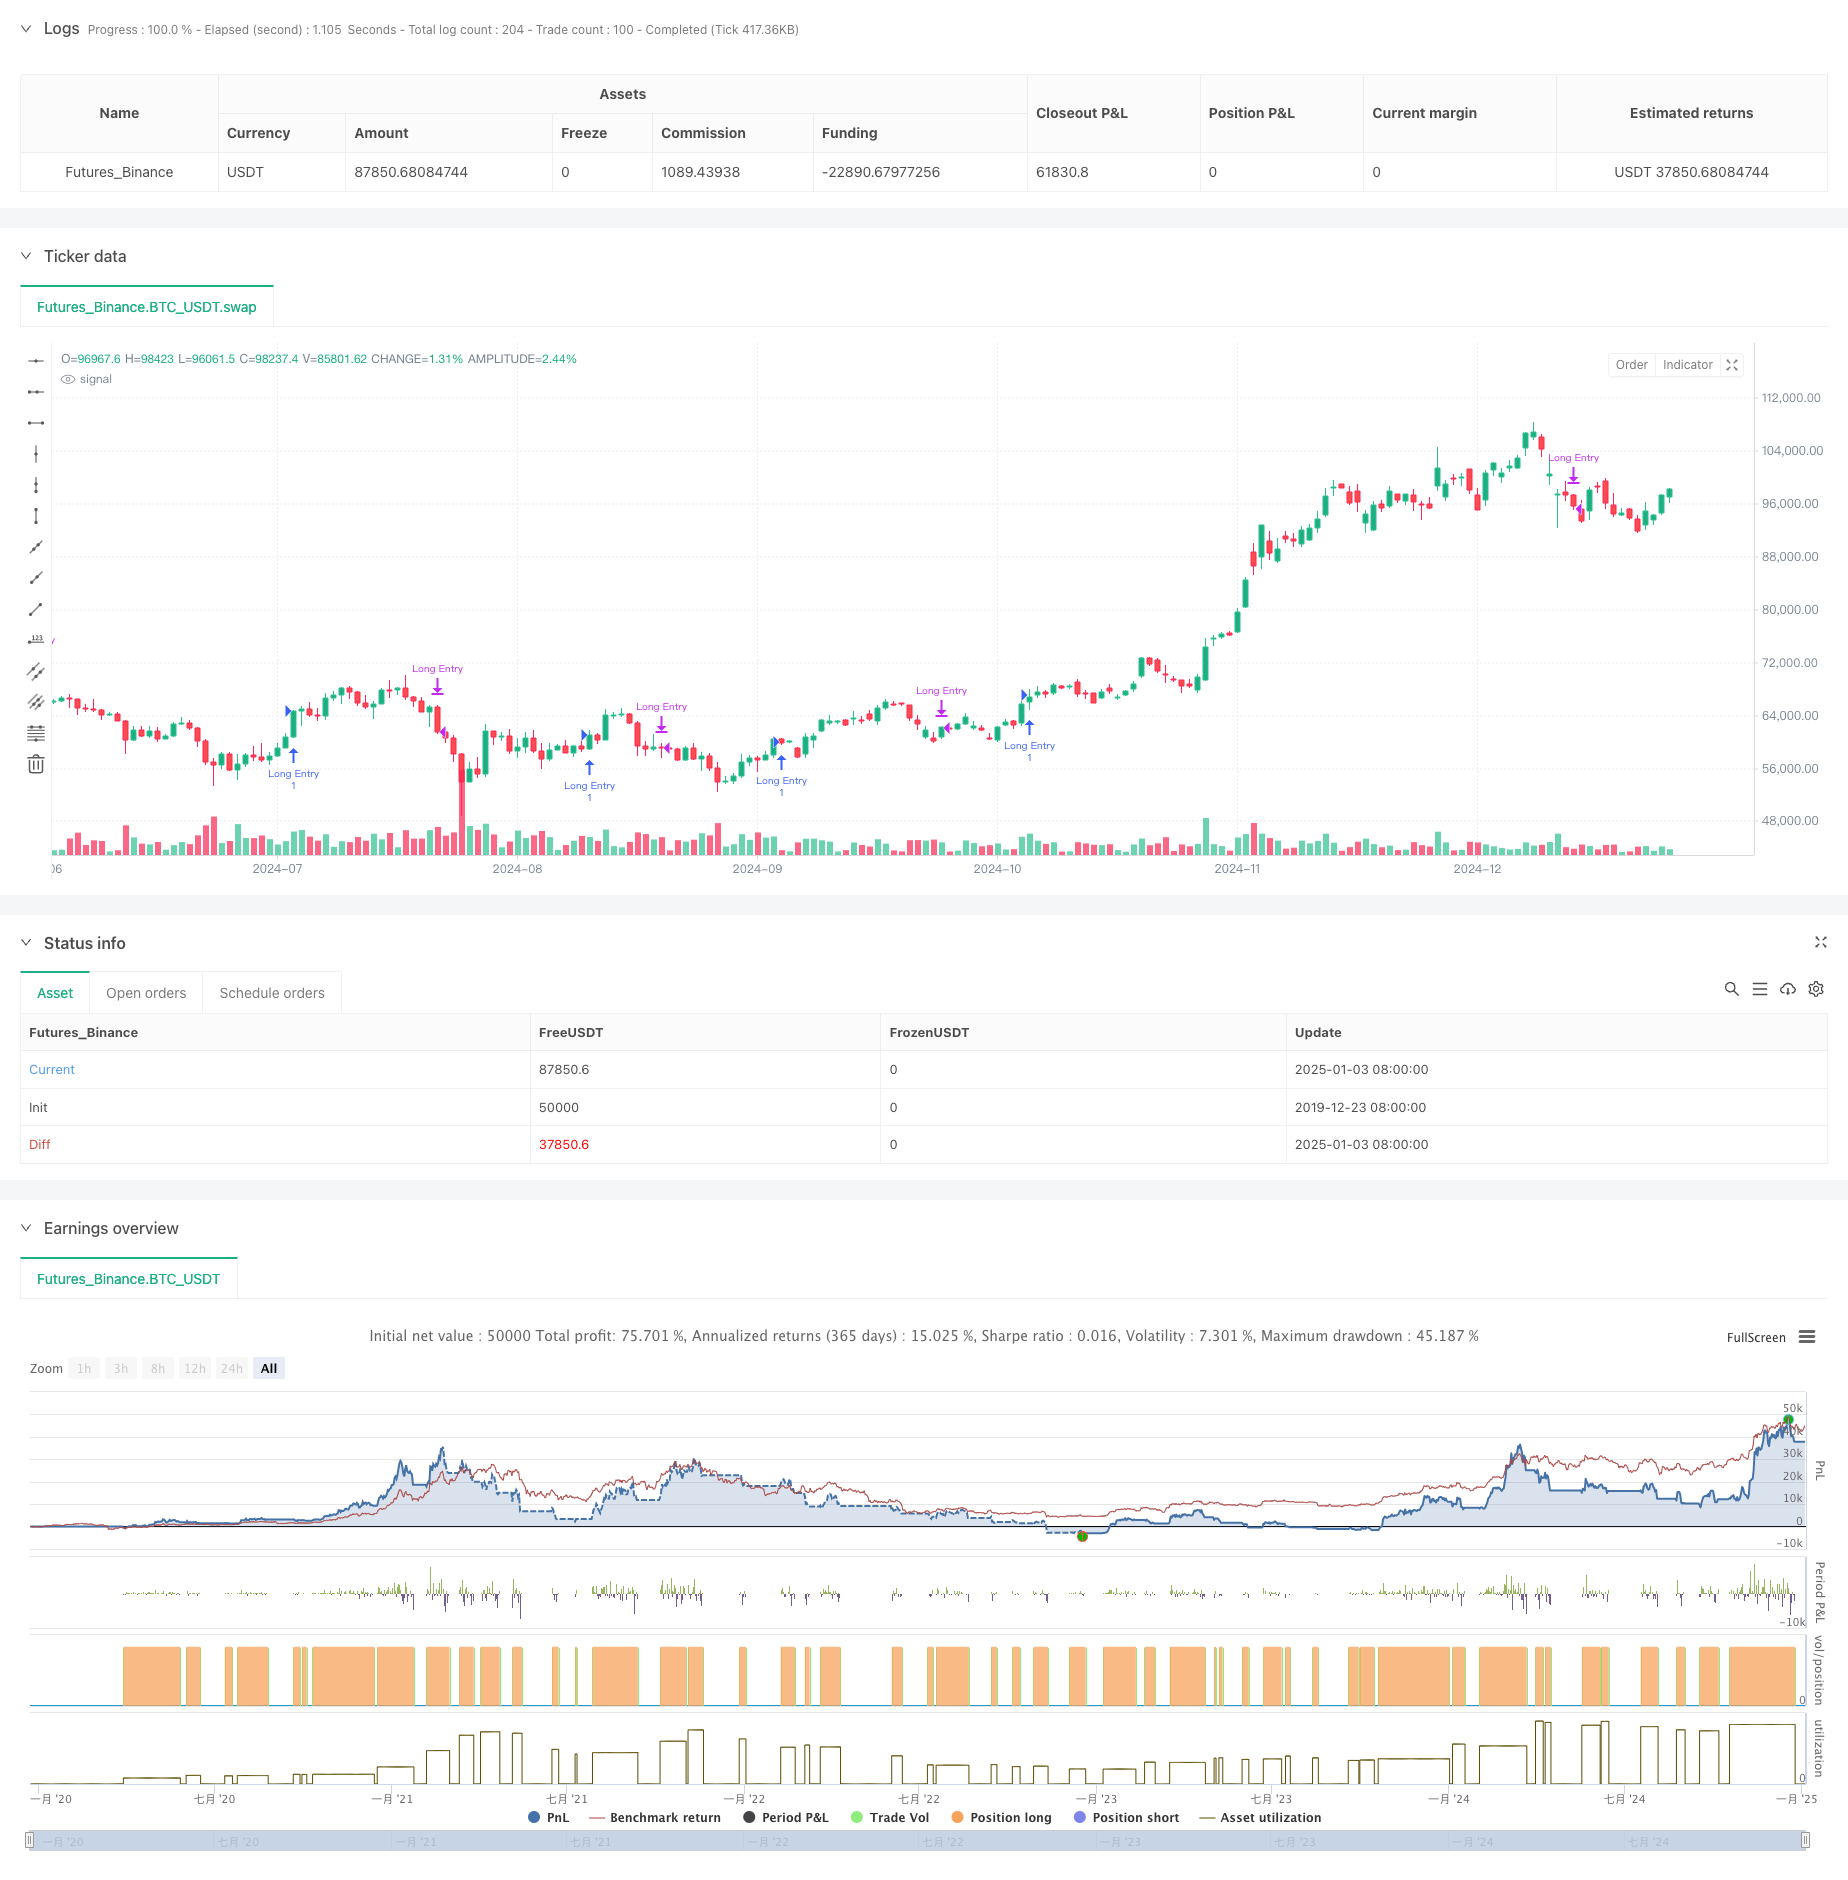
Visão geral
A estratégia é um sistema de negociação quantitativa baseado em sinais de cruzamento de média móvel simples (SMA) multiperíodo. Ele é negociado principalmente identificando oportunidades de recuo de curto prazo dentro de uma tendência de alta de longo prazo. A estratégia usa indicadores SMA com cinco períodos de 5 dias, 10 dias, 20 dias, 60 dias e 120 dias para julgar tendências de mercado e oportunidades de negociação por meio do relacionamento de posição e sinais de cruzamento das médias móveis.
Princípio da estratégia
A lógica central da estratégia inclui as seguintes partes principais:
- A tendência de longo prazo pode ser julgada pela relação de posição relativa entre SMA20 e SMA60. Quando SMA20 está acima de SMA60, é confirmado que o mercado está em uma tendência ascendente.
- Com a premissa de confirmar a tendência de alta de longo prazo, um sinal de compra é acionado quando a SMA5 de curto prazo se recupera de abaixo da SMA20 para acima. Isso sugere que o mercado está se recuperando após uma retração de curto prazo em uma tendência de alta.
- Quando a SMA20 cruza a SMA5, um sinal de fechamento é acionado. Isso indica que o impulso ascendente de curto prazo enfraqueceu e pode entrar em um período de ajuste.
- A estratégia também inclui uma função de filtro de tempo, que pode limitar o intervalo de tempo do backtest e aumentar a flexibilidade da estratégia.
Vantagens estratégicas
- A lógica da estratégia é clara e simples, fácil de entender e implementar, e não envolve processos de cálculo complexos.
- Ao usar várias médias móveis de período em coordenação, podemos filtrar efetivamente o ruído do mercado e melhorar a confiabilidade dos sinais de negociação.
- A estratégia se concentra em oportunidades de retração em mercados de tendência, o que está alinhado com o conceito central de “negociação de tendências”.
- Usar SMA em vez de EMA reduz a sensibilidade às mudanças de preço e reduz sinais falsos.
- A lógica de entrada e saída é clara, o que facilita a execução e o controle de riscos.
Risco estratégico
- O sistema de média móvel tem atrasos, o que pode levar a tempos de entrada e saída abaixo do ideal.
- Em um mercado volátil, cruzamentos frequentes de médias móveis podem gerar muitos sinais falsos.
- A estratégia não possui um mecanismo de filtragem de volatilidade e pode enfrentar maiores riscos de redução durante períodos de alta volatilidade.
- Sem considerar a cooperação de outros indicadores técnicos, como volume de negociação, a confiabilidade do sinal precisa ser melhorada.
- Parâmetros de média móvel fixa podem não ser adequados para todos os ambientes de mercado.
Direção de otimização da estratégia
- Apresente o indicador ATR para filtragem de volatilidade e evite negociar quando a volatilidade estiver muito alta.
- Adicione um mecanismo de confirmação de volume para melhorar a confiabilidade dos sinais de negociação.
- Desenvolver um mecanismo de ciclo de média móvel adaptável para permitir que a estratégia se adapte melhor a diferentes ambientes de mercado.
- Adicione um filtro de força de tendência, como o indicador ADX, para garantir a negociação em tendências fortes.
- Melhore o mecanismo de stop-loss, como adicionar um trailing stop, para controlar melhor os riscos.
Resumir
Esta estratégia usa médias móveis SMA multiperíodo para construir um sistema de negociação que se concentra em capturar oportunidades de retração em tendências ascendentes de longo prazo. O desenho da estratégia é conciso e prático, com boa compreensibilidade e implementabilidade. Com a introdução de medidas de otimização, como filtragem de volatilidade e confirmação de volume, espera-se que a robustez e a confiabilidade da estratégia sejam ainda mais aprimoradas.
/*backtest
start: 2019-12-23 08:00:00
end: 2025-01-04 08:00:00
period: 1d
basePeriod: 1d
exchanges: [{"eid":"Futures_Binance","currency":"BTC_USDT"}]
*/

//@version=6
strategy("Long-Term Growing Stock Strategy", overlay=true)
// Date Range
// STEP 1. Create inputs that configure the backtest's date range
useDateFilter = input.bool(true, title="Filter Date Range of Backtest",group="Backtest Time Period")
backtestStartDate = input(timestamp("1 Jan 2014"),title="Start Date", group="Backtest Time Period",tooltip="This start date is in the time zone of the exchange " + "where the chart's instrument trades. It doesn't use the time " +"zone of the chart or of your computer.")
backtestEndDate = input(timestamp("31 Dec 2024"), title="End Date", group="Backtest Time Period")
// STEP 2. See if current bar falls inside the date range
inTradeWindow = true


// Calculate EMAs
// ema20 = ta.ema(close, ema20_length)
// ema60 = ta.ema(close, ema60_length)
// ema120 = ta.ema(close, ema120_length)
sma5 = ta.sma(close, 5)
sma10 = ta.sma(close, 10)
sma20 = ta.sma(close, 20)
sma60 = ta.sma(close, 60)
sma120 = ta.sma(close, 120)

// Long-term growth condition: EMA 20 > EMA 60 > EMA 120
longTermGrowth = sma20 > sma60
//  and ema60 > ema120

// Entry condition: Stock closes below EMA 20 and then rises back above EMA 10

// entryCondition = ta.crossover(close, ema20) or (close[1] < ema20[1] and close > ema20)
entryCondition =  sma5[1] <= sma20[1] and sma5 > sma20
// ta.crossover(sma5, sma20)

// Exit condition: EMA 20 drops below EMA 60
// exitCondition = ema5 < ema60 or (year == 2024 and month == 12 and dayofmonth == 30)
exitCondition = ta.crossover(sma20, sma5)

// Execute trades
if entryCondition and inTradeWindow
    strategy.entry("Long Entry", strategy.long)

if exitCondition and inTradeWindow
    strategy.close("Long Entry")
// plotchar(true, char="sma5: " + str.tostring(sma5))
// plotchar(true, char="sma5: " + sma20)
// label.new(x=bar_index, y=high + 10, text="SMA 5: " + str.tostring(sma5), color=color.blue, style=label.style_label_down, textcolor=color.white, size=size.small)
// label.new(x=bar_index, y=low, text="SMA 20: " + str.tostring(sma20), color=color.red, style=label.style_label_down, textcolor=color.white, size=size.small)


// x = time + (time - time[1]) * offset_x

//     var label lab = na
//     label.delete(lab)
//     lab := label.new(x=x, y=0, text=txt, xloc=xloc.bar_time, yloc=yloc.belowbar, color=color.red, textcolor=color.black, size=size.normal, style=label.style_label_up)
//     label.set_x(lab, x)


// Plot EMAs for visualization
// plot(ema20, color=color.red, title="EMA 20")
// plot(ema60, color=color.green, title="EMA 60")
// plot(ema120, color=color.blue, title="EMA 120")