概述
动态通道百分比包络策略是一种基于价格波动范围的交易系统。该策略利用移动平均线(MA)作为基准线,并在其上下方设置一定百分比的通道边界。策略的核心思想是在价格触及下边界时买入,在价格回升至中线时卖出,从而捕捉价格在通道内的波动。这种方法结合了趋势跟踪和振荡交易的特点,旨在优化入场和出场时机。
策略原理
基准线计算:策略允许用户选择简单移动平均线(SMA)或指数移动平均线(EMA)作为基准线。默认周期为10,但可以通过输入参数调整。
通道边界设置:上下通道边界通过在基准线基础上增加或减少一定百分比来确定。默认百分比为10%,同样可以通过参数调整。
交易信号生成:
- 买入信号:当价格从下方穿越下边界时触发。
- 卖出信号:当价格从下方穿越基准线时触发。
交易执行:
- 在买入信号出现且当前没有持仓时,开立多头仓位。
- 在卖出信号出现且持有多头仓位时,平仓结束交易。
策略优势
自适应性强:通过使用移动平均线作为基准,策略能够适应不同市场环境和波动性。
风险管理有效:通过设置百分比通道,策略能够在一定程度上控制风险,避免在极端行情中频繁交易。
灵活性高:策略提供多个可调参数,包括均线类型、周期和通道宽度,使用者可以根据不同市场和个人偏好进行优化。
可视化效果好:策略在图表上直观地显示了基准线和通道边界,便于交易者理解市场结构和当前位置。
趋势跟随与反转兼顾:通过在下边界买入,策略能够捕捉潜在的反转机会;而在基准线卖出则有助于在趋势延续时获利了结。
策略风险
假突破风险:价格可能短暂突破通道边界后又迅速回落,导致错误信号和不必要的交易。
震荡市场表现欠佳:在没有明显趋势的横盘市场中,策略可能产生频繁的交易信号,增加交易成本。
滞后性:由于使用移动平均线,策略在快速变化的市场中可能反应较慢,错过重要的入场或出场机会。
参数敏感性:策略表现很大程度上依赖于参数设置,不同的参数组合可能导致截然不同的结果。
单一技术指标依赖:仅依靠价格与通道的关系来交易,可能忽视其他重要的市场信息和基本面因素。
策略优化方向
引入多时间框架分析:结合更长期的趋势判断,可以提高交易的准确性和盈利能力。
增加过滤条件:例如,可以添加成交量确认或其他技术指标(如RSI、MACD等)作为辅助判断,减少假信号。
动态调整通道宽度:根据市场波动性自动调整通道百分比,以适应不同的市场环境。
优化出场机制:考虑引入追踪止损或基于波动率的动态止损,以更好地保护利润。
实现部分仓位管理:允许分批建仓和平仓,以降低单一决策的风险。
加入市场情绪指标:结合诸如VIX指数等市场情绪指标,在高波动期间调整策略参数或暂停交易。
开发自适应参数机制:利用机器学习算法,根据历史数据自动优化策略参数。
总结
动态通道百分比包络策略是一种结合了趋势跟随和振荡交易理念的灵活交易系统。通过设置基于移动平均线的百分比通道,策略能够在不同市场环境下捕捉价格波动机会。其优势在于自适应性强、风险管理有效且可视化程度高,但同时也面临假突破、震荡市表现欠佳等风险。
为了进一步提升策略性能,可以考虑引入多时间框架分析、增加过滤条件、动态调整通道宽度等优化方向。此外,结合其他技术指标和基本面分析,以及实现更sophisticated的仓位管理和风险控制机制,都是值得探索的改进路径。
总的来说,动态通道百分比包络策略为交易者提供了一个solid的框架,通过合理的参数设置和持续优化,有潜力成为一个稳健的交易工具。然而,如同所有交易策略一样,在实盘应用时需要谨慎评估市场条件,并结合个人风险承受能力和交易目标进行适当调整。
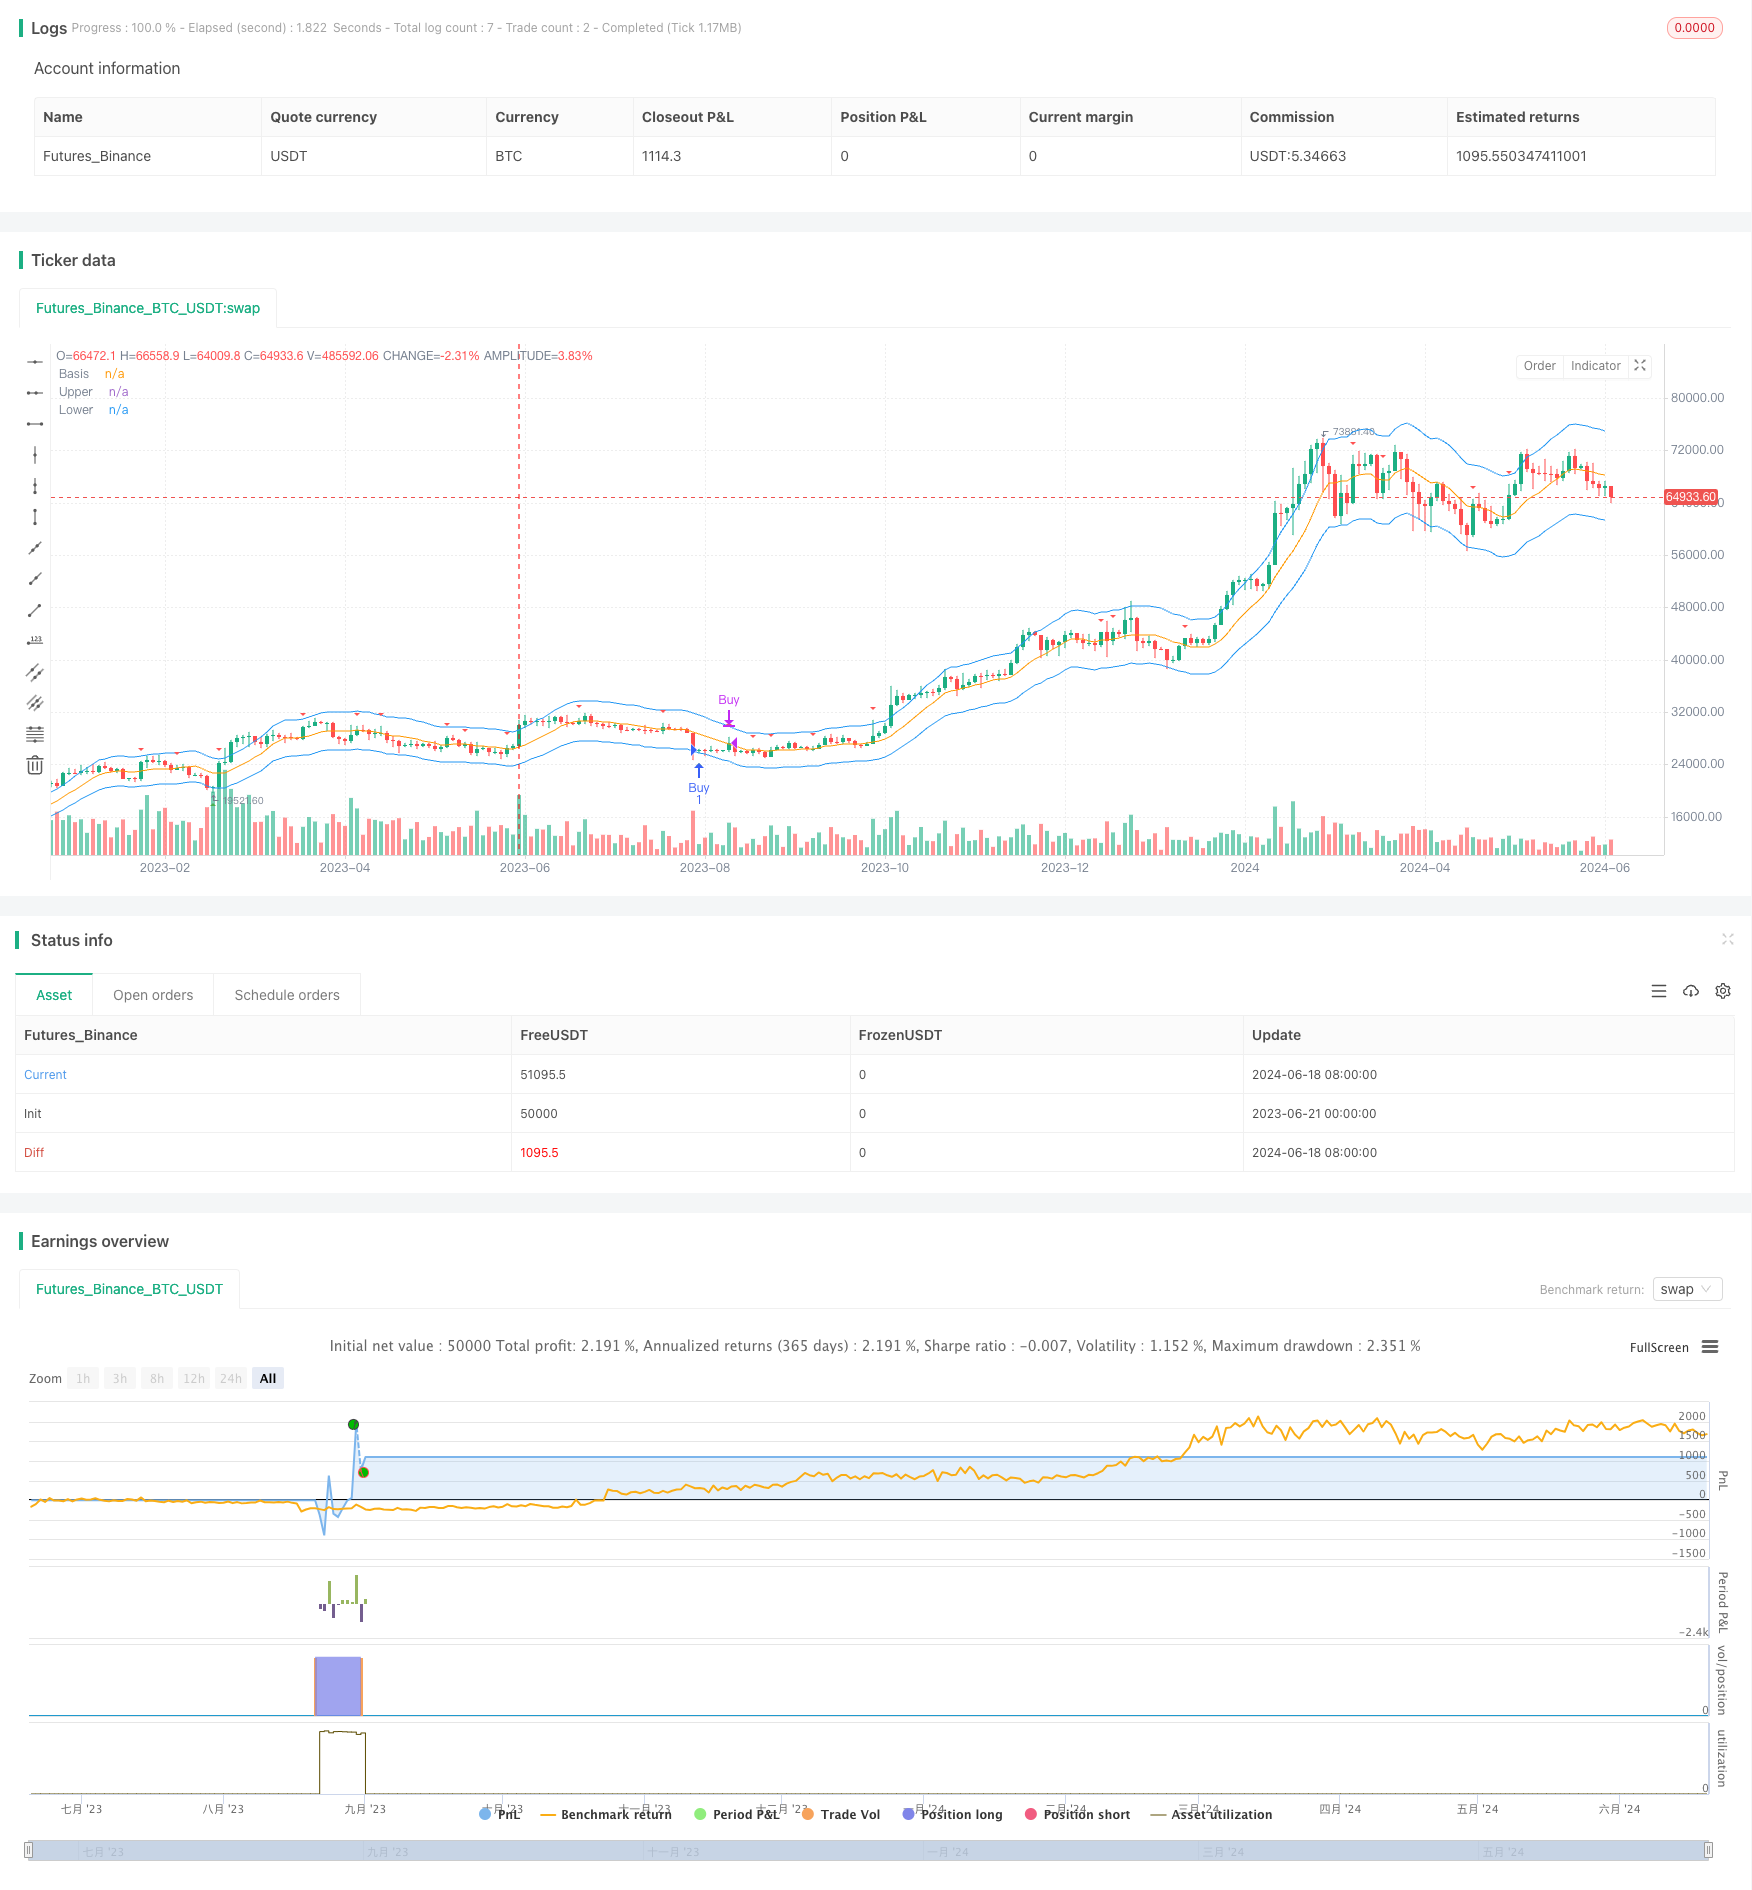
/*backtest
start: 2023-06-21 00:00:00
end: 2024-06-20 00:00:00
period: 2d
basePeriod: 1d
exchanges: [{"eid":"Futures_Binance","currency":"BTC_USDT"}]
*/

//@version=4
strategy("Envelope Strategy", overlay=true)

// Input parameters
len = input(10, title="Length", minval=1)
percent = input(10.0, title="Percent")
src = input(close, title="Source")
exponential = input(false, title="Use EMA")

// Calculate basis, upper, and lower envelopes
basis = exponential ? ema(src, len) : sma(src, len)
k = percent / 100.0
upper = basis * (1 + k)
lower = basis * (1 - k)

// Buy and Sell conditions
buy_signal = crossover(src, lower)
sell_signal = crossover(src, basis)

// Plotting the basis, upper, and lower envelopes
plot(basis, "Basis", color=color.orange)
plot(upper, "Upper", color=color.blue)
plot(lower, "Lower", color=color.blue)

// Plotting buy and sell signals
plotshape(buy_signal, title="Buy Signal", location=location.belowbar, color=color.green, style=shape.triangleup, size=size.small)
plotshape(sell_signal, title="Sell Signal", location=location.abovebar, color=color.red, style=shape.triangledown, size=size.small)

// Trading operations
if (buy_signal and strategy.position_size == 0)
    strategy.entry("Buy", strategy.long)
if (sell_signal and strategy.position_size == 1)
    strategy.close("Buy")