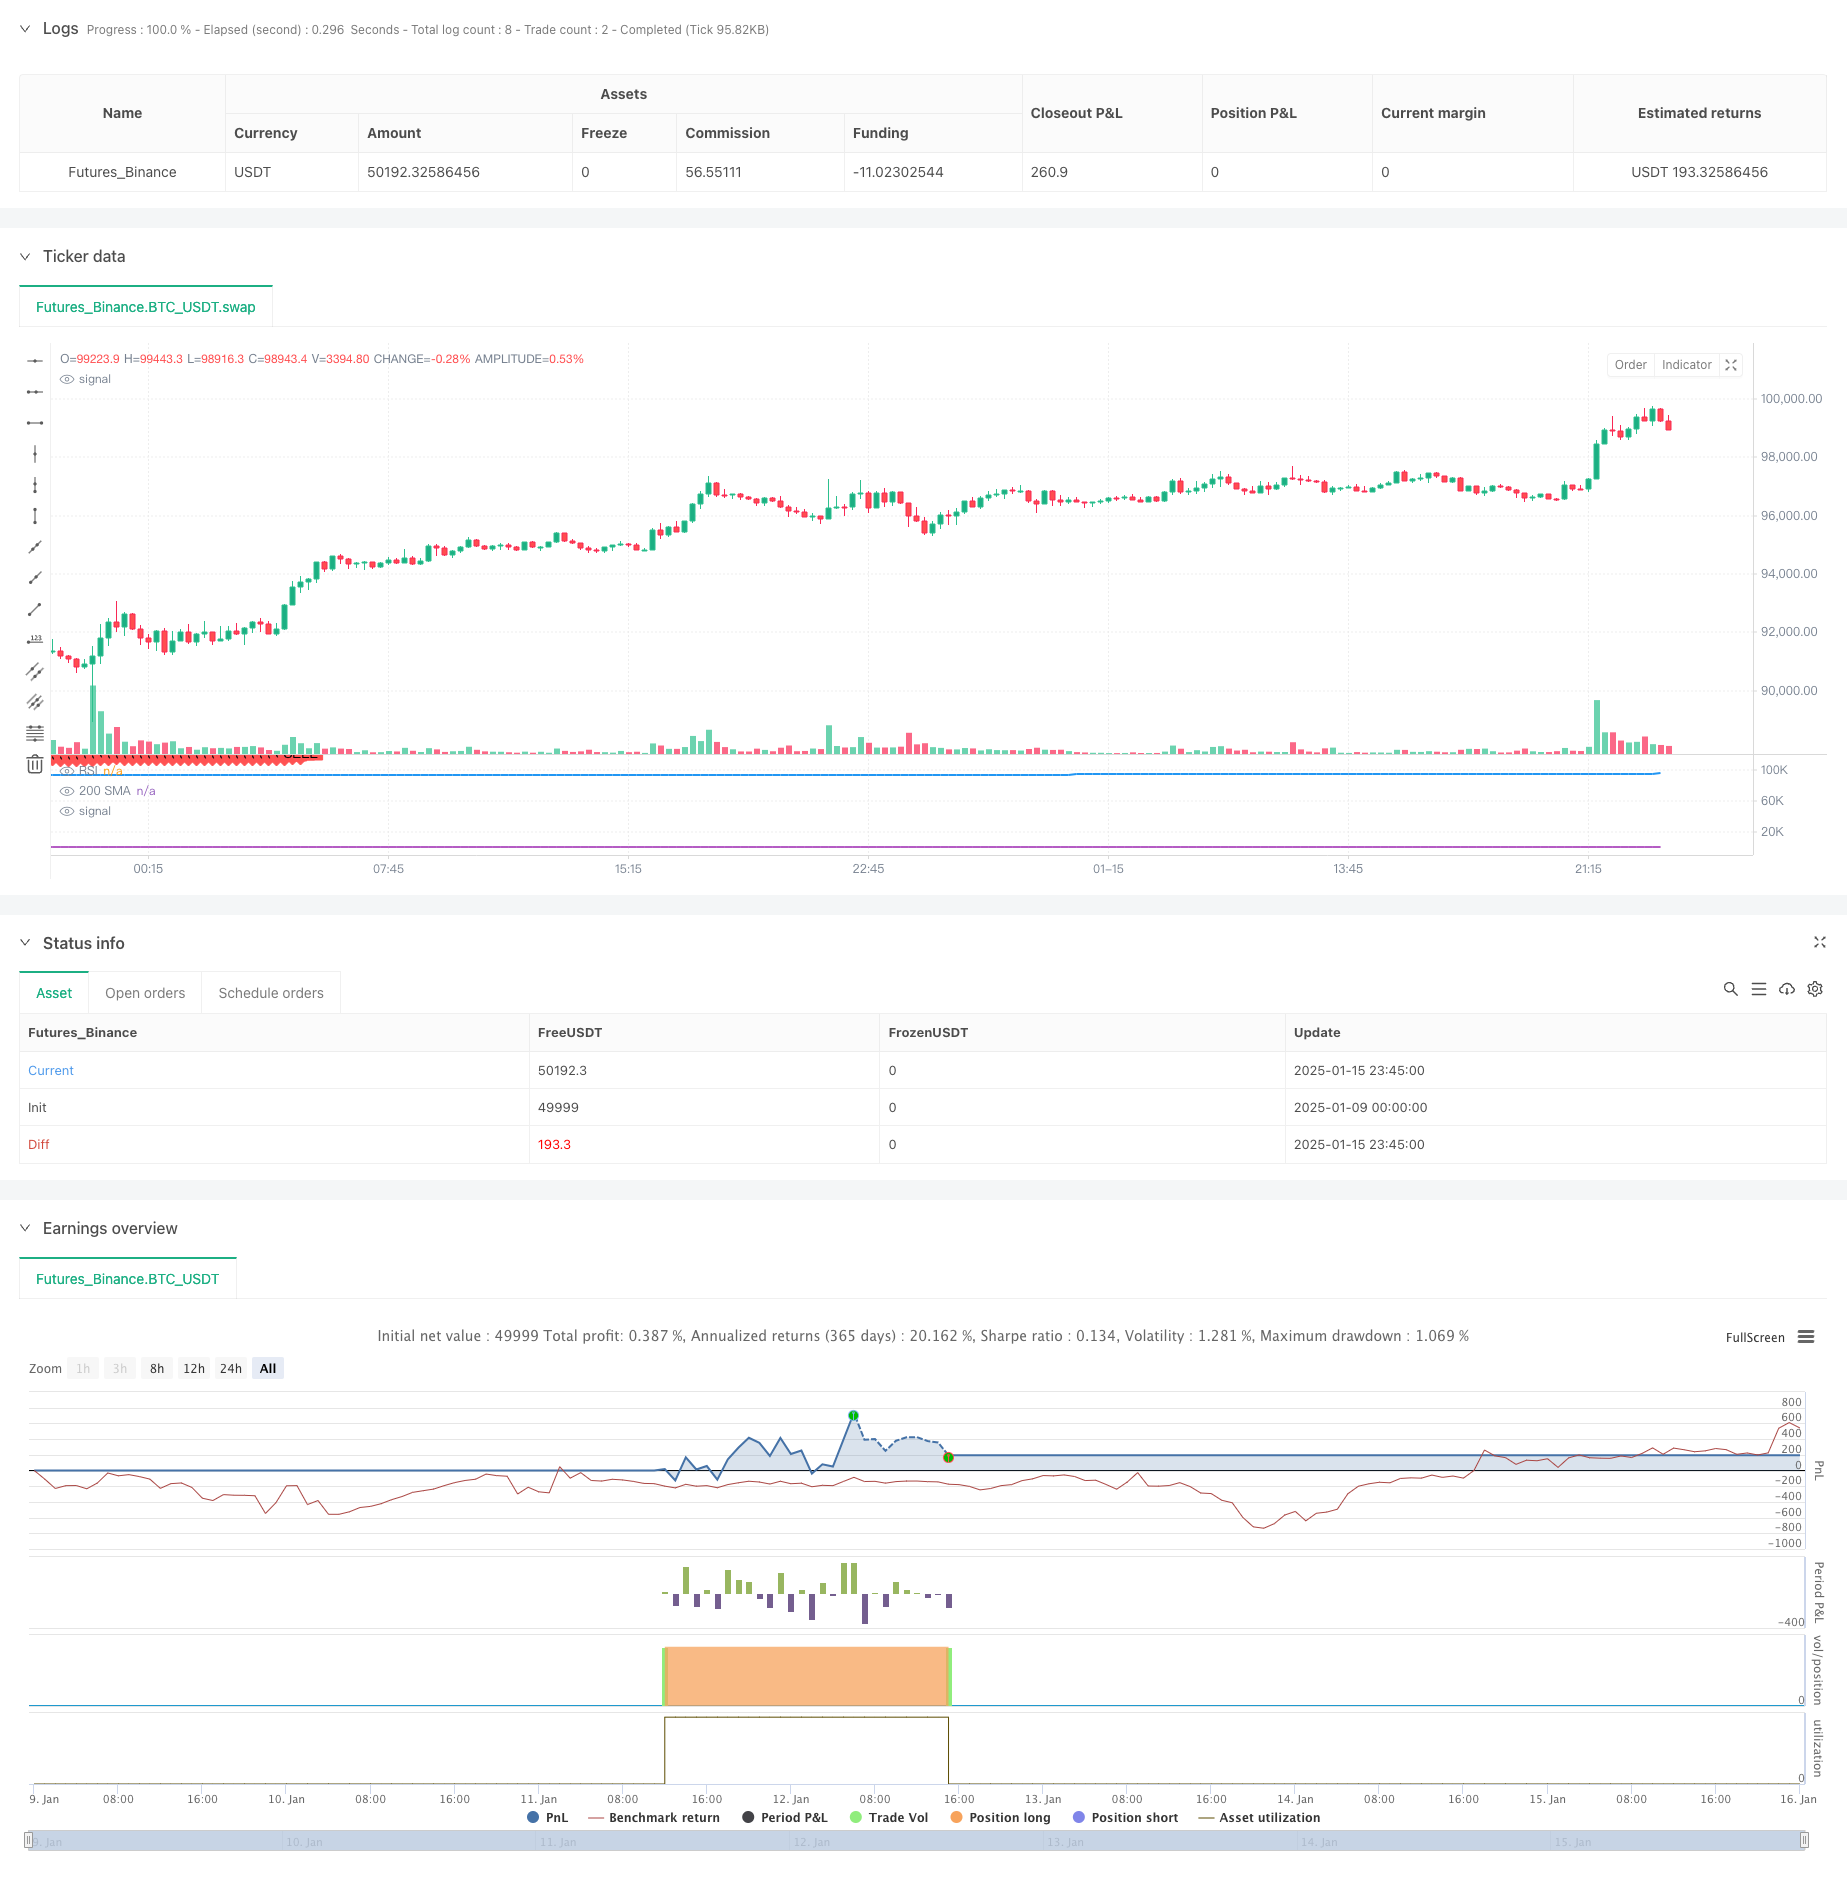
Visão geral
Esta estratégia é um sistema de negociação quantitativa baseado em média móvel, indicador RSI e trailing stop loss. Ele combina monitoramento de tendências e indicadores de momentum em análise técnica para alcançar transações com controle de risco, definindo condições rigorosas de entrada e saída. A lógica central da estratégia é procurar oportunidades de sobrevenda para entrar no mercado em uma tendência de alta e usar trailing stop losses para proteger os lucros.
Princípio da estratégia
A estratégia usa a média móvel simples (MMS) de 200 dias como base para julgamento de tendências e a combina com o índice de força relativa (RSI) para gerar sinais de negociação. Especificamente:
- Use a média móvel de 200 dias para determinar a tendência geral e considere operar comprado somente quando o preço estiver acima da média móvel.
- Quando o RSI cai abaixo do limite predefinido (padrão 40), é considerado um sinal de sobrevenda.
- Quando ambas as condições acima forem atendidas e o período de espera (padrão 10 dias) tiver passado desde que a última posição foi fechada, um sinal longo será acionado
- Proteja dinamicamente os lucros durante a manutenção da posição por meio do trailing stop loss (padrão 5%)
- Quando o preço cair abaixo do preço de stop loss ou cair abaixo da média móvel de 200 dias, feche a posição
Vantagens estratégicas
- Combine a filtragem dupla de tendência e momentum para melhorar a precisão da negociação
- Usando o mecanismo de trailing stop loss, você pode efetivamente bloquear lucros
- Defina intervalos de transação para evitar transações frequentes
- Os parâmetros são altamente ajustáveis para se adaptarem a diferentes ambientes de mercado
- A lógica da transação é clara, fácil de entender e executar
- Cálculo simples e alta eficiência operacional
Risco estratégico
- Atrasos na média móvel podem causar sinais de entrada e saída atrasados
- O indicador RSI pode gerar sinais falsos em um mercado volátil
- Trailing stops de porcentagem fixa podem não ser adequados para todas as condições de mercado
- A otimização de parâmetros pode levar ao overfitting
- Pode sofrer grandes quedas em mercados voláteis
Direção de otimização da estratégia
- Apresentando a porcentagem de trailing stop adaptável à volatilidade
- Adicionar indicador de volume como confirmação auxiliar
- Use a média móvel exponencial em vez da média móvel simples para melhorar a sensibilidade
- Adicione indicadores de sentimento de mercado para otimizar as oportunidades de negociação
- Desenvolver mecanismo de otimização de parâmetros dinâmicos
- Adicionado mecanismo de confirmação de estratégia multiperíodo
Resumir
Esta é uma estratégia de negociação quantitativa com uma estrutura completa e lógica clara. Ele combina vários indicadores técnicos para buscar retornos estáveis e, ao mesmo tempo, controlar riscos. Embora haja espaço para otimização, a estrutura básica tem boa praticidade e escalabilidade. A estratégia é adequada para investidores de médio e longo prazo e tem boa adaptabilidade a diferentes ambientes de mercado.
/*backtest
start: 2025-01-09 00:00:00
end: 2025-01-16 00:00:00
period: 15m
basePeriod: 15m
exchanges: [{"eid":"Futures_Binance","currency":"BTC_USDT","balance":49999}]
*/

//@version=5
strategy("200 SMA Crossover Strategy", overlay=false)

// Define inputs
smaLength = input.int(200, title="SMA Length")
rsiLength = input.int(14, title="RSI Length")
rsiThreshold = input.float(40, title="RSI Threshold")
trailStopPercent = input.float(5.0, title="Trailing Stop Loss (%)")
waitingPeriod = input.int(10, title="Waiting Period (Days)")

// Calculate 200 SMA
sma200 = ta.sma(close, smaLength)

// Calculate RSI
rsi = ta.rsi(close, rsiLength)

// Plot the 200 SMA and RSI
plot(sma200, color=color.blue, linewidth=2, title="200 SMA")
plot(rsi, color=color.purple, title="RSI", display=display.none)

// Define buy and sell conditions
var isLong = false
var float lastExitTime = na
var float trailStopPrice = na

// Explicitly declare timeSinceExit as float
float timeSinceExit = na(lastExitTime) ? na : (time - lastExitTime) / (24 * 60 * 60 * 1000)
canEnter = na(lastExitTime) or timeSinceExit > waitingPeriod

buyCondition = close > sma200 and rsi < rsiThreshold and canEnter

if (buyCondition and not isLong)
    strategy.entry("Buy", strategy.long)
    trailStopPrice := na
    isLong := true

// Update trailing stop loss if long
if (isLong)
    trailStopPrice := na(trailStopPrice) ? close * (1 - trailStopPercent / 100) : math.max(trailStopPrice, close * (1 - trailStopPercent / 100))

// Check for trailing stop loss or sell condition
if (isLong and (close < trailStopPrice or close < sma200))
    strategy.close("Buy")
    lastExitTime := time
    isLong := false

// Plot buy and sell signals
plotshape(series=buyCondition, title="Buy Signal", location=location.belowbar, color=color.green, style=shape.labelup, text="BUY")
plotshape(series=(isLong and close < trailStopPrice) or close < sma200, title="Sell Signal", location=location.abovebar, color=color.red, style=shape.labeldown, text="SELL")