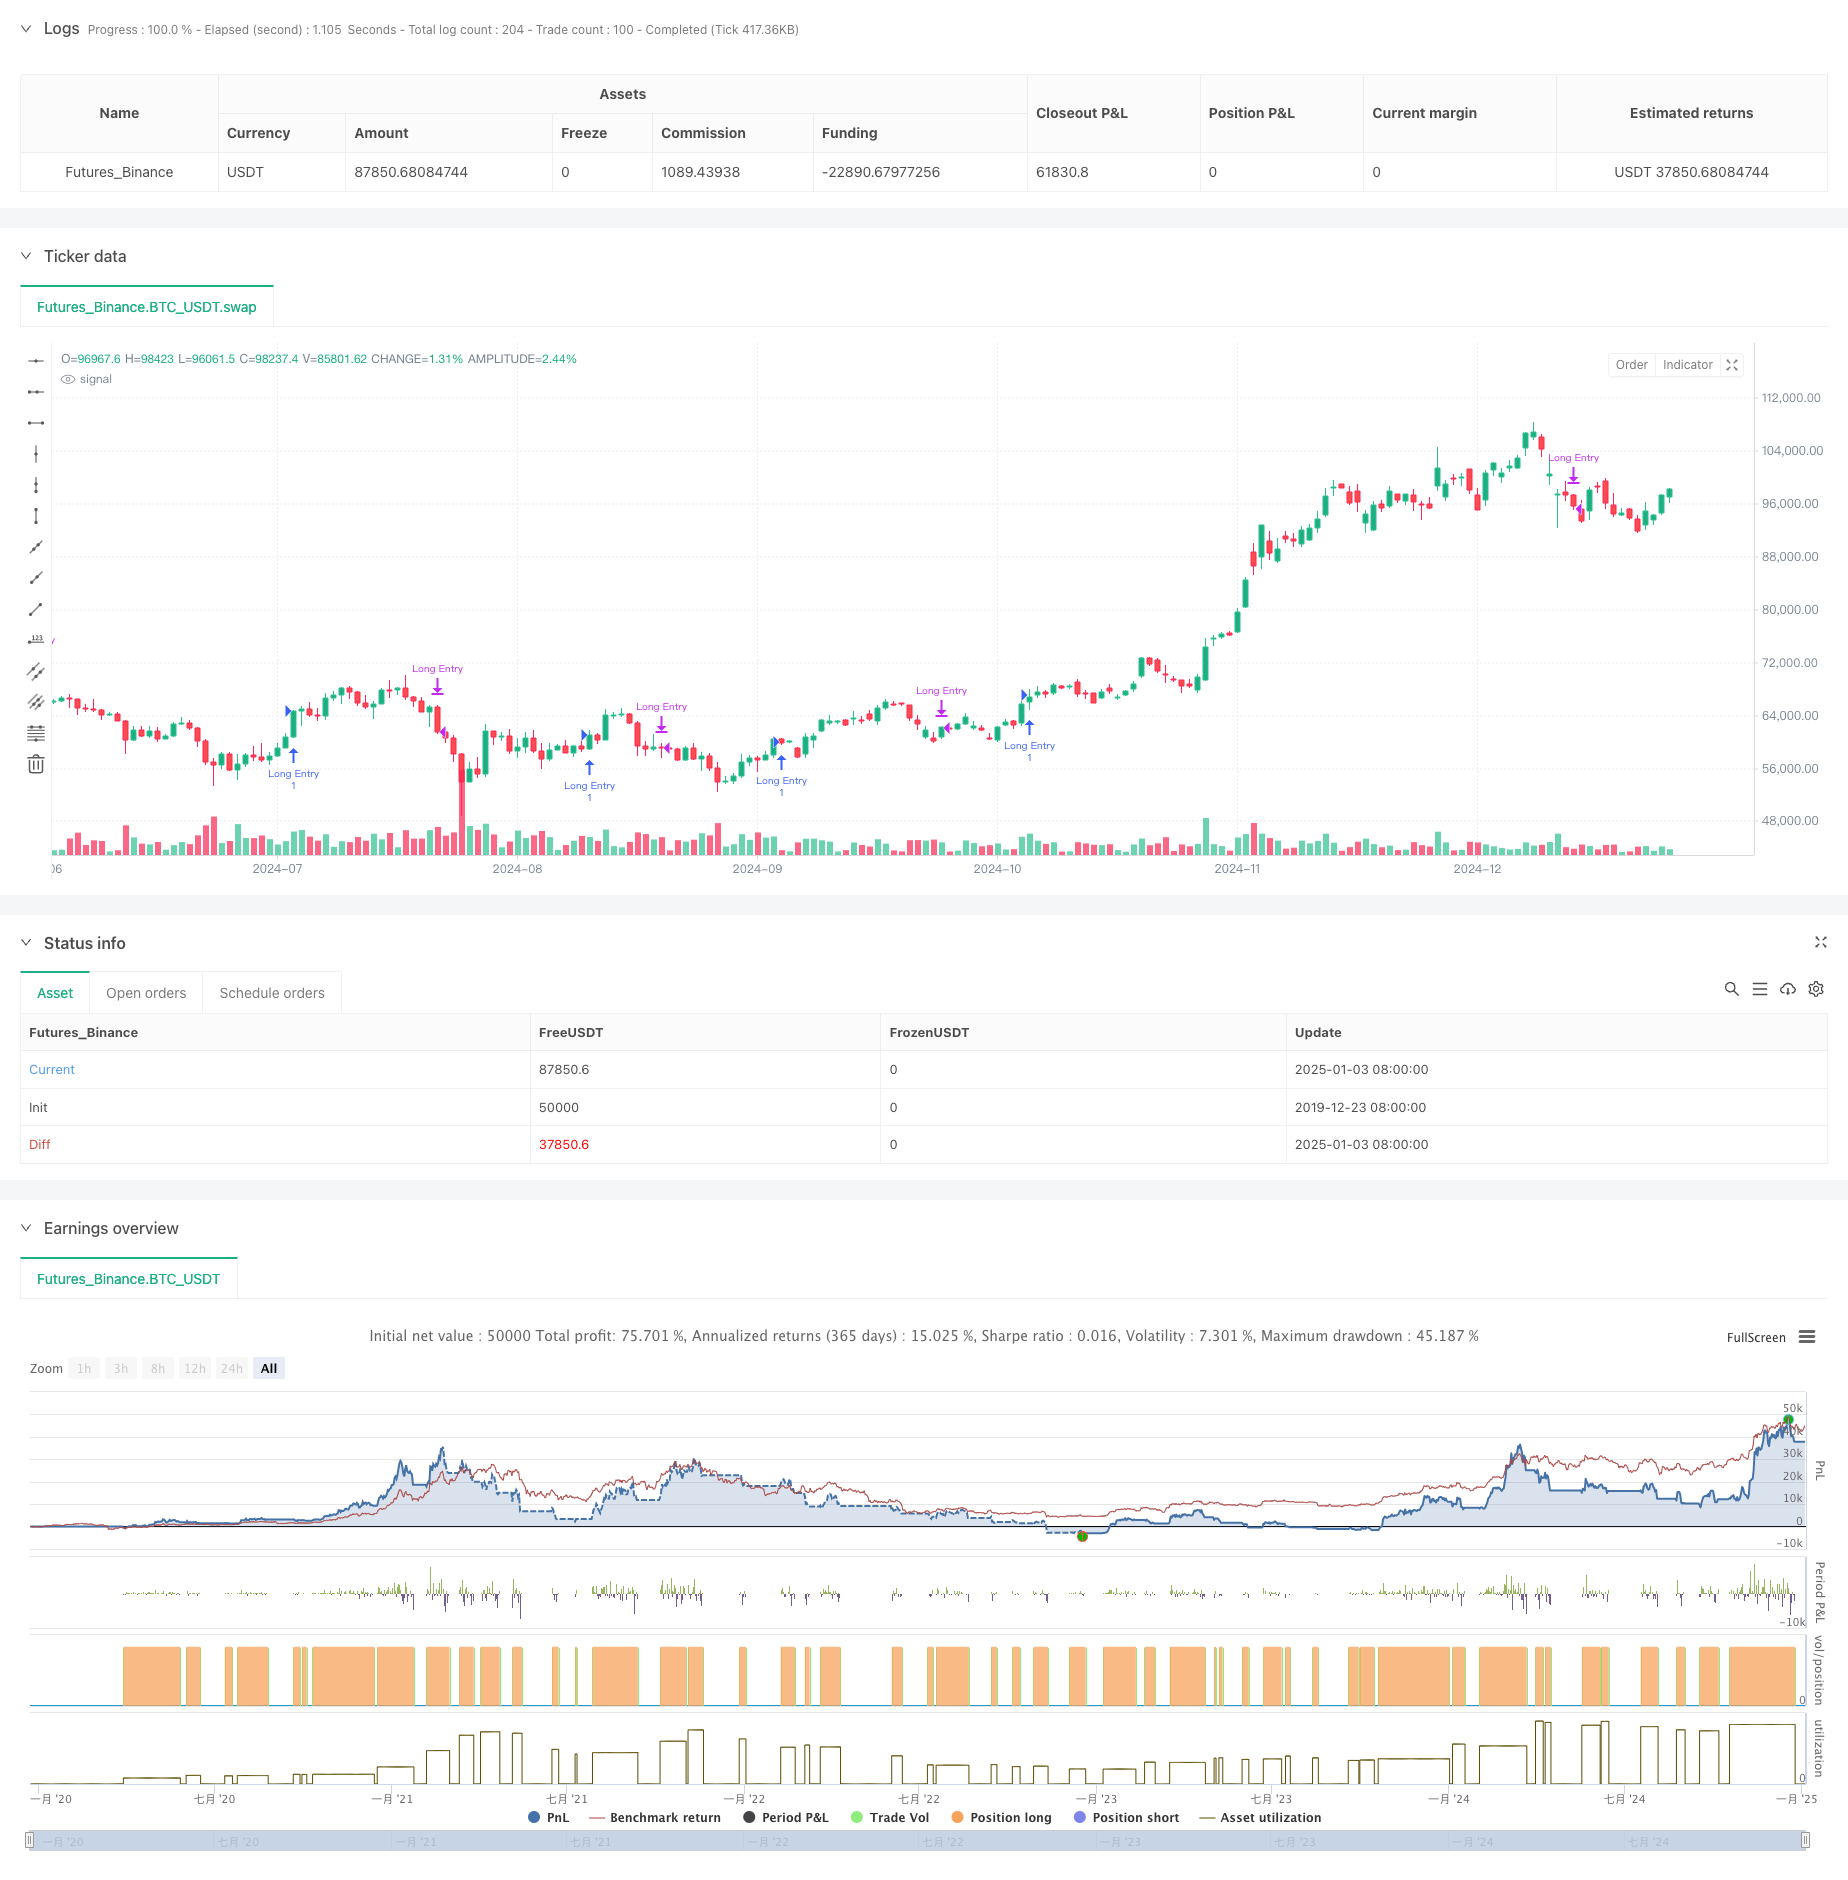
Обзор
Стратегия представляет собой количественную торговую систему, основанную на сигналах пересечения многопериодных простых скользящих средних (SMA). В первую очередь он торгует, выявляя краткосрочные возможности отката в рамках долгосрочного восходящего тренда. Стратегия использует индикаторы SMA с пятью периодами: 5 дней, 10 дней, 20 дней, 60 дней и 120 дней, чтобы оценивать рыночные тенденции и торговые возможности с помощью взаимосвязи позиций и сигналов пересечения скользящих средних.
Стратегический принцип
Основная логика стратегии включает в себя следующие ключевые части:
- Долгосрочный тренд можно оценить по относительному положению SMA20 и SMA60. Когда SMA20 выше SMA60, это подтверждает, что рынок находится в восходящем тренде.
- При подтверждении долгосрочного восходящего тренда сигнал на покупку срабатывает, когда краткосрочная SMA5 отскакивает от уровня ниже SMA20 и поднимается выше. Это говорит о том, что рынок восстанавливается после краткосрочного отката в рамках восходящего тренда.
- Когда SMA20 пересекает SMA5, срабатывает сигнал закрытия. Это свидетельствует о том, что краткосрочный восходящий импульс ослаб и может наступить период корректировки.
- Стратегия также включает функцию временного фильтра, которая может ограничить временной диапазон бэктестинга и повысить гибкость стратегии.
Стратегические преимущества
- Логика стратегии ясна и проста, ее легко понять и реализовать, и она не требует сложных расчетных процессов.
- Координированное использование скользящих средних с несколькими периодами позволяет эффективно отфильтровывать рыночный шум и повышать надежность торговых сигналов.
- Стратегия фокусируется на возможностях отката на трендовых рынках, что соответствует основной концепции «трендовой торговли».
- Использование SMA вместо EMA снижает чувствительность к изменениям цен и уменьшает количество ложных сигналов.
- Логика входа и выхода понятна, что облегчает исполнение и контроль рисков.
Стратегический риск
- Система скользящей средней имеет задержки, что может привести к неоптимальным моментам входа и выхода.
- На нестабильном рынке частые пересечения скользящих средних могут генерировать слишком много ложных сигналов.
- В стратегии отсутствует механизм фильтрации волатильности, и в периоды высокой волатильности могут возникнуть более высокие риски просадки.
- Без учета взаимодействия других технических индикаторов, таких как объем торгов, надежность сигнала необходимо повысить.
- Фиксированные параметры скользящей средней могут не подходить для всех рыночных условий.
Направление оптимизации стратегии
- Внедрите индикатор ATR для фильтрации волатильности и избегайте торговли, когда волатильность слишком высока.
- Добавьте механизм подтверждения объема для повышения надежности торговых сигналов.
- Разработайте механизм адаптивного цикла скользящей средней, чтобы стратегия могла лучше адаптироваться к различным рыночным условиям.
- Добавьте фильтр силы тренда, например индикатор ADX, чтобы обеспечить торговлю в условиях сильных трендов.
- Улучшите механизм стоп-лосса, например, добавив трейлинг-стоп, чтобы лучше контролировать риски.
Подвести итог
Эта стратегия использует многопериодные скользящие средние SMA для построения торговой системы, которая фокусируется на использовании возможностей отката в долгосрочных восходящих трендах. Стратегия лаконична и практична, легко понимаема и реализуема. Ожидается, что благодаря внедрению мер оптимизации, таких как фильтрация волатильности и подтверждение объема, надежность и прочность стратегии будут дополнительно повышены.
/*backtest
start: 2019-12-23 08:00:00
end: 2025-01-04 08:00:00
period: 1d
basePeriod: 1d
exchanges: [{"eid":"Futures_Binance","currency":"BTC_USDT"}]
*/

//@version=6
strategy("Long-Term Growing Stock Strategy", overlay=true)
// Date Range
// STEP 1. Create inputs that configure the backtest's date range
useDateFilter = input.bool(true, title="Filter Date Range of Backtest",group="Backtest Time Period")
backtestStartDate = input(timestamp("1 Jan 2014"),title="Start Date", group="Backtest Time Period",tooltip="This start date is in the time zone of the exchange " + "where the chart's instrument trades. It doesn't use the time " +"zone of the chart or of your computer.")
backtestEndDate = input(timestamp("31 Dec 2024"), title="End Date", group="Backtest Time Period")
// STEP 2. See if current bar falls inside the date range
inTradeWindow = true


// Calculate EMAs
// ema20 = ta.ema(close, ema20_length)
// ema60 = ta.ema(close, ema60_length)
// ema120 = ta.ema(close, ema120_length)
sma5 = ta.sma(close, 5)
sma10 = ta.sma(close, 10)
sma20 = ta.sma(close, 20)
sma60 = ta.sma(close, 60)
sma120 = ta.sma(close, 120)

// Long-term growth condition: EMA 20 > EMA 60 > EMA 120
longTermGrowth = sma20 > sma60
//  and ema60 > ema120

// Entry condition: Stock closes below EMA 20 and then rises back above EMA 10

// entryCondition = ta.crossover(close, ema20) or (close[1] < ema20[1] and close > ema20)
entryCondition =  sma5[1] <= sma20[1] and sma5 > sma20
// ta.crossover(sma5, sma20)

// Exit condition: EMA 20 drops below EMA 60
// exitCondition = ema5 < ema60 or (year == 2024 and month == 12 and dayofmonth == 30)
exitCondition = ta.crossover(sma20, sma5)

// Execute trades
if entryCondition and inTradeWindow
    strategy.entry("Long Entry", strategy.long)

if exitCondition and inTradeWindow
    strategy.close("Long Entry")
// plotchar(true, char="sma5: " + str.tostring(sma5))
// plotchar(true, char="sma5: " + sma20)
// label.new(x=bar_index, y=high + 10, text="SMA 5: " + str.tostring(sma5), color=color.blue, style=label.style_label_down, textcolor=color.white, size=size.small)
// label.new(x=bar_index, y=low, text="SMA 20: " + str.tostring(sma20), color=color.red, style=label.style_label_down, textcolor=color.white, size=size.small)


// x = time + (time - time[1]) * offset_x

//     var label lab = na
//     label.delete(lab)
//     lab := label.new(x=x, y=0, text=txt, xloc=xloc.bar_time, yloc=yloc.belowbar, color=color.red, textcolor=color.black, size=size.normal, style=label.style_label_up)
//     label.set_x(lab, x)


// Plot EMAs for visualization
// plot(ema20, color=color.red, title="EMA 20")
// plot(ema60, color=color.green, title="EMA 60")
// plot(ema120, color=color.blue, title="EMA 120")