بہترین ٹریڈنگ ویو حکمت عملی
مصنف:چاؤ ژانگ، تاریخ: 2022-05-09 21:08:17ٹیگز:آر ایس آئیایم اے
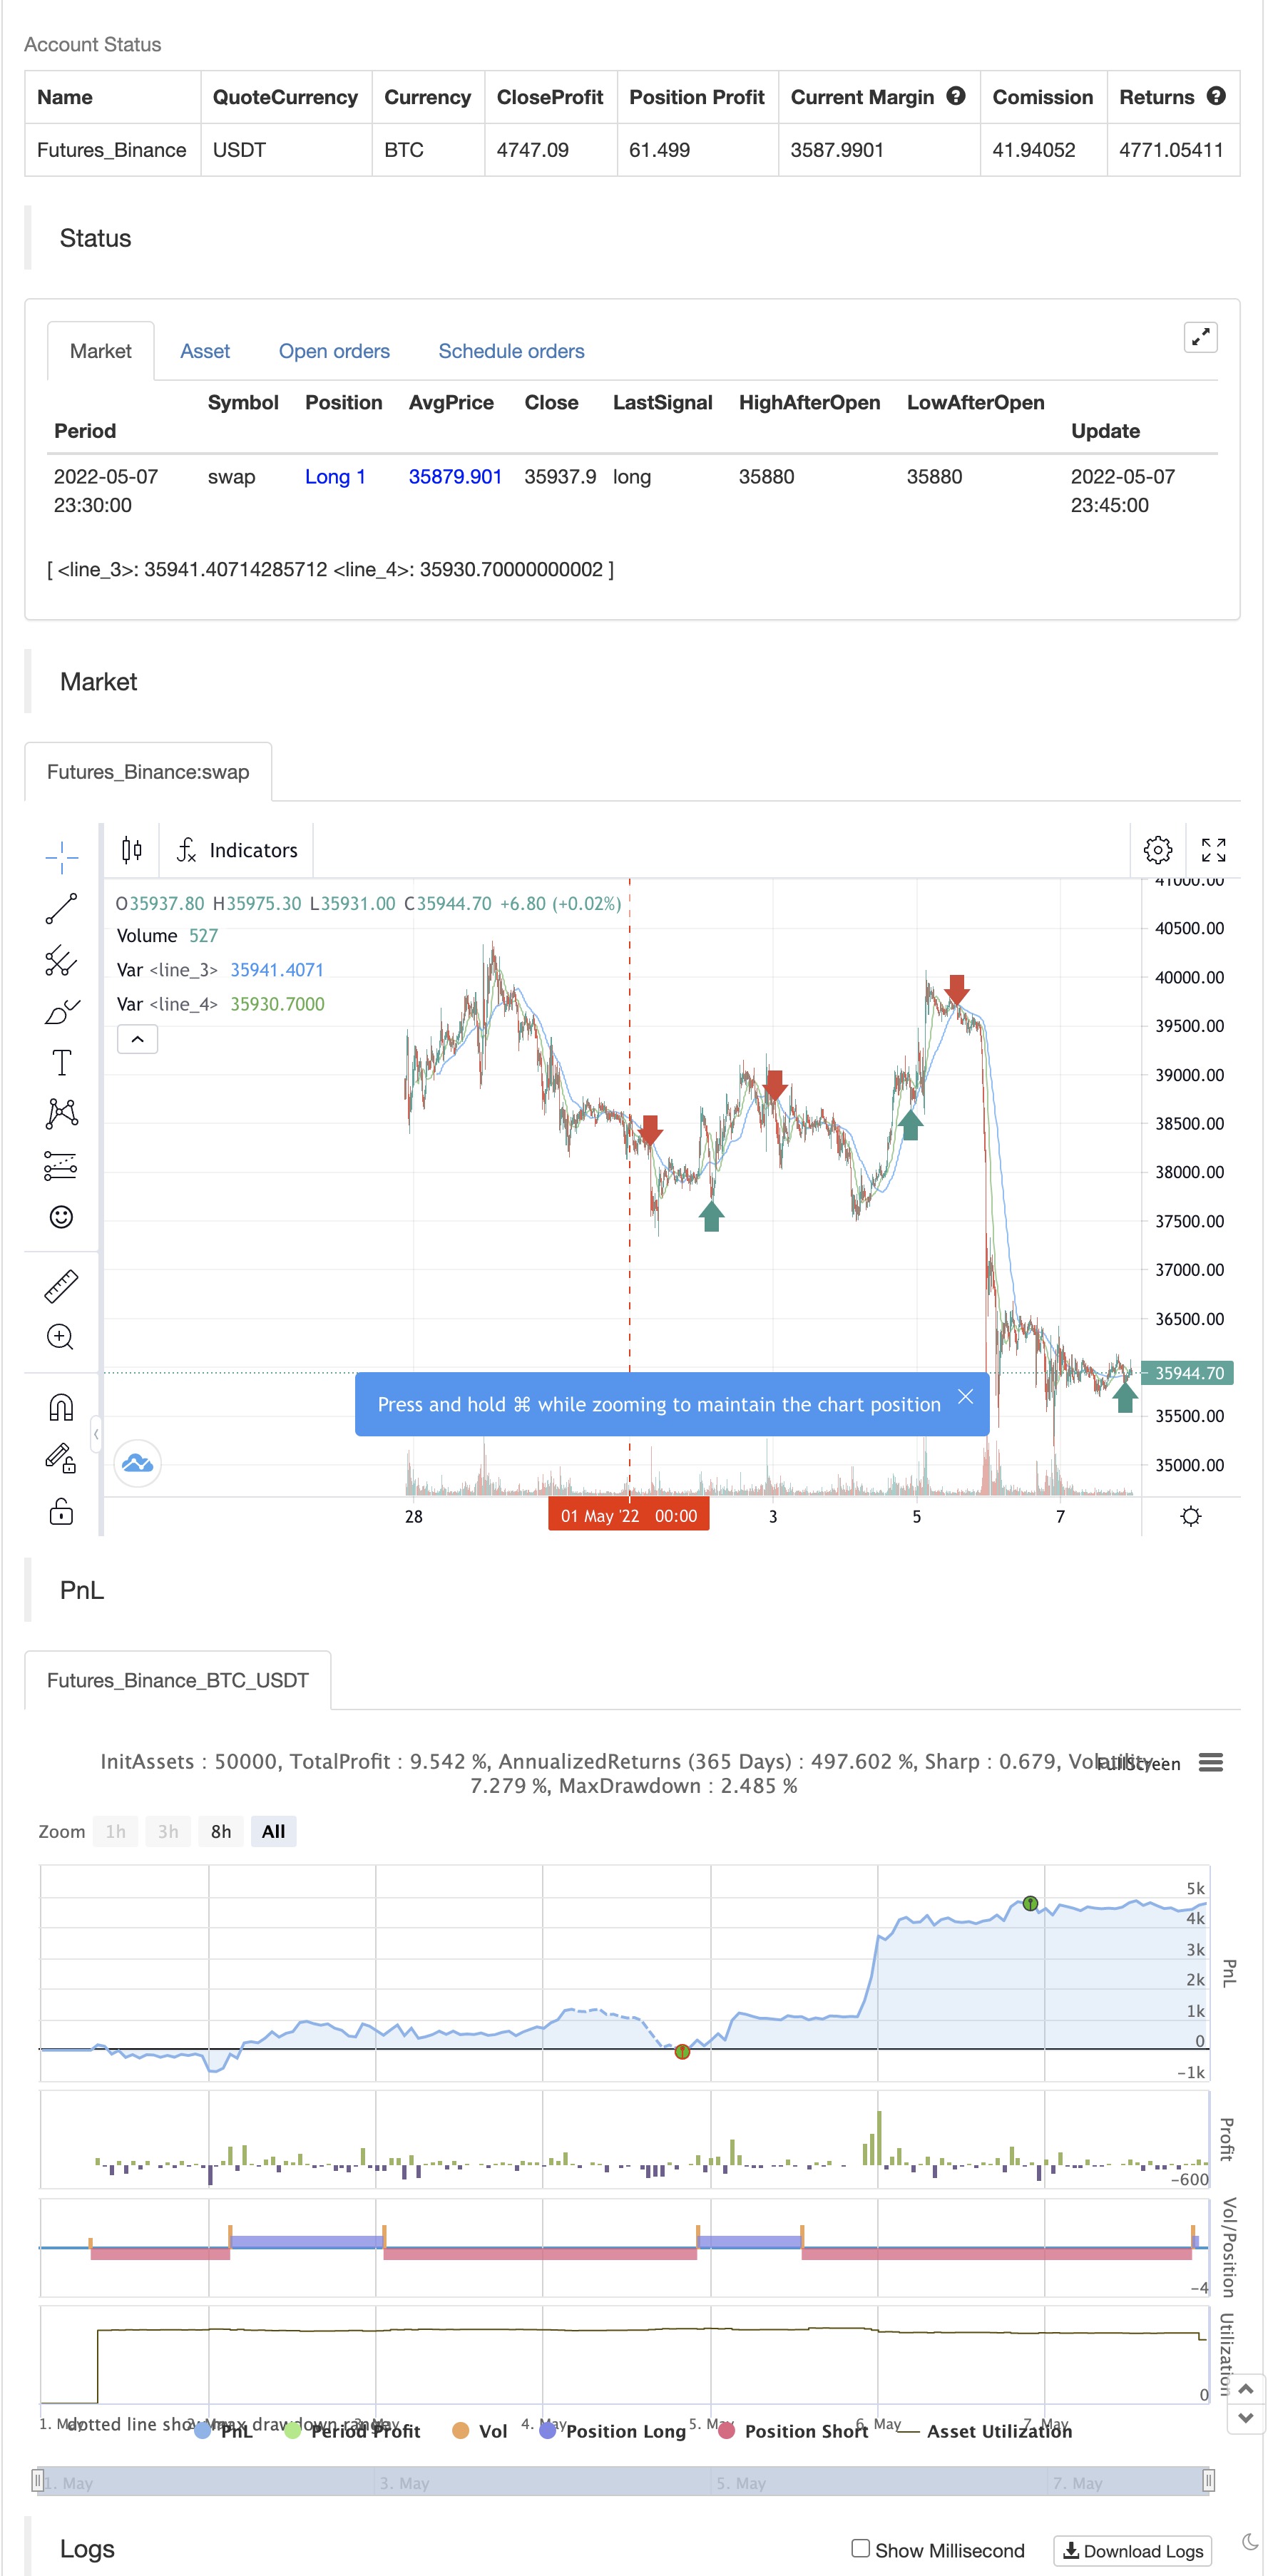
اسکرپٹ مکمل طور پر رفتار، حجم اور قیمت پر مبنی ہے۔ ہم نے استعمال کیا ہے: 1: بولنگر بینڈ جب ایک فرار ہو سکتا ہے معلوم کرنے کے لئے سکیڑتا ہے. 2: سمت جاننے کے لئے حرکت پذیر اوسط (ایس ایم اے اور ای ایم اے) کا استعمال کیا جاتا ہے۔ 3: اس حکمت عملی کی کامیابی کی شرح 75٪ سے زیادہ ہے اور اگر تھوڑی قیمت کی کارروائی شامل کی جائے تو یہ آسانی سے 90٪ کامیابی کے نشان سے تجاوز کر سکتی ہے۔ 4: drawdowns کے بارے میں فکر مت کرو، ہم نے لاٹری SL لاگو کیا ہے، لہذا آپ کو تھوڑا سا اضافی drawdown دیکھ سکتے ہیں لیکن حقیقت میں یہ بہت کم ہے. ۵: میں نے خود اس حکمت عملی کو ۴۱ دن تک ۲۵۰ ڈالر کے اکاؤنٹ سے آزمایا ہے اور ابھی میرے پاس ۲۷۰۰ ڈالر ہیں۔
بیک ٹسٹ

/*backtest
start: 2022-05-01 00:00:00
end: 2022-05-07 23:59:00
period: 15m
basePeriod: 5m
exchanges: [{"eid":"Bitfinex","currency":"BTC_USD"}]
*/

// This source code is subject to the terms of the Mozilla Public License 2.0 at https://mozilla.org/MPL/2.0/
// © The_Bigger_Bull
//@version=5
strategy("Best TradingView Strategy", overlay=true, margin_long=0, margin_short=0)
//Bollinger Bands
source1 = close
length1 = input.int(15, minval=1)
mult1 = input.float(2.0, minval=0.001, maxval=50)
basis1 = ta.sma(source1, length1)
dev1 = mult1 * ta.stdev(source1, length1)
upper1 = basis1 + dev1
lower1 = basis1 - dev1
//buyEntry = ta.crossover(source1, lower1)
//sellEntry = ta.crossunder(source1, upper1)

//RSI
ma(source, length, type) =>
    switch type
        "SMA" => ta.sma(source, length)
        "Bollinger Bands" => ta.sma(source, length)
        "EMA" => ta.ema(source, length)
        "SMMA (RMA)" => ta.rma(source, length)
        "WMA" => ta.wma(source, length)
        "VWMA" => ta.vwma(source, length)

rsiLengthInput = input.int(14, minval=1, title="RSI Length", group="RSI Settings")
rsiSourceInput = input.source(close, "Source", group="RSI Settings")
maTypeInput = input.string("SMA", title="MA Type", options=["SMA", "Bollinger Bands", "EMA", "SMMA (RMA)", "WMA", "VWMA"], group="MA Settings")
maLengthInput = input.int(14, title="MA Length", group="MA Settings")
bbMultInput = input.float(2.0, minval=0.001, maxval=50, title="BB StdDev", group="MA Settings")

up = ta.rma(math.max(ta.change(rsiSourceInput), 0), rsiLengthInput)
down = ta.rma(-math.min(ta.change(rsiSourceInput), 0), rsiLengthInput)
rsi = down == 0 ? 100 : up == 0 ? 0 : 100 - (100 / (1 + up / down))
rsiMA = ma(rsi, maLengthInput, maTypeInput)
isBB = maTypeInput == "Bollinger Bands"

//plot(rsi, "RSI", color=#7E57C2)
//plot(rsiMA, "RSI-based MA", color=color.yellow)
rsiUpperBand = hline(70, "RSI Upper Band", color=#787B86)
hline(50, "RSI Middle Band", color=color.new(#787B86, 50))
rsiLowerBand = hline(30, "RSI Lower Band", color=#787B86)
//fill(rsiUpperBand, rsiLowerBand, color=color.rgb(126, 87, 194, 90), title="RSI Background Fill")
bbUpperBand = plot(isBB ? rsiMA + ta.stdev(rsi, maLengthInput) * bbMultInput : na, title = "Upper Bollinger Band", color=color.green)
bbLowerBand = plot(isBB ? rsiMA - ta.stdev(rsi, maLengthInput) * bbMultInput : na, title = "Lower Bollinger Band", color=color.green)
//fill(bbUpperBand, bbLowerBand, color= isBB ? color.new(color.green, 90) : na, title="Bollinger Bands Background Fill")

//ADX

adxlen = input(14, title="ADX Smoothing")
dilen = input(14, title="DI Length")
dirmov(len) =>
	up1 = ta.change(high)
	down1 = -ta.change(low)
	plusDM = na(up1) ? na : (up1 > down1 and up1 > 0 ? up1 : 0)
	minusDM = na(down1) ? na : (down1 > up1 and down1 > 0 ? down1 : 0)
	truerange = ta.rma(ta.tr, len)
	plus = fixnan(100 * ta.rma(plusDM, len) / truerange)
	minus = fixnan(100 * ta.rma(minusDM, len) / truerange)
	[plus, minus]
adx(dilen, adxlen) =>
	[plus, minus] = dirmov(dilen)
	sum = plus + minus
	adx = 100 * ta.rma(math.abs(plus - minus) / (sum == 0 ? 1 : sum), adxlen)
sig = adx(dilen, adxlen)


out = ta.sma(close, 14)

sma1=ta.sma(close,42)

ema200=ta.ema(close,200)


longCondition = (out>sma1) and ta.crossover(source1, lower1)

if (longCondition )
    strategy.entry("long", strategy.long)

shortCondition = (out<sma1) and ta.crossunder(source1, lower1)

if (shortCondition )
    strategy.entry("short", strategy.short)


stopl=strategy.position_avg_price-50
tptgt=strategy.position_avg_price+100
stopshort=strategy.position_avg_price+50
tptgtshort=strategy.position_avg_price-100

strategy.exit("longclose","long",trail_offset=50,trail_points=100,when=ta.crossover(sma1,out))
strategy.exit("shortclose","short",trail_offset=50,trail_points=100,when=ta.crossover(out,sma1))


//if strategy.position_avg_price<0


plot(sma1 , color=color.blue)
plot(out, color=color.green)
//plot(ema200,color=color.red)
متعلقہ
- RSI متحرک ڈراپ ڈاؤن سٹاپ نقصان کی حکمت عملی
- کثیر تصدیق کی واپسی کی خریداری کی حکمت عملی
- اعلی درجے کی متحرک فبونیکی ریٹریسیشن رجحان مقداری تجارتی حکمت عملی
- ایم اے، ایس ایم اے، ایم اے ڈیلپ، ٹریلنگ سٹاپ نقصان، دوبارہ اندراج
- سٹاپ نقصان کی اصلاح کے ماڈل کے ساتھ متحرک آر ایس آئی اوور سیلڈ ریبونڈ ٹریڈنگ کی حکمت عملی
- بولنگر بینڈ، حرکت پذیر اوسط اور آر ایس آئی پر مبنی قلیل مدتی تجارتی حکمت عملی
- منگل کی تبدیلی کی حکمت عملی (ہفتے کے اختتام کے فلٹر)
- ای ایم اے اور ٹرینڈ لائن بریک آؤٹ پر مبنی دوہری حرکت پذیر اوسط آر ایس آئی مومنٹم حکمت عملی
- RSI-ATR رفتار اتار چڑھاؤ مشترکہ ٹریڈنگ کی حکمت عملی
- ایک سے زیادہ مدت چلتی اوسط اور RSI رفتار کراس حکمت عملی
مزید
- نیک اسٹوک
- اسٹاک سپر ٹرڈ ATR 200MA
- MTF RSI & STOCH حکمت عملی
- EMA + AROON + ASH
- رفتار 2.0
- ای ایچ ایم اے رینج حکمت عملی
- اوسط خرید و فروخت
- میڈاس ایم کے II - الٹیمیٹ کریپٹو سوئنگ
- ٹی ایم اے-لیگیسی
- ٹی وی ہائی اور لو حکمت عملی
- بڑے سنیپر انتباہات R3.0 + چیکنگ Volatility حالت + TP RSI
- چنڈے کرول سٹاپ
- RSI کراس حکمت عملی کے ساتھ CCI + EMA
- ای ایم اے بینڈ + لیلیڈ سی + بولنگر بینڈ ٹرینڈ کیچنگ حکمت عملی
- RSI MTF Ob+Os
- ایم اے سی ڈی ولی حکمت عملی
- آر ایس آئی - خرید فروخت سگنل
- ہیکن-اشی رجحان
- HA مارکیٹ تعصب
- Ichimoku بادل ہموار Oscillator