动态网格趋势追踪量化交易策略
Author: ChaoZhang, Date: 2024-03-22 16:03:09Tags:

概述
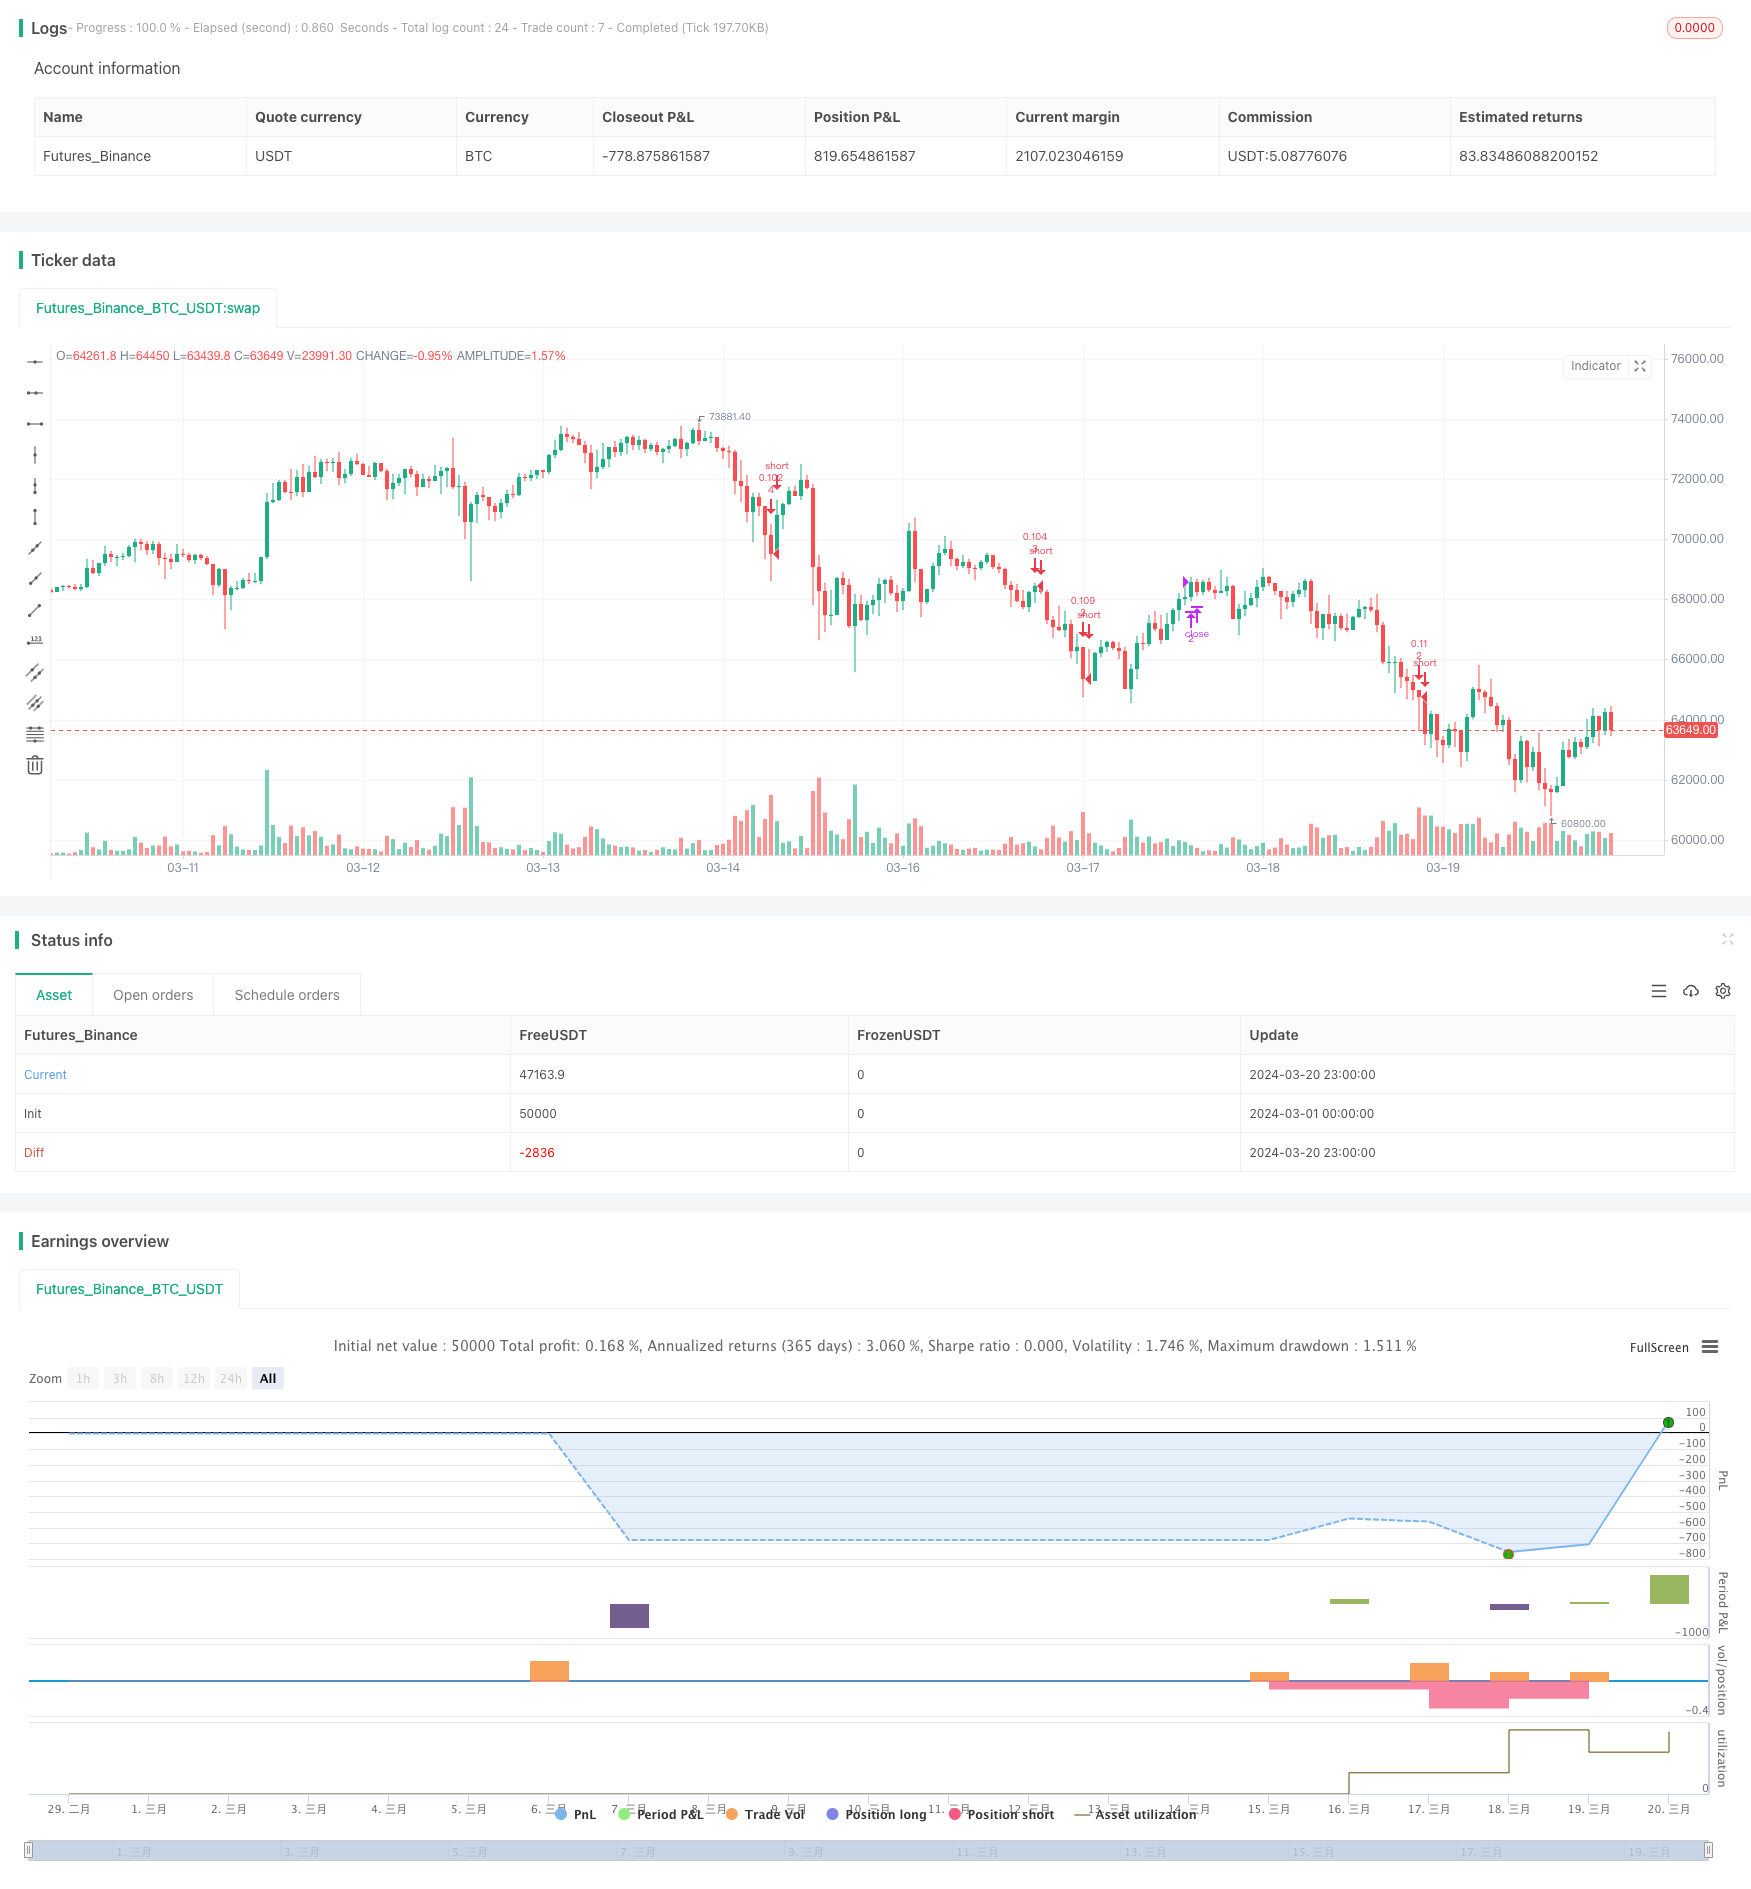
这是一个高级的动态网格趋势追踪量化交易策略。该策略的主要思想是在预先设定的价格区间内划分多条网格线,并在价格触及网格线时自动建仓买入或平仓卖出,从而在震荡行情中获利。同时,该策略还具有动态调整网格线位置的功能,可以根据最近的价格走势自适应地优化网格布局。
策略原理
该策略的核心原理如下:
首先根据用户设置,确定网格的上下边界和网格线的数量。边界可以是固定值,也可以基于近期高低点或移动平均线自动计算得出。
在确定的边界内,将价格区间等分为若干网格。每条网格线对应一个买入或卖出的价位。
在每个价格触及网格线时,策略会检查是否已经持有该网格线对应的仓位。如果没有则建仓买入,如果有则平仓卖出。
通过在相对高位卖出,低位买入的方式,策略可以在价格震荡时不断获利。
同时,如果用户启用了自动边界调整功能,则网格线的位置会根据近期价格的高低点或所设置的移动平均线进行自适应调整,以优化网格布局。
通过以上原理,该策略能够实现在价格震荡行情下的自动低买高卖,并根据趋势调整获利点位,从而提高整体收益。
优势分析
该动态网格策略具有以下优势:
适应性强。可以通过参数设置适应不同的市场和品种,对震荡行情有很好的适应性。
自动化程度高。由于策略基于严格的数学逻辑,建仓平仓点位明确,因此可以实现完全自动化交易,减少主观情绪的干扰。
风险可控。通过设置网格数量、网格边界等参数,可以有效控制每次交易的风险敞口,从而将总体风险维持在可接受范围内。
趋势适应性。策略中加入了动态调整网格边界的功能,使得网格能够跟随价格趋势而优化,提高了趋势行情下的盈利能力。
胜率稳定。由于网格交易本质上是在价格震荡中频繁高抛低吸,只要价格维持震荡,该策略就能持续获利,因此长期来看具有较高的胜率。
风险分析
尽管该策略优势明显,但同时也存在一定风险:
趋势风险。如果价格发生强烈单边趋势突破网格边界,该策略的盈利空间将受到限制,并可能面临较大回撤。
参数优化难度大。该策略参数较多,包括网格数量、初始边界、动态边界参数等,不同参数组合对策略绩效影响很大,实际优化难度不小。
频繁交易。网格策略本质上是一种高频策略,建仓平仓非常频繁,这意味着较高的交易成本和潜在的滑点风险。
对行情依赖性强。该策略对震荡行情的依赖性很强,一旦价格进入快速单边趋势,该策略很可能面临较大回撤。
针对这些风险,可以从以下方面着手改进:加入趋势判断指标作为策略启动的过滤条件,优化参数搜索空间和方法,引入资金管理和仓位控制逻辑,增加趋势突破平仓逻辑等。通过这些优化,可以进一步提升该策略的稳健性和盈利能力。
优化方向
基于以上分析,该策略的优化方向主要有:
引入趋势过滤条件。在策略启动前加入趋势判断指标,如移动平均线、ADX等,只有在震荡行情下才启动策略,而在趋势行情下则保持观望,这样可以有效避免趋势行情下的回撤风险。
优化参数搜索。采用智能算法优化网格参数,如遗传算法、粒子群算法等,从而自动寻找最优参数组合,提高优化效率和质量。
增强风控逻辑。在策略中加入更多风控逻辑,如根据价格波动率动态调整网格宽度,设置最大回撤阈值触发平仓等,从而更好地控制风险。
引入趋势止损。设置趋势突破止损线,如网格边界的一定比例,一旦价格突破止损线则全平仓位,避免趋势行情下的巨大回撤。
优化交易执行。对交易执行环节进行优化,如采用更高级的条件单和订单算法,尽量降低交易频率和成本,提高执行效率。
通过以上优化,可以全面提升该策略的适应性、稳健性和盈利能力,使其更加贴近实盘需求。
总结
总的来说,该动态网格趋势追踪策略是一个基于网格交易原理、同时融入了动态调整和趋势适应机制的中高频量化交易策略。它的优势在于适应性强、自动化程度高、风险可控、趋势适应性好、胜率稳定等,但同时也存在趋势风险、参数优化难度大、频繁交易、对行情依赖性强等风险。针对这些问题,可以从趋势过滤、参数优化、风控增强、趋势止损、交易优化等方面着手改进,提升策略的整体性能。
网格交易思路本身是一种相对成熟和实用的量化方法,通过该策略的动态优化和趋势适应机制的加入,使得经典网格交易的优势得到了延伸和发展。为投资者在震荡行情下提供了一种新的量化交易思路和可能性。经过进一步的优化和改进,该策略有望成为一个优秀的中高频量化交易工具。
/*backtest
start: 2024-03-01 00:00:00
end: 2024-03-21 00:00:00
period: 1h
basePeriod: 15m
exchanges: [{"eid":"Futures_Binance","currency":"BTC_USDT"}]
*/

//@version=4
strategy("(IK) Grid Script", overlay=true, pyramiding=14, close_entries_rule="ANY", default_qty_type=strategy.cash, initial_capital=100.0, currency="USD", commission_type=strategy.commission.percent, commission_value=0.1)
i_autoBounds    = input(group="Grid Bounds", title="Use Auto Bounds?", defval=true, type=input.bool)                             // calculate upper and lower bound of the grid automatically? This will theorhetically be less profitable, but will certainly require less attention
i_boundSrc      = input(group="Grid Bounds", title="(Auto) Bound Source", defval="Hi & Low", options=["Hi & Low", "Average"])     // should bounds of the auto grid be calculated from recent High & Low, or from a Simple Moving Average
i_boundLookback = input(group="Grid Bounds", title="(Auto) Bound Lookback", defval=250, type=input.integer, maxval=500, minval=0) // when calculating auto grid bounds, how far back should we look for a High & Low, or what should the length be of our sma
i_boundDev      = input(group="Grid Bounds", title="(Auto) Bound Deviation", defval=0.10, type=input.float, maxval=1, minval=-1)  // if sourcing auto bounds from High & Low, this percentage will (positive) widen or (negative) narrow the bound limits. If sourcing from Average, this is the deviation (up and down) from the sma, and CANNOT be negative.
i_upperBound    = input(group="Grid Bounds", title="(Manual) Upper Boundry", defval=0.285, type=input.float)                      // for manual grid bounds only. The upperbound price of your grid
i_lowerBound    = input(group="Grid Bounds", title="(Manual) Lower Boundry", defval=0.225, type=input.float)                      // for manual grid bounds only. The lowerbound price of your grid.
i_gridQty       = input(group="Grid Lines",  title="Grid Line Quantity", defval=8, maxval=15, minval=3, type=input.integer)       // how many grid lines are in your grid

f_getGridBounds(_bs, _bl, _bd, _up) =>
    if _bs == "Hi & Low"
        _up ? highest(close, _bl) * (1 + _bd) : lowest(close, _bl)  * (1 - _bd)
    else
        avg = sma(close, _bl)
        _up ? avg * (1 + _bd) : avg * (1 - _bd)

f_buildGrid(_lb, _gw, _gq) =>
    gridArr = array.new_float(0)
    for i=0 to _gq-1
        array.push(gridArr, _lb+(_gw*i))
    gridArr

f_getNearGridLines(_gridArr, _price) =>
    arr = array.new_int(3)
    for i = 0 to array.size(_gridArr)-1
        if array.get(_gridArr, i) > _price
            array.set(arr, 0, i == array.size(_gridArr)-1 ? i : i+1)
            array.set(arr, 1, i == 0 ? i : i-1)
            break
    arr

var upperBound      = i_autoBounds ? f_getGridBounds(i_boundSrc, i_boundLookback, i_boundDev, true) : i_upperBound  // upperbound of our grid
var lowerBound      = i_autoBounds ? f_getGridBounds(i_boundSrc, i_boundLookback, i_boundDev, false) : i_lowerBound // lowerbound of our grid
var gridWidth       = (upperBound - lowerBound)/(i_gridQty-1)                                                       // space between lines in our grid
var gridLineArr     = f_buildGrid(lowerBound, gridWidth, i_gridQty)                                                 // an array of prices that correspond to our grid lines
var orderArr        = array.new_bool(i_gridQty, false)                                                              // a boolean array that indicates if there is an open order corresponding to each grid line

var closeLineArr    = f_getNearGridLines(gridLineArr, close)                                                        // for plotting purposes - an array of 2 indices that correspond to grid lines near price
var nearTopGridLine = array.get(closeLineArr, 0)                                                                    // for plotting purposes - the index (in our grid line array) of the closest grid line above current price
var nearBotGridLine = array.get(closeLineArr, 1)                                                                    // for plotting purposes - the index (in our grid line array) of the closest grid line below current price
strategy.initial_capital = 50000
for i = 0 to (array.size(gridLineArr) - 1)
    if close < array.get(gridLineArr, i) and not array.get(orderArr, i) and i < (array.size(gridLineArr) - 1)
        buyId = i
        array.set(orderArr, buyId, true)
        strategy.entry(id=tostring(buyId), long=true, qty=(strategy.initial_capital/(i_gridQty-1))/close, comment="#"+tostring(buyId))
    if close > array.get(gridLineArr, i) and i != 0
        if array.get(orderArr, i-1)
            sellId = i-1
            array.set(orderArr, sellId, false)
            strategy.close(id=tostring(sellId), comment="#"+tostring(sellId))

if i_autoBounds
    upperBound  := f_getGridBounds(i_boundSrc, i_boundLookback, i_boundDev, true)
    lowerBound  := f_getGridBounds(i_boundSrc, i_boundLookback, i_boundDev, false)
    gridWidth   := (upperBound - lowerBound)/(i_gridQty-1)
    gridLineArr := f_buildGrid(lowerBound, gridWidth, i_gridQty)

closeLineArr    := f_getNearGridLines(gridLineArr, close)
nearTopGridLine := array.get(closeLineArr, 0)
nearBotGridLine := array.get(closeLineArr, 1)
- AlphaTrend和布林带相结合的均值回归+趋势跟踪策略
- 网格美元成本平均策略
- 基于三连阳/阴和双均线的量化交易策略
- 基于多重移动平均线、RSI 和标准差出场的蜡烛线高度突破交易策略
- 币安账户万向划转小工具
- 网格交易风险对冲策略
- 基于抛物线指标和移动平均线的多空趋势判断策略
- 多空线性交叉策略
- 基于趋势动量的多指标均线交叉策略
- 唐奇安通道突破策略
- 布林带动态止盈与动态加仓策略
- TrippleMACD均线交叉与相对强弱指标结合的高频加密货币交易策略
- RSI与EMA双重过滤策略
- 基于网格的多头 Martingale 动态加仓网格交易策略
- 双重指数移动平均云交叉自动交易策略
- 基于双时间框架EMA交叉信号的多空策略
- 赫尔移动平均交叉策略
- 双均线交叉优化止损策略
- 趋势突破策略
- 多重均线与RSI交叉交易策略