概述
本策略是一种基于动量和趋势的交易策略,主要利用指数移动平均线(EMA)和相对强弱指标(RSI)来捕捉市场的短期动量机会。策略的核心思想是在价格突破长期EMA且RSI达到超买区域时入场,在RSI达到超卖区域时出场,从而实现对短期强势行情的把握。这种方法旨在捕捉市场情绪的快速变化,特别适合在波动较大的市场环境中应用。
策略原理
策略的运作原理如下:
- 使用一个周期较长(450)的EMA作为主要趋势指标。
- 采用14周期的RSI作为动量指标。
- 设定RSI的买入阈值为67,卖出阈值为80。
- 当价格向上突破EMA且RSI同时高于67时,触发买入信号。
- 当RSI超过80时,触发卖出信号。
这种设计利用了EMA的趋势跟踪特性和RSI的动量捕捉能力。EMA突破确保了整体趋势的方向,而RSI的高位则表明市场处于强势状态。通过在RSI达到更高水平时退出,策略试图在动量减弱之前获利了结。
策略优势
- 动量捕捉: 策略能够有效捕捉短期强势行情,适合快速波动的市场。
- 趋势确认: 结合EMA和RSI,既考虑了整体趋势,又关注短期动量,降低了虚假信号的风险。
- 快速反应: 5分钟时间框架使策略能够对市场变化做出迅速反应。
- 风险管理: 通过设定明确的入场和出场条件,有助于控制风险。
- 灵活性: 策略参数可调,允许交易者根据不同市场条件进行优化。
- 自动化: 策略可以轻松实现自动化交易,减少人为情绪干扰。
策略风险
- 过度交易: 在高波动市场中可能产生频繁的交易信号,增加交易成本。
- 滞后性: EMA作为滞后指标,可能在快速反转行情中反应不及时。
- RSI局限性: RSI在强势趋势中可能长期处于超买或超卖状态,导致错失机会或过早退出。
- 市场噪音: 5分钟时间框架容易受到短期市场噪音的影响,可能产生虚假信号。
- 单一市场依赖: 策略推荐用于特定交易对,可能不适用于所有市场条件。
- 参数敏感性: 策略表现可能对参数设置高度敏感,需要持续优化。
策略优化方向
- 动态参数调整: 考虑根据市场波动性动态调整EMA和RSI参数,以适应不同市场环境。
- 多时间框架分析: 引入更长时间框架的确认信号,如1小时或4小时图表,以减少虚假信号。
- 止损机制: 加入适当的止损策略,如跟踪止损,以更好地控制风险。
- volume筛选: 结合交易量分析,在高成交量时段确认信号,提高策略可靠性。
- 趋势强度过滤: 使用ADX等指标评估趋势强度,只在强趋势中交易。
- 多指标融合: 考虑引入其他动量指标如MACD或Stochastic,构建更全面的入场和出场条件。
- 回测优化: 在不同市场周期和多个交易对上进行广泛回测,找出最优参数组合。
总结
动量驱动型均线-RSI交叉策略是一种结合了趋势跟踪和动量交易理念的短期交易策略。通过巧妙利用EMA和RSI指标,该策略旨在捕捉市场的短期强势动向,特别适合在波动较大的市场中应用。虽然策略设计简洁明了,但其有效性很大程度上取决于参数设置和市场条件。
为了充分发挥策略潜力,交易者需要注意以下几点:首先,持续监控和优化策略参数,以适应不断变化的市场环境;其次,考虑引入额外的风险管理措施,如设置合理的止损位;再者,可以尝试将该策略与其他分析方法或指标结合,以获得更全面的市场洞察。
最后,尽管该策略在理论上具有捕捉短期动量的优势,但实际交易中仍需谨慎。建议在实盘交易前进行充分的回测和模拟交易,并时刻关注市场变化,及时调整策略以应对不同的市场状况。只有通过不断学习和优化,才能真正发挥这个策略的潜力,在复杂多变的金融市场中获得稳定收益。
策略源码
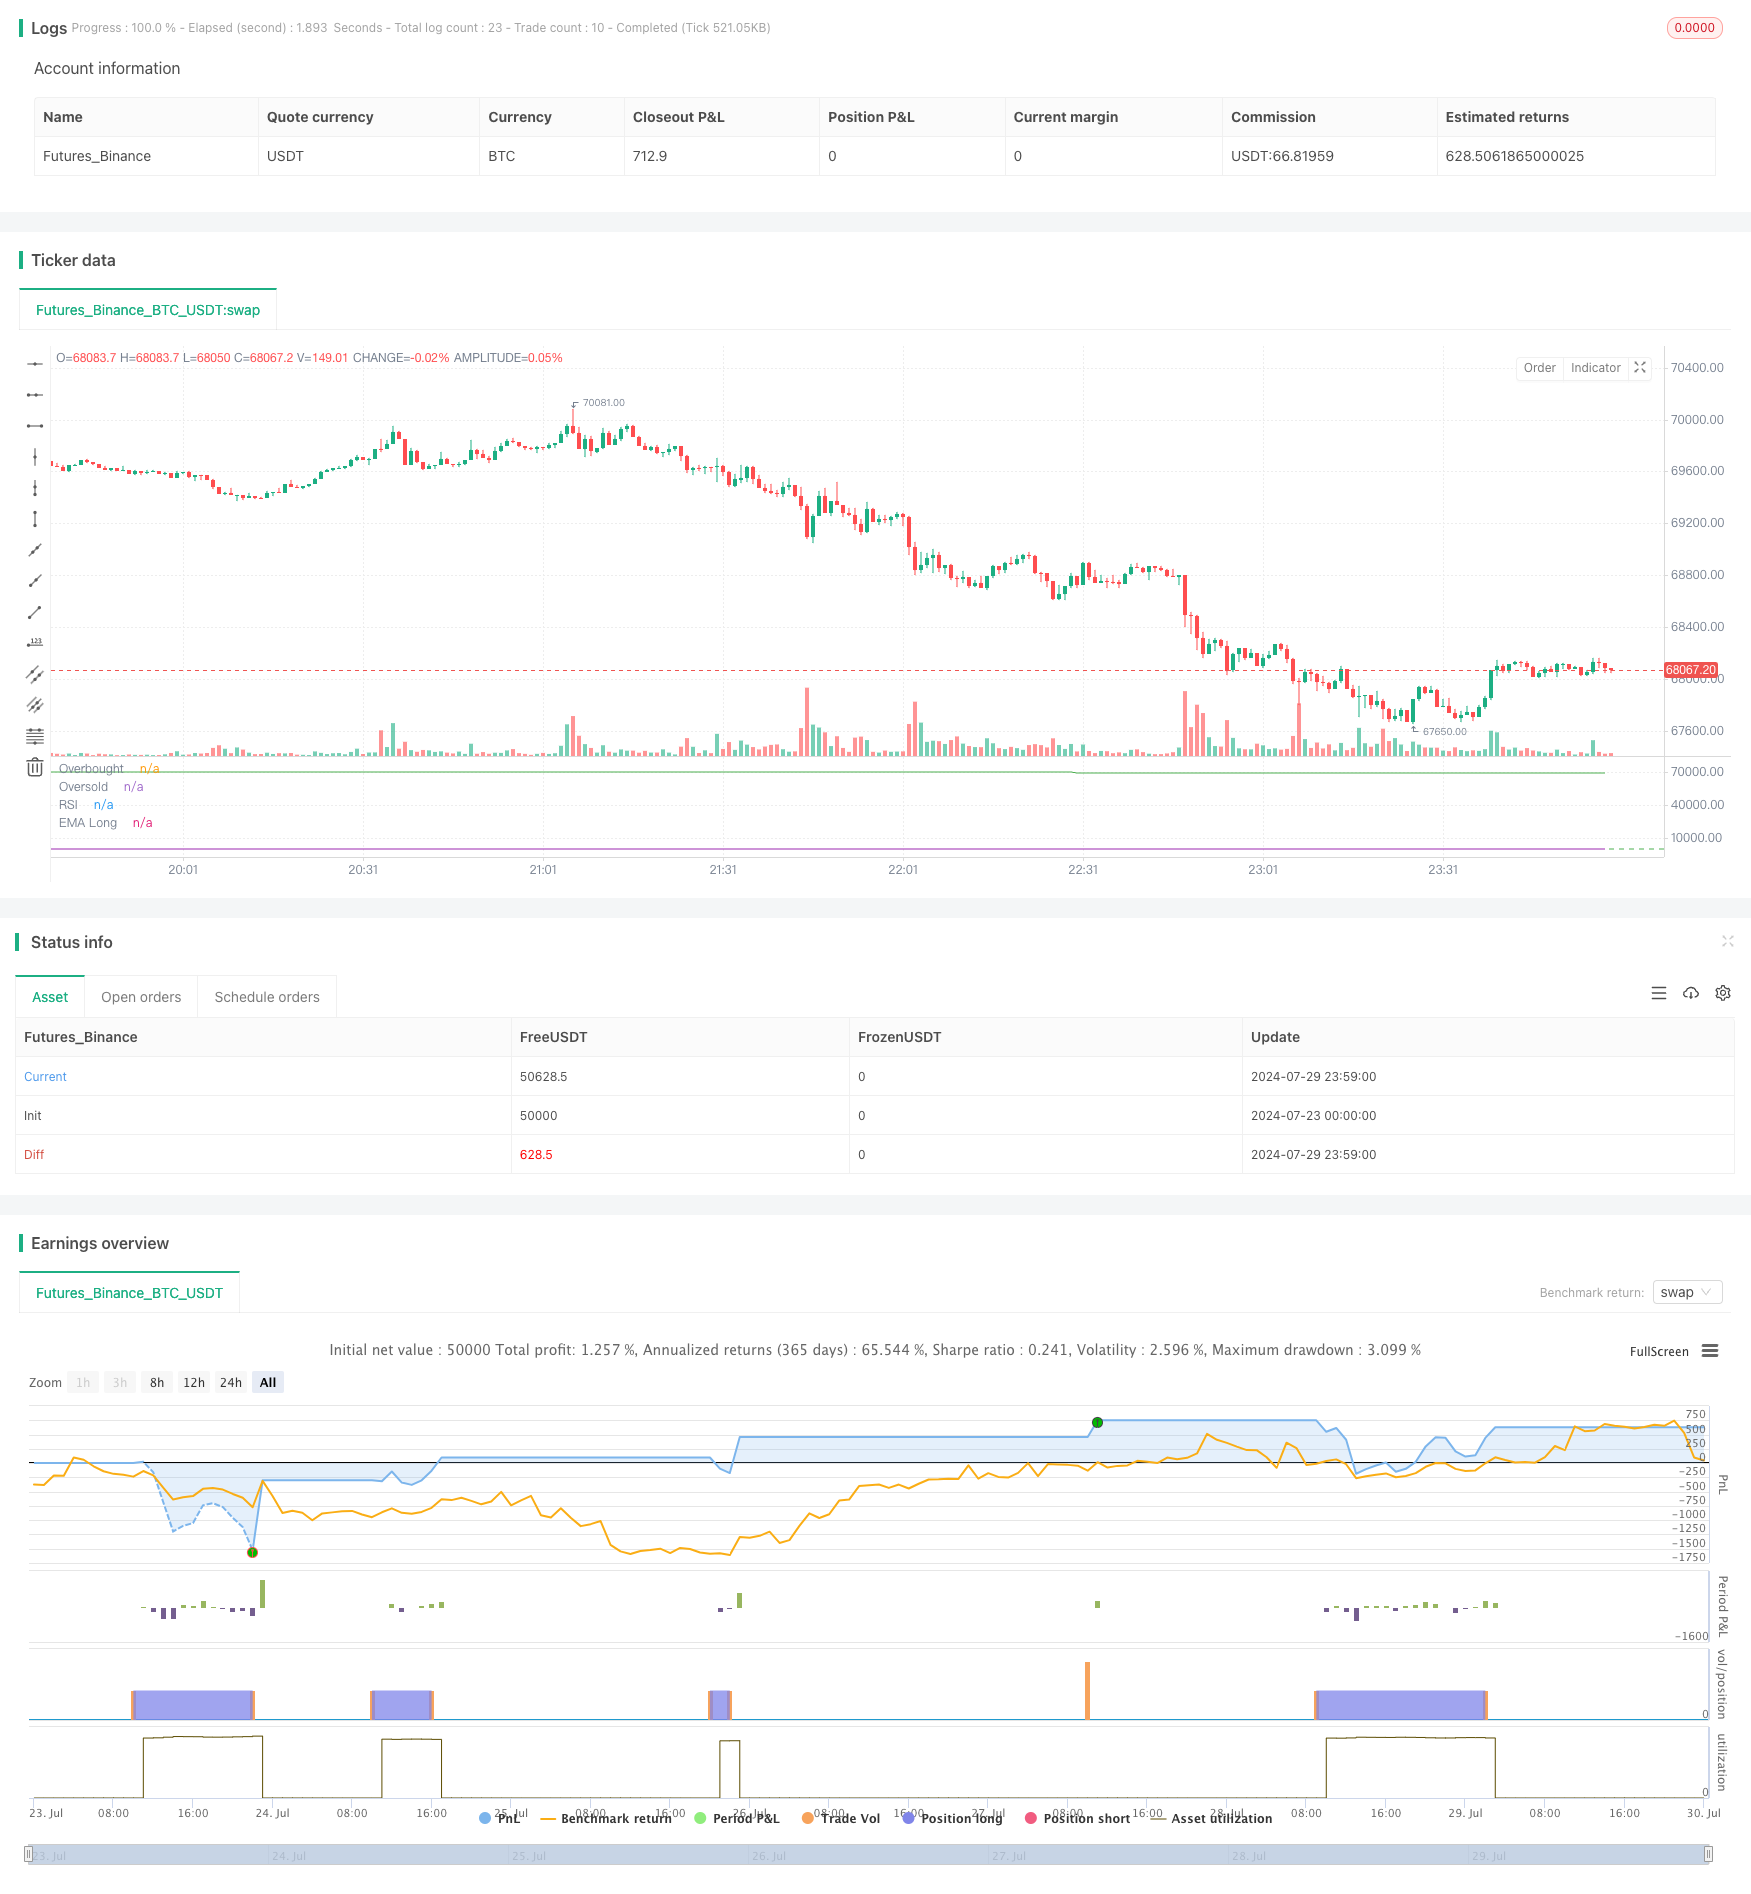
/*backtest
start: 2024-07-23 00:00:00
end: 2024-07-30 00:00:00
period: 1m
basePeriod: 1m
exchanges: [{"eid":"Futures_Binance","currency":"BTC_USDT"}]
*/

//@version=5
strategy("EMA RSI Momentum Strategy TF5min [capayam.com]", overlay=false)

//Desc: Buys when price crosses above long EMA line and above RSI Buy threshold. Exits when RSI above Sell threshold.
//Recomended pair: RNDRUSDT TF5min (Binance)

// Adjustable Inputs
emaLength = input.int(450, title="EMA Length")
rsiLength = input.int(14, title="RSI Length")
rsiOverboughtLevel = input.int(80, title="RSI Sell Threshold")
rsiOversoldLevel = input.int(67, title="RSI Buy Threshold")


// Define the EMAs
ema = ta.ema(close, emaLength)

// Define the RSI
rsi = ta.rsi(close, rsiLength)


// Buy Condition: Price crosses above Long EMA and RSI buy Threshold
buyCondition = ta.crossover(close, ema) and rsi > rsiOversoldLevel

// Exit Condition
exitCondition = rsi > rsiOverboughtLevel

// Plot the EMAs
plot(ema, color=color.green, title="EMA Long")


// Plot the RSI
hline(rsiOverboughtLevel, "Overbought", color=color.red)
hline(rsiOversoldLevel, "Oversold", color=color.green)
plot(rsi, title="RSI", color=color.purple)

// Strategy entry and exit
if (buyCondition)
    strategy.entry("Buy", strategy.long)

if (exitCondition)
    strategy.close("Buy")
相关推荐